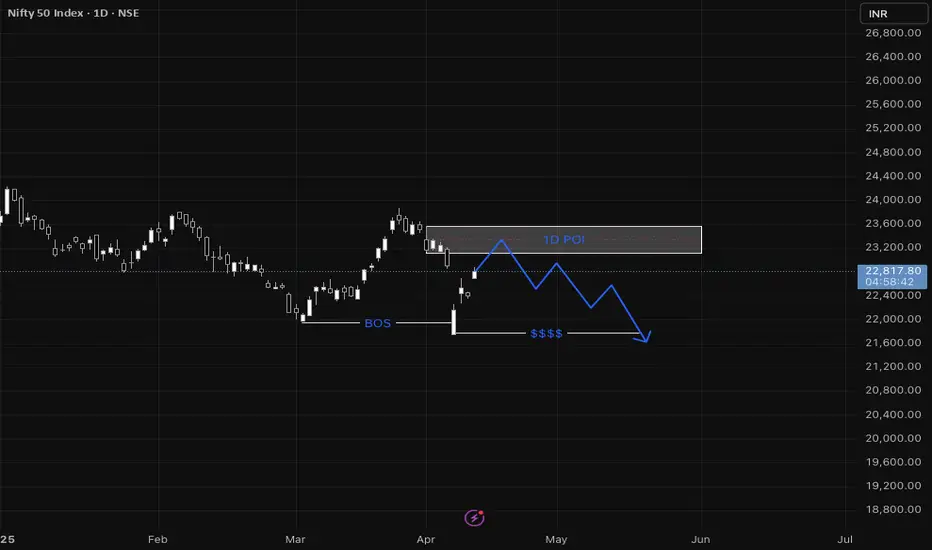
NIFTYNifty has broken structure on the daily timeframe. I’m now waiting for it to collect liquidity and retest the daily point of interest. Looking for confirmation on the one-hour timeframe is a strategic approach to refine the entry.
Nifty50
NIFTY 50 – Top-Down Analysis Amidst Tariff TurbulenceWith global markets shaken by Trump’s recent tariff rhetoric, it's time we zoom out and analyze what Nifty 50 is actually saying — from a multi-timeframe lens. Price tells a story, and here's how it's unfolding across the Monthly, Weekly, and Daily charts:
🟩 Monthly Chart (1M) – The Bigger Picture
The macro trend is nearing a critical MTF decision point.
🔁 This is the make-or-break zone for the larger structure.
🟥 Weekly Chart (1W) – Bearish Momentum Still in Play
Structure is currently bearish, with lower highs and lower lows.
🧠 Key Thought: Don’t assume trend change without structure breaking clearly.
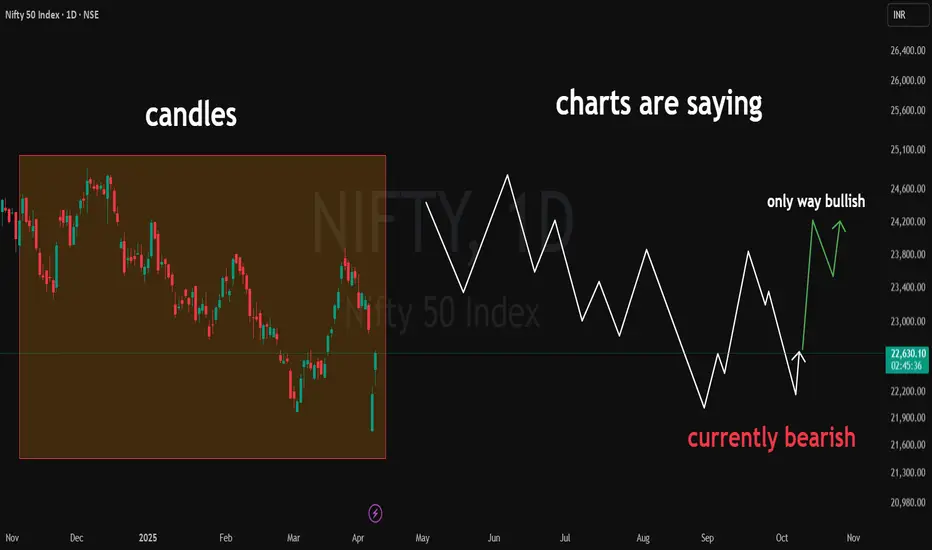
🟧 Daily Chart (1D) – Battle Zone
Price action is noisy but insightful.
We have a potential bullish scenario unfolding — but it’s fragile
Only bullish structure is if price defends recent lows and breaks above resistance in a clean impulse-retrace-impulse fashion.
Despite external triggers like Trump’s tariff announcements, the technical structure across timeframes is telling us one thing:
⚠️ “No bias until structure confirms.”
Nifty next one year viewHello viewers,
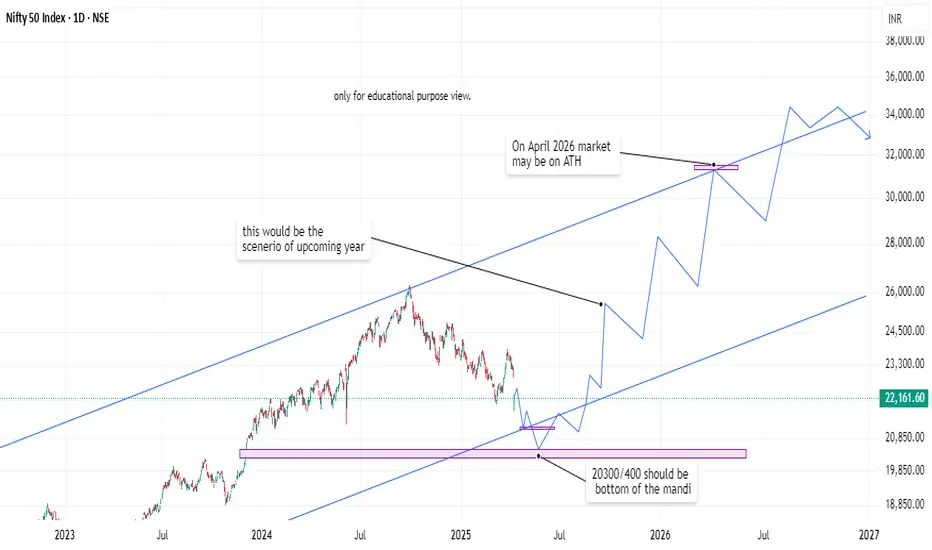
Today i observed elliot wave and gape theory anlaysis on the basis of channel range.
Nifty bottom is around 20400/20500 after that nifty may reverse for ATH al time high by april 2026 which is around 31000++ this is the overall analysis for upcoming year in simple view.
Disclaimer = do own analysis before any trade, this view is only for educational purpose.
NIFTY50 - AN INGISHT FOR INVESTORSSymbol - NIFTY50
CMP 25305
If you are a long term investor, one thing that will help you to decide when to invest - Nifty monthly RSI.
As and when RSI moved above 80, markets uniformly correctly (around 20% usually) & as and when RSI came below 40 level, markets uniformly rallied.
Now RSI is at 82
Fundamentals are also showing that overall market is modestly overvalued.
What you want to do or should you be worried ?
tell me in comments below.
P.S. : I'm out of all longs & have entered shorts.

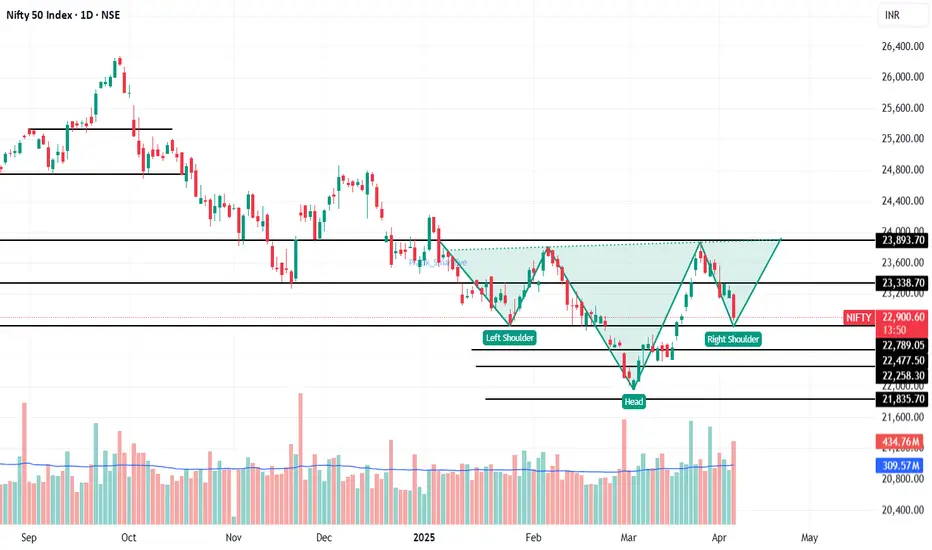
Nifty 50 Index spot 22904.45 by Daily Chart viewNifty 50 Index spot 22904.45 by Daily Chart view
- Resistance Zone at 23875 to 23975 for Nifty 50 Index Band
- Can we expect the Right Shoulder depth act as a Support base alike of the Left Shoulder depth near 22700 to 22800 ???
- If the Right Shoulder gets sustained, a Support base in sync with the Left Shoulder of the Bullish Head & Shoulder pattern may get activated
- Let us hope for the best to happen expecting some fresh breather over the next week basis the fact that, the Markets are always Supreme to look up to ......

NIFTY 50 next week levels?Will Nifty50 go to the level of 22,100 next week?
Or will the bulls be awake at the level of 22,416 and take Nifty50 above 24,024?
Let`s find out next week.
until have a good holiday guys.
Nifty50 expecting to form Inverted Head & ShoulderNifty50 expecting to form Inverted Head & Shoulder
What do you think?
Support levels of 22,790 to be tested & Bounces then pattern breakout expected at 23900.
If breaks below 22,790 then next support is 22,480.
NIFTY50 - DON'T MISTAKE THIS RALLY FOR A TREND REVERSALSymbol - NIFTY50
CMP - 23350.40
The Nifty50 is still trading within a bearish technical structure. As of now, the index is currently trading at 23350 after a strong up move. Given the ongoing downtrend and resistance levels, there is a strong possibility that Nifty may experience a pullback from these levels.
I had shared a trading idea on Nifty50 when it was trading around the 21900-22100 levels, stating that a retracement on the long side was due and that it could easily touch the 22800-23000 levels. Nifty gave a strong up move from those levels, and both targets have been reached.
Upon closer inspection of the Nifty chart, it is evident that the index is still in a downtrend, making lower lows since the beginning of its fall. We witnessed a sharp rally from the 21800-22000 zone, which is common in a bear market. Such sharp rallies are often misinterpreted as trend reversals, but in reality, the faster these rallies come, the quicker they tend to get sold.
The bearish structure remains intact and has not been broken. For now, Nifty still appears to be a sell on rise. For those following the trend, the 23300-23600 zone is the ideal range to go short, as this area aligns with a strong resistance zone and the formation of another swing high.
At this point, it seems likely that the market may consolidate between the 23300-23600 zone before showing a sharp down move. If the market does reverse its trend, we can only consider that possibility after a breakout above the 24000 zone, which would be a key signal for a trend shift.

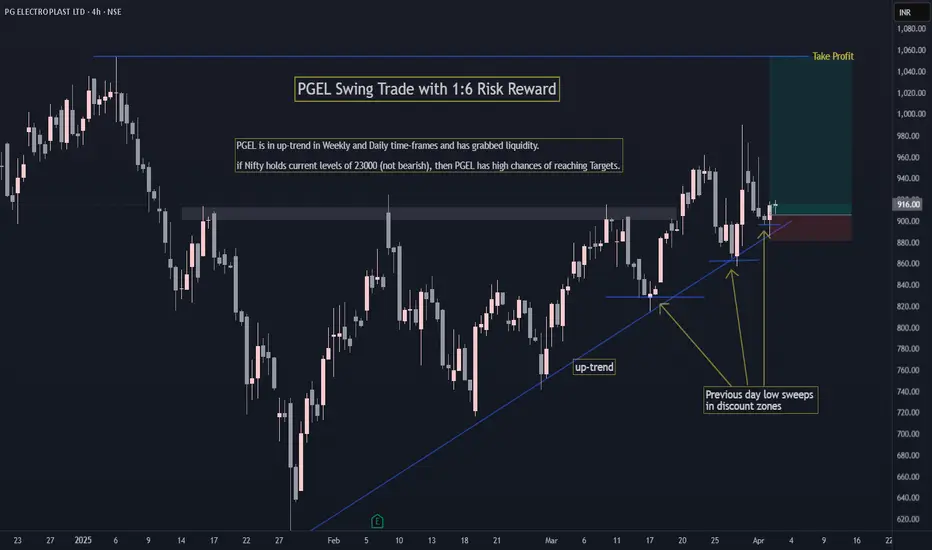
PGEL Swing Trade with 1:6 RRPGEL is in up-trend in Weekly and Daily time-frames.
It has grabbed liquidity from previous day low.
1:6 Risk to Reward. (on a safer side you can take 1:5 RR trade by increasing your SL a bit).
if Nifty holds current levels of 23000 (ie. not bearish), then PGEL has high chances of reaching Targets.
Happy trading!
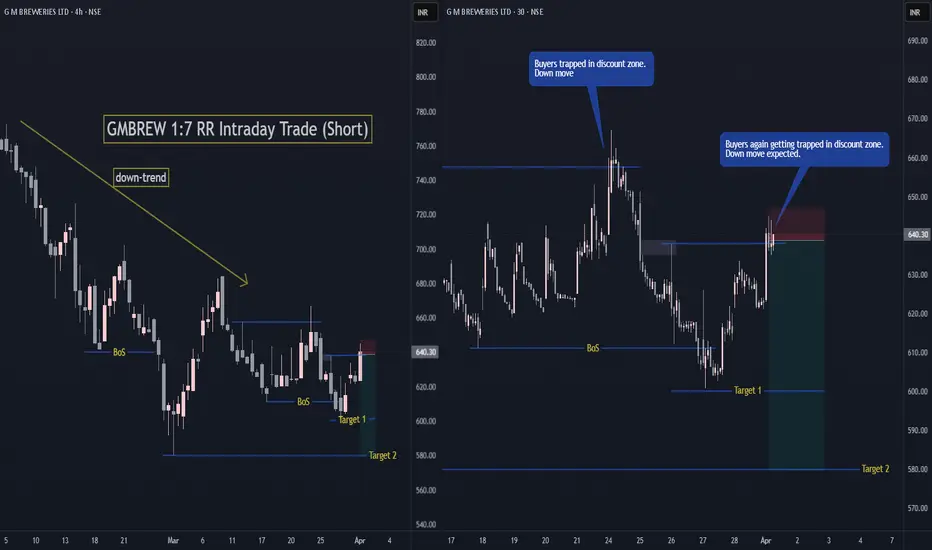
G M BREWRIES Intraday Trade (Short)GMBREW 1:7 RR Intraday Trade (Short) , Simple trade based on Trend and Liquidity Sweep in discount zone.
If Nifty is not bullish from current levels for today and tomorrow's session, then GMBREW has good chances of hitting Target 2.
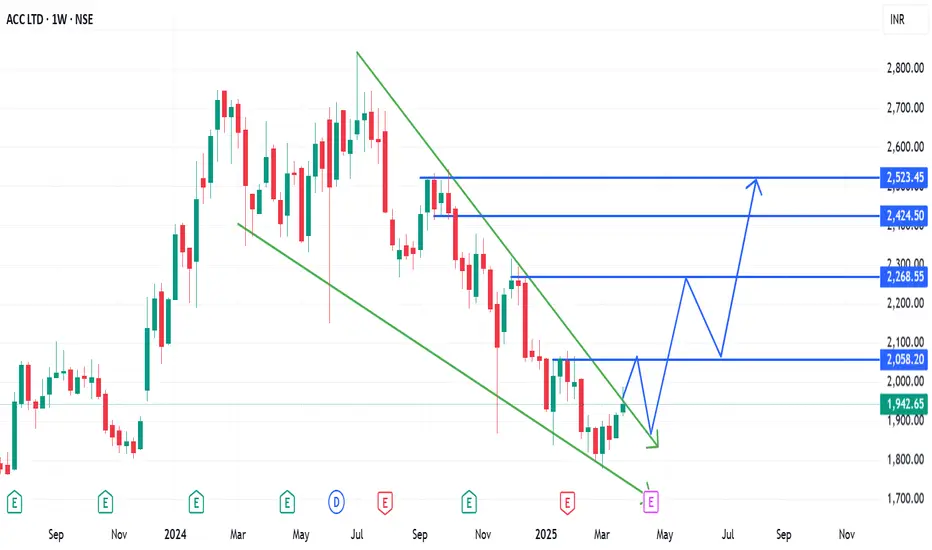
A possible trend reversal in ACC. (01/04/2025)ACC Ltd is trading in a narrow range and is in a downtrend. There are chance of a trend reversal as the indicators are predicting and the price action too seems to follow with them.
The channel break out in the stock can confirm the trend reversal. If the stock give a break out and retest, stock can be bought in cash or in F&O segment too.
Good targets can be captured in the stock as the break out after a year will be there.
Stop loss and Targets should be as per the risk to reward appetite.
Wait for the price action and trade accordingly. Patience will help in capturing the most profitable trades, otherwise losses will be eating away the capital.
Nifty Faces Resistance: Bullish Momentum Expected Above 24kNifty has breached its trendline resistance but encountered selling pressure near the 23,870 level, suggesting a possible pullback toward the 23,000 support zone.
A potential Inverted Head & Shoulder pattern is forming, which could signal a trend reversal. However, confirmation would require a decisive breakout and sustained hold above the 24,000 resistance level. Also the open interest data indicates strong call writing at 24,000, reinforcing its significance as a key resistance.
In the near term, the index is expected to trade sideways, with market participants awaiting Q4 earnings results for further directional cues. The upcoming earnings season will likely dictate the next major move in the market.

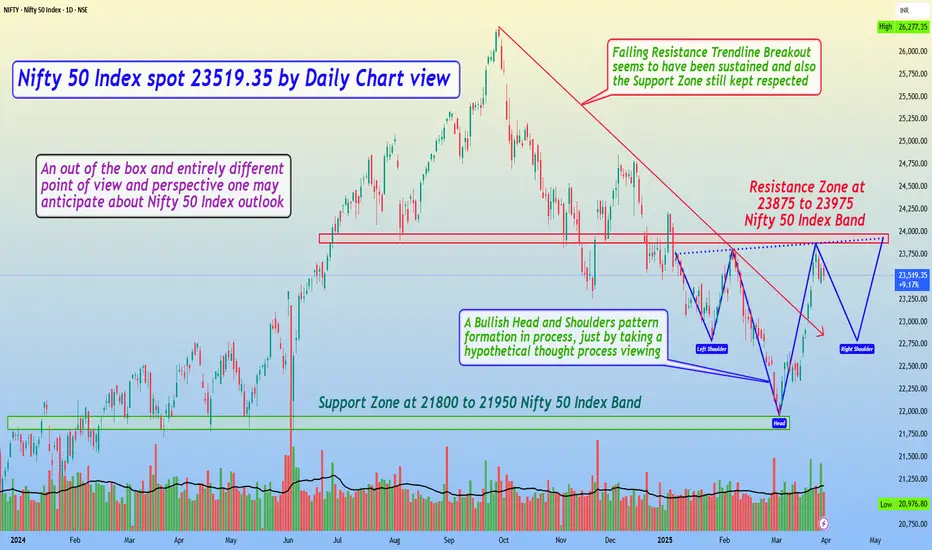
Nifty 50 Index spot 23519.35 by Daily Chart view - Weekly updateNifty 50 Index spot 23519.35 by Daily Chart view - Weekly update
- Support Zone at 21800 to 21950 Nifty 50 Index Band
- Resistance Zone at 23875 to 23975 Nifty 50 Index Band
- Falling Resistance Trendline Breakout seems to have been sustained and also Support Zone still kept respected
- A Bullish Head and Shoulders pattern formation in process, just by taking a hypothetical thought process viewing
- An out of the box and entirely different point of view and perspective one may anticipate about Nifty 50 Index outlook
- Going by this Hypothetical H&S probability for the Nifty 50 Index Chart, we may anticipate good fire crackers to observe
- As such this is just a high level technical chart pattern formation and the Market are always Supreme to work in their own ways
Video For Traders Options trading is a type of financial trading that allows investors to buy or sell the right to purchase or sell an underlying asset at a fixed price, at a future date. Options trading operates on the basis that the buyer has the option to exercise the contract but is not under any obligation to do so.
Trading options offers a number of benefits for an active trader: Options can offer high returns and do so over a short period, allowing you to multiply your money quickly if your wager is right. With options, it can cost less to get the same exposure to a stock's price movement than it does to buy the stock directly.

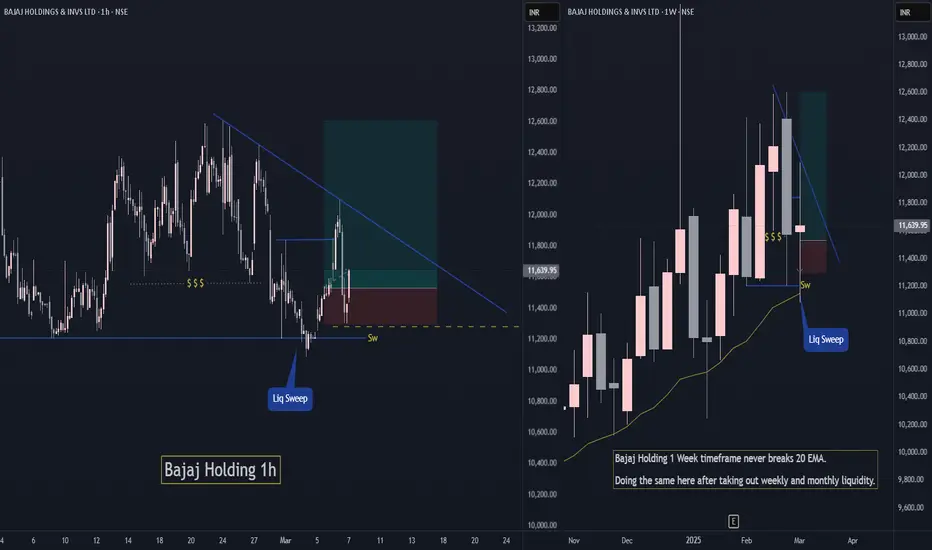
Bajaj Holding Short Term Swing TradeBajaj holding has grabbed monthly and weekly liquidity while maintaining is uptrend.
If Nifty holds current levels ie. above 22400 then Bajaj Holding has high chances to move up and continue its trend.
Do like or follow for more Trading ideas like these. You can comment your views on this analysis.
GUJARAT FLUOROCHEM Swing TradeOn weekly time frame, a liquidity pool was formed and sellers got trapped two times in GUJARAT FLUOROCHEM forming a double bottom, which can fuel a good potential up move.
Also it has recently grabbed liquidity from previous day low so if Nifty holds above 23400 then there are good chances of GUJARAT FLUOROCHEM to reach T1 which will be a 1:4 RR trade.

Nifty 50 upcoming levelThe Nifty 50 has recently formed a bottom around 21,964.
Nifty is showing a one-directional move from that level, and momentum is increasing with each candle.
Previously, Nifty faced resistance around 23,780, and the current price is 23,658, just 120 points away from the previous resistance.
After a quick rally, Nifty 50 may encounter resistance near 23,780, and an Inverse Head & Shoulders formation is possible.
Note: Resistance does not guarantee a confirmed reversal, but we need to monitor price action at that level to determine whether it is breaking and sustaining the resistance.
Stay tuned for more updates!
Hit the Boost button for regular updates!

All Financial MarketIn India, there exists broadly two types of Financial Markets which are further classified : Money Market is a market that deals with short-term funds. The capital market is a market that deals with long-sighted funds. Lenders and borrowers can trade funds through the financial system.
Different types of financial markets include stock markets, bond markets, forex markets, and commodities markets. Stock markets facilitate the buying and selling of company shares, while bond markets deal with debt securities. Forex markets enable currency exchange, and commodities markets trade physical goods.29 Aug 2024

Trading with Professionals Identifying the trend. This is the first step in technical analysis for traders because trading strategies can either follow the trend or go against the trend. ...
Drawing support and resistance levels. ...
Establishing entry and exit points. ...
Position sizing and risk management.
What exactly are the two types of technical analysis? Chart patterns and technical (statistical) indicators are the two main types of technical analysis. Chart patterns are a subjective type of technical analysis in which technicians use certain patterns to indicate regions of support and resistance on a chart.

Abbott India Swing TradeOn weekly time frame, sellers are trapped badly in Abbott India which can fuel a good potential up move. Also it has recently grabbed liquidity from previous week low so if Nifty holds above 23000 then there are high chances of Abbott to reach T1 and T2 which will be a 1:5 RR trade.

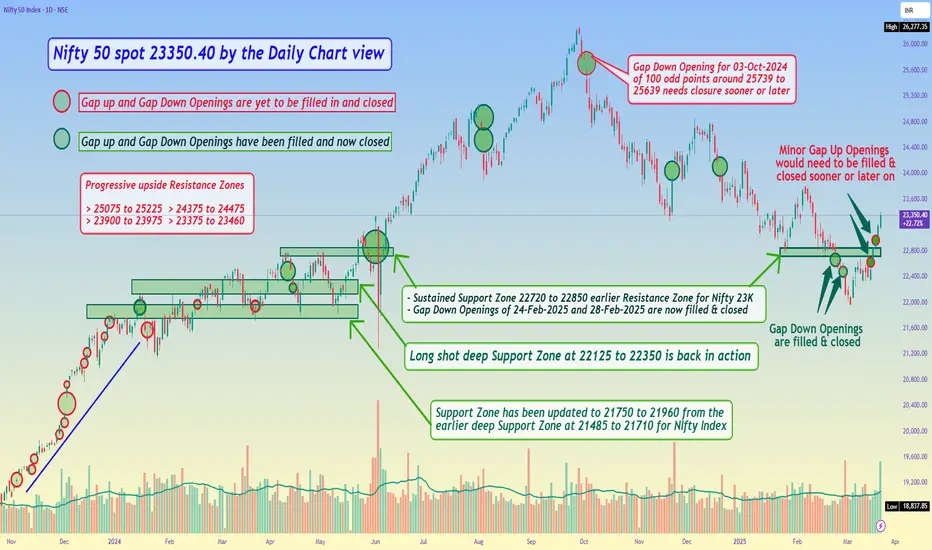
Nifty 50 spot 23350.40 by the Daily Chart view - Weekly updateNifty 50 spot 23350.40 by the Daily Chart view - Weekly update
- Sustained Support Zone 22720 to 22850 earlier Resistance Zone for Nifty 23K
- Minor Gap Up Openings around above Support Zone would need to be filled & closed sooner or later on
- Next set of Resistance Zones seen at indicative Nifty 50 Index levels of 23375 to 23460 and 23900 to 23975
Advanced Technical Analysis #DivergenceDivergence is when the price of an asset is moving in the opposite direction of a technical indicator, such as an oscillator, or is moving contrary to other data. Divergence warns that the current price trend may be weakening, and in some cases may lead to the price changing direction.

Trading Management and PsychologyWhat are the components of trading psychology?
In this blog, we’ll examine the essential components of trading psychology and offer techniques for cultivating a winning attitude. 1. The Role of Emotions in Trading 2. The Psychology of Risk Management 3. Overcoming Cognitive Biases 4. Developing a Trading Mindset 5. Dealing with Trading Losses 6. The Role of Discipline and Patience 7.
