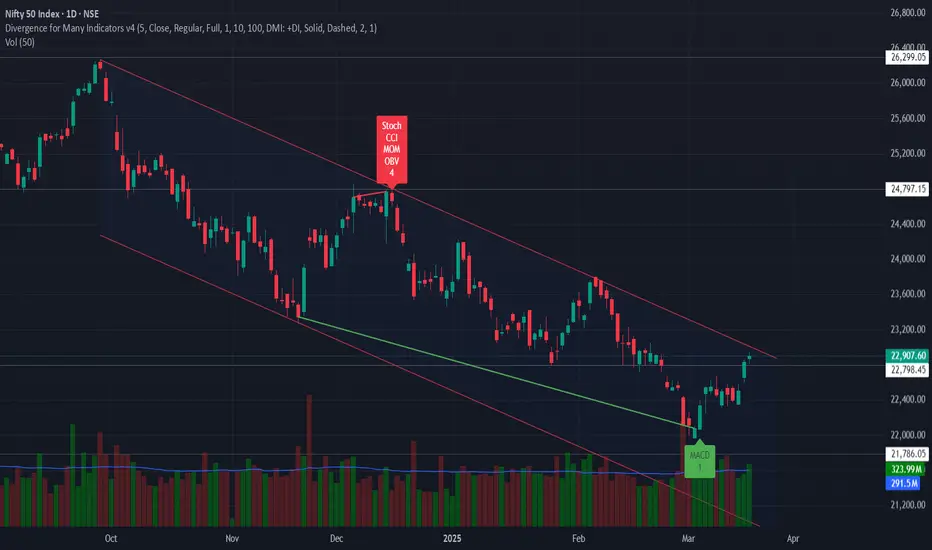
Advanced Technical Analysis #DivergenceDivergence is when the price of an asset is moving in the opposite direction of a technical indicator, such as an oscillator, or is moving contrary to other data. Divergence warns that the current price trend may be weakening, and in some cases may lead to the price changing direction.
Nifty50

Trading Management and PsychologyWhat are the components of trading psychology?
In this blog, we’ll examine the essential components of trading psychology and offer techniques for cultivating a winning attitude. 1. The Role of Emotions in Trading 2. The Psychology of Risk Management 3. Overcoming Cognitive Biases 4. Developing a Trading Mindset 5. Dealing with Trading Losses 6. The Role of Discipline and Patience 7.

Massive Breakout in Nifty index : Is the Next Bull Run Starting?Hello everyone i hope you all will be doing good in your life and your trading as well, Today i have brought anlaysis on Nifty 50 because index is currently showing a strong bullish breakout setup after a long period of consolidation. A key channel breakout has occurred, confirmed by a significant volume spike , signaling the return of strong buying interest. This breakout, coupled with a recent surge in FII inflows , which have pumped in 7,470.36 Cr into the Indian market, points towards a shift in market sentiment and signals a potential rally ahead. On top of that, the government's Open Market Operations (OMO) have provided additional liquidity, further boosting market sentiment and helping support the overall bullish outlook.
And the strong support zone is playing its role as a key demand area, with multiple rejections at this level showing strong buying defense. The market is likely to head toward the 25,000+ mark , backed by a positive fundamental and sentiment boost, along with the government's OMO action , which adds a layer of liquidity and confidence. Keep an eye on this breakout, as it could set the stage for a bullish run in the broader market.
Additional Tip to my all followers:
If you're looking to invest for the long term, buying a Nifty ETF is a great option to get diversified exposure to the top 50 companies in India. It’s a cost-effective way to invest in the broad market, and given the positive outlook for the Nifty 50 index, it has the potential to offer solid returns in the long run.
Additionally, investing in your favorite stocks for the long term can complement your portfolio and further boost returns as these stocks grow over time. Combining Nifty ETFs with quality individual stocks provides a diversified approach while also giving you the opportunity to capitalize on the growth of specific companies that you believe in for the future.
Disclaimer:-This analysis is for educational purposes only. Please trade responsibly and consult a financial advisor before making any decisions.
If you found this analysis helpful, don’t forget to like, follow, and share your thoughts in the comments below! Your support keeps me motivated to share more insights. Let’s grow and learn together—happy investing!

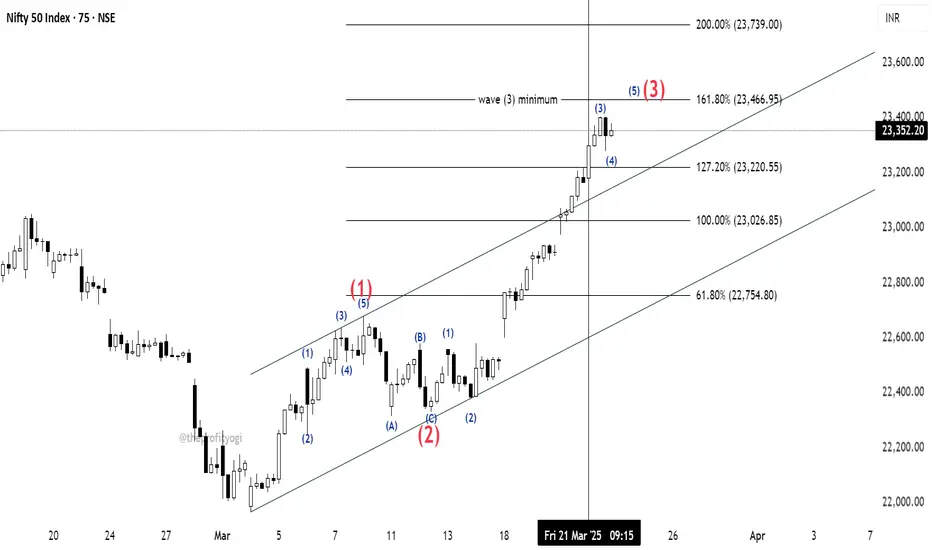
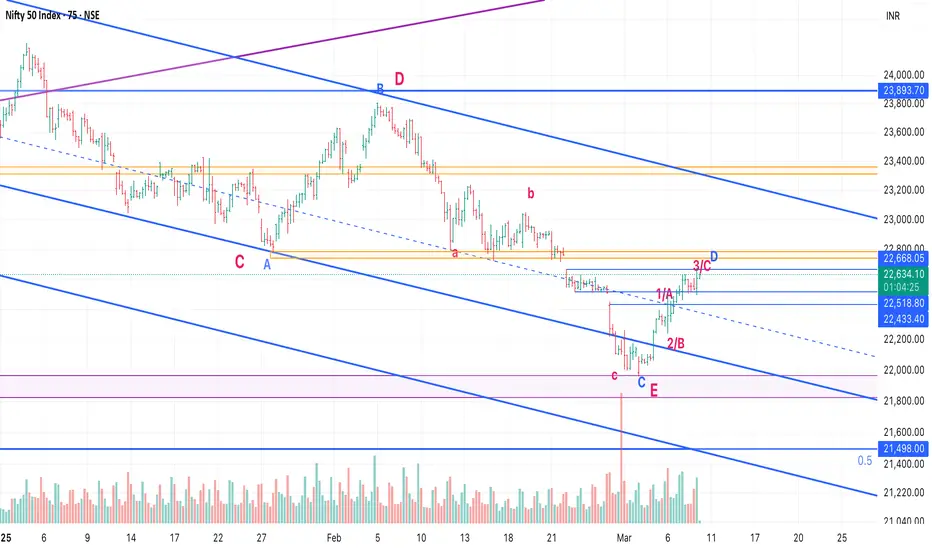
NIFTY detailed countingAs discussed in the last post, NIFTY's price has crossed over 23026.85 before 21st March so we can count the current move as wave (3). We can also see that price has broken the base channel, which is an important sign of wave (3) progression.
The detailed counting is given in the chart.
As we can see, the price is in subordinate wave 3 of the bigger wave (3).
The minimum target of Trending Impulse is 161.8% as per the rule.
We can expect the price to touch that level in the upcoming session.
I have marked, for now, a bigger wave (3) (in red) at 161.8% but as mentioned earlier, it is just the minimum target of it and the price may go beyond this level too.
This analysis is based on Elliott Wave theory and Fibonacci.
This is not any buying recommendation.
This analysis is for educational purposes only.
Nifty Weakly Analysis - 24-03-25 To 28-03-25🇮🇳😇The #Nifty has been on a four-day winning streak as of March 21, reclaiming 23,300 after dipping to oversold levels (RSI 20-22) around early March. This bounce aligns with a buy-on-dips scenario following election-related volatility, with support near 21,900–22,300 holding firm.
📈📉 #chart_sab_kuch_bolta_hai for your reference.

Technical Analysis Advanced candlesticks These advanced candlesticks are associated with strong price moves, and often gaps, which cause sharp shifts in direction. Traders can participate by noticing these patterns and acting quickly to get in as the price moves in the new direction. Candlestick patterns do not have price targets, which means traders shouldn't get greedy.

Nifty50 Dow TheoryDOW THEORY Update-
After New Dow Top "Y", now we have made new Dow Bottom "Z" as well.
* W is the previous significant swing high here.
* X is the current significant swing low here.
* Y is the current significant swing high here.
* Z is the current significant swing low here.

Dead Cat Bounce or Trend Reversal: What's Next for the Nifty?● After a significant decline from its all-time high, Nifty found strong support near the 22,000 level.
● Since then, the index has rebounded and recently breached its trendline resistance, signaling a potential shift in market sentiment. 🚀
📊 Open Interest (OI) Data Analysis:
● The OI data indicates a substantial increase in put open interest at the 23,000 strike price, establishing this level as a key immediate support.
● Conversely, the 23,500 strike price has emerged as a strong resistance zone, with the highest concentration of call OI.
❓ Key Question:
Has the Nifty truly bottomed out, or is there still room for further correction? 🤔
💬 Share your insights and perspectives in the comments below! 👇

Nifty is set to resume its uptrendAfter correcting for more than 5 months and taking support at crucial level of 21800 which was pre election low, Nifty 50 is looking strong and set to resume new leg of uptrend. Nifty 50 is ready to cross falling channel at strong volume and macd crossing macd signal line.
stoploss - 21800
Target - 26300
Nifty50 RSI Breakout in Daily timeframeNifty50 RSI breakout in daily timeframe. Soon, breakout will happen in price chart and head towards 29K mark. Could witness many scrip had breakout in RSI & Price in daily timeframe.
NIFTY: What's next?Nifty is moving as per our previous prediction posted on 5th March.
After making a low of 21964.60, which is the completion of wave Z, the price is moving upwards.
If this move is impulsive, the price must reach 100% level (23026.85) by 21st March.
At this level, there is a cluster of Fib retracement level of 23.6%
Further targets will be 127%, and 161.8% levels.
This analysis is based on Elliott Wave theory and Fibonacci.
This is not any buying recommendation.
For educational purposes only.
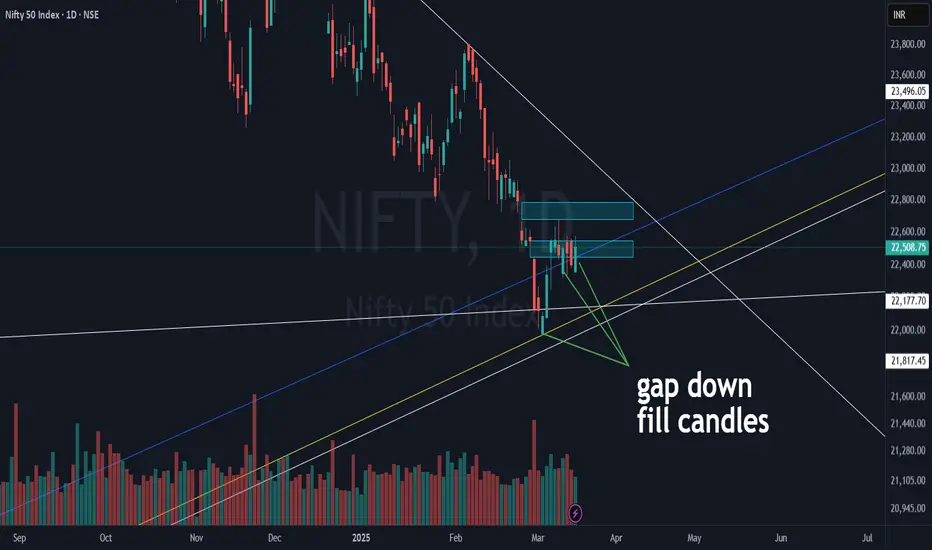
NIFTY 50 | Critical Levels & Gap-Fill Zones in Play!Nifty 50 continues to react strongly to key levels, but the overall structure still remains in correction mode. Let’s break it down:
White Lines (DTF Trendlines) ⚪:
2 key support lines and 1 counter-trendline (CT).
The DTF CT (near-term resistance) is around 500 points away from CMP, making it the next big test for bulls.
Blue & Yellow Trendlines (WTF & MTF Support) 📉:
A cluster of support created a bounce, but not as strong as past recoveries seen in 2023 or early 2024.
Despite FII selloffs & global stress, technical levels are holding up well!
Gap Zones (Blue Boxes) 📦:
The nearest gap got filled, and the next one sits just below our DTF white CT.
This could act as a magnet for price action in the near term.
Gap Down Fill Candles :
A few gaps got filled in a single session, showing bullish pressure at lower levels.
But, without a higher high - higher low structure or a DTF white CT breakout, the index stays in a corrective phase.
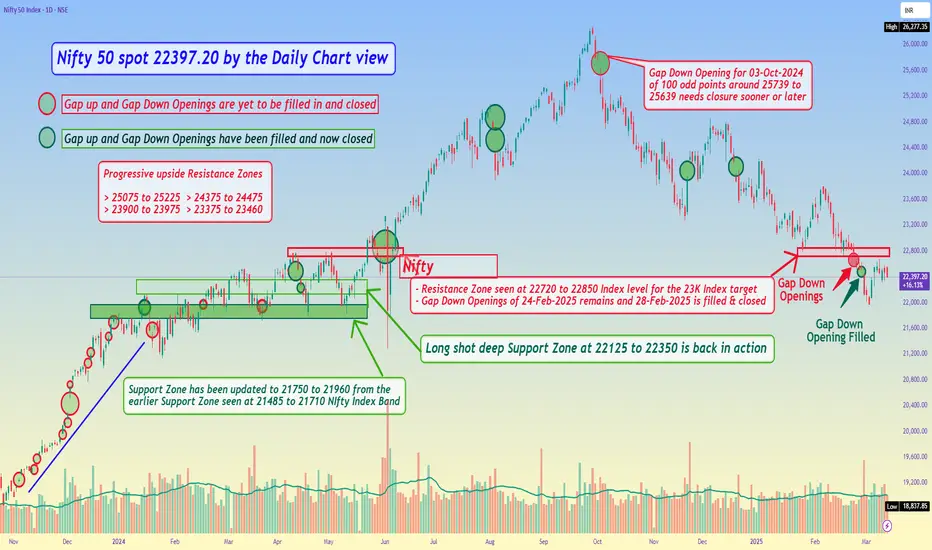
Nifty 50 spot 22397.20 by the Daily Chart view - Weekly updateNifty 50 spot 22397.20 by the Daily Chart view - Weekly update
- Resistance Zone seen at 22720 to 22850 Index level for the 23K Index target
- Gap Down Openings of 24-Feb-2025 remains and 28-Feb-2025 is filled & closed
- Long shot deep inline Support Zone seen at 22125 to 22350 is now back in action
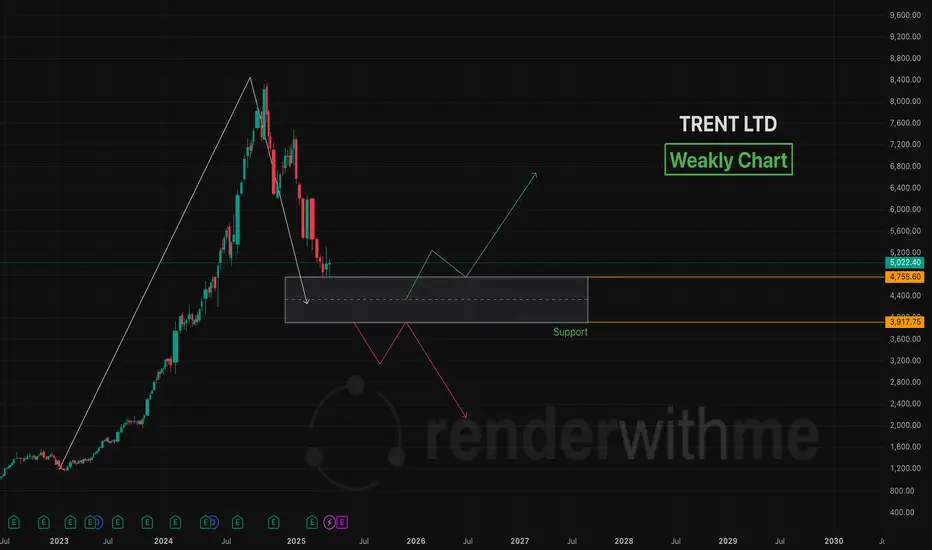
Trent Technical Analysis - Weakly Chart🇮🇳TrentLtd. is an Indian retail company under the Tata Group , operating brands like Westside, Zudio, and Star. Its stock (NSE: TRENT) has been a strong performer in recent years, driven by robust retail expansion and financial growth.
📈📉Chart For your reference
Nifty - EW Update - Time to be lightABC up from recent low seems to be done.
Also, we are in the range from where price had gapped down and broken last time
So, it's time to be cautious. If we make another leg up, then we have 5 up which will be good and we can start taking longs on the next retracement.
However, if we turn from here, we are going lower in E of E to 21500 or so.
Nifty weekly analysis for 10/03/2025.Is this the end of the fall or its just a retracement. The market after a while has given some hope of a green week.
It is a retest or a base formation no body knows. Nifty is trading around 22550 levels and looks somewhat positive for the coming week.
Market is still in the down trend and bullish trend will only be confirmed once a 'W' pattern is formed on higher time frame or a break out is done.
On the hourly charts, market remained in a range for the last trading session, the sideways market can continue as it may form a base and trend reverses from here.
In case the market remains in the trend lower levels of 21800-850 might be coming. Else market may start travelling on the higher side hitting the resistance levels.
Major support levels :- 22310-360, 22050-090
Resistance levls :- 21620, 21760
A gap filling trade on the higher side can be seen in the coming week as a gap is pending.
Watch for the price action and trade accordingly. A sideway or volatile market is more probable as the market has been trading in a trend.

Nifty 50 - Mar 2025 view - Is the correction over?If you have followed my last 2 views of Nifty50, you would be smiling definitely only if you didn't have any swings open.
We have seen a good correction in market since September 2024.
It was much needed in market since 2022 , we have seen an extended move in Indian markets.
I know mid and smallcaps have corrected more than 20% but they were bound for it because of overvaluation. We are in a slowdown phase of economy and earnings of those company wont match expectations.
Coming back to Nifty50, is the correction over?
IAnswe is cant be sure but 1 thing is definite, 21800-22000 will act as strong demand zone as we have seen a quick 600 points jump from 22000.
However, I will suggest to wait for confirmation for any new swings.
What next?
Nifty might be retesting 22800 breakdown. It can fall again towards 21800 and if it breaks 21800 which looks very less probable, 21000-21200 is a very very strong demand zone which should be the last zone for correction.
If Nifty manages to jump from 22000, it will be formation of W pattern(double bottom) which will be a sign of reversal. That's when you can start accumulating.
Expecting March to be sideways to bearish again. We might see a selling due to people booking losses for tax harvesting.
If 21800-22000 holds in March, we can see buying in April which will take it to 23900.
Be patient. Start analyzing stocks for accumulating. Stay healthy and wealthy!
Advanced Option Trading With Professionals The 3 5 7 rule is a risk management strategy in trading that emphasizes limiting risk on each individual trade to 3% of the trading capital, keeping overall exposure to 5% across all trades, and ensuring that winning trades yield at least 7% more profit than losing trades.
Why do 90% option traders lose money?
This is because option traders often find themselves directionless, making it difficult to predict market movements accurately. The complex nature of options, combined with the high volatility, leads to significant losses for most traders. It's time to stop option trading.

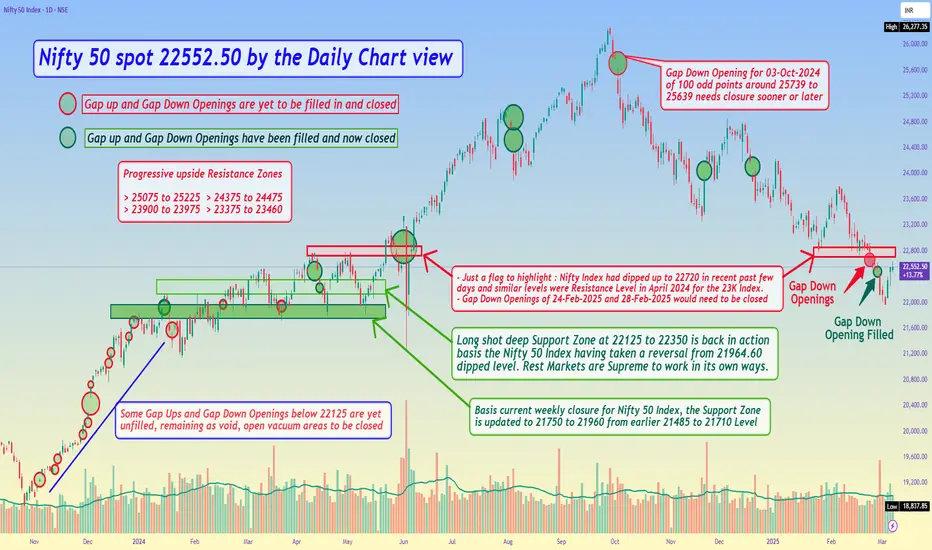
Nifty 50 spot 22552.50 by the Daily Chart view - Weekly Update*Nifty 50 spot 22552.50 by the Daily Chart view - Weekly Update*
- Gap Down Opening of 28th February, 2025 is now filled and has been closed
- Basis current weekly closure for Nifty 50 Index, the Support Zone is updated to 21750 to 21960 from earlier 21485 to 21710 Level
- Long shot deep Support Zone at 22125 to 22350 is back in action basis the Nifty 50 Index having taken a reversal from 21964.60 dipped level.
- Rest Markets are Supreme and work in their own ways. We can at most anticipate, expect and look forward for the best to happen by our assumptions
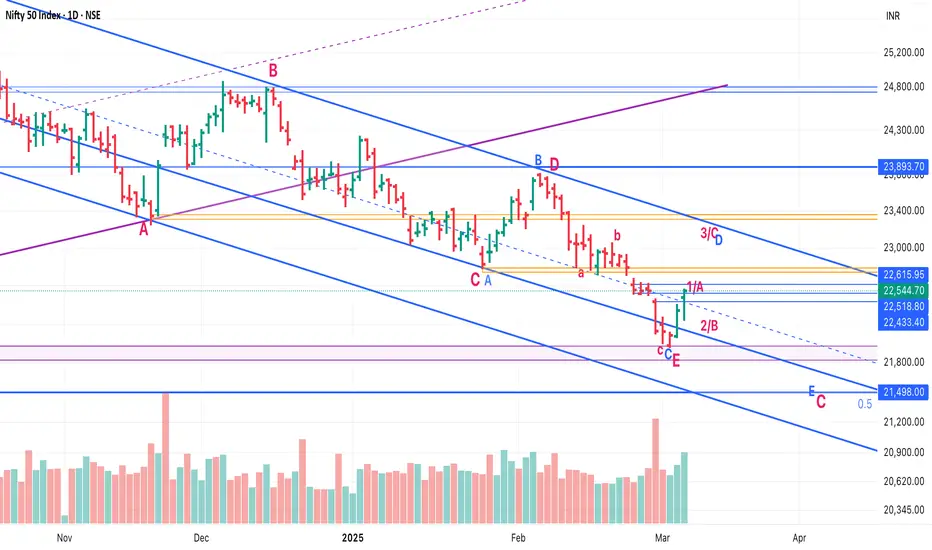
Nifty EW UpdateSo we had a good 2 days of upside.
I am changing the possibilities a bit:
1. Possibility 1 (Red): We are in larger Triangle (ABCDE - Red) E done and we have made a bottom. Wave 1 of next leg up seems done, we should expect a 2 now.
2. Possibility 2 (Blue): We are in a Larger ABC (Red) and C is further an ED (ABCDE - Blue).
In that case the leg up of last 2 days was an A.
We should expect a B down (22200-250) and C up (22800, 23050) which will complete D.
Post that, we will have a E of Red C down, mostly till 21500, 21200.
Still hoping red one holds, but no one knows. :)
ONGC I OIL Burning Bright : Inverted H&S Pattern!!Hello Traders,
- ONGC is trading at a place called AOI (Area of Interest) A place from where price usually reverses.
- 218 levels is acting as a strong support pushing prices higher after a intraday low of about 3% making a big pin bar candle on 1D chart
- Inverted head and shoulder on 15m timeframe.
PRO TIP/-
The Entry Line is the Neckline of the inverted Head and shoulder.
Target 1:- 228
Target 2 :-231
Entry Criteria
Strong Close above Entry Line (225) 15mins TF
Stoploss
Entry Candle Low (not more than 0.8%)
Not an Investment Advise

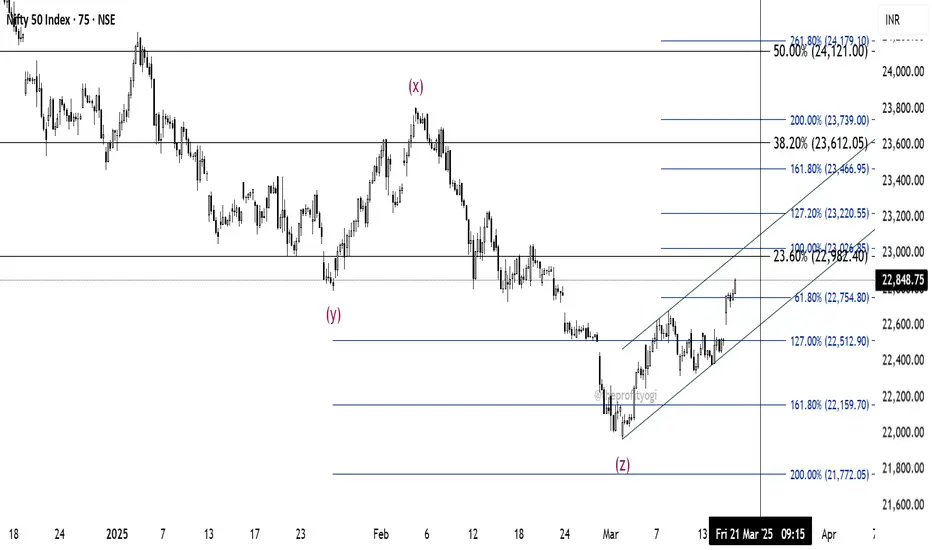
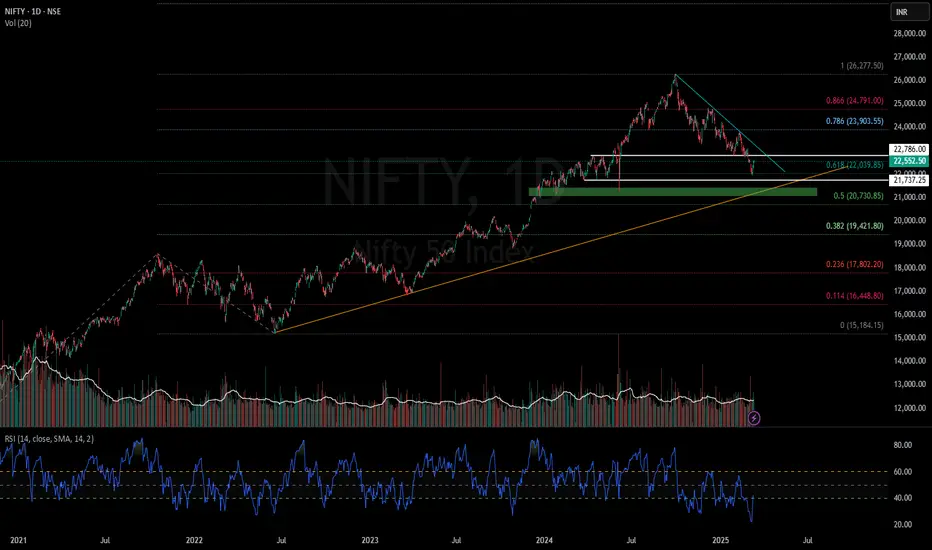
Is it a reversal in NIFTY?If we observe the daily chart of NIFTY, a pattern like Morning Star can be seen near the 161.8% retracement level. Also, as per our previous study, the recent fall was wave (Z).
The minimum target for it is 38.2% extension (which is a failure wave (Z) because most of the time, it is seen that wave (Z) is a failure or truncated).
So, we can have a risky buying opportunity here with a small stop-loss below the recent low. Or, if one wants to play safe, he may have his stop bellow 61.8% (21662) level.
The near target will be the bottom of wave (Y), i.e., 22786.90
This analysis is based on the Elliott wave theory and Fibonacci.
This is not any buying recommendations.
This analysis is for educational purposes only.

Nifty EW UpdateConfusion remains:
Either bottom done in an ABC in E
OR it's just 3rd wave in C3 done and 4th going on.
Crossing 22800 should give confidence that it's not C3, and we could have made a bottom.
All in all, stocks are doing well, Metals, PSEs, Capital goods etc are already breaking above the levels they were at when Nifty was at 23k.
