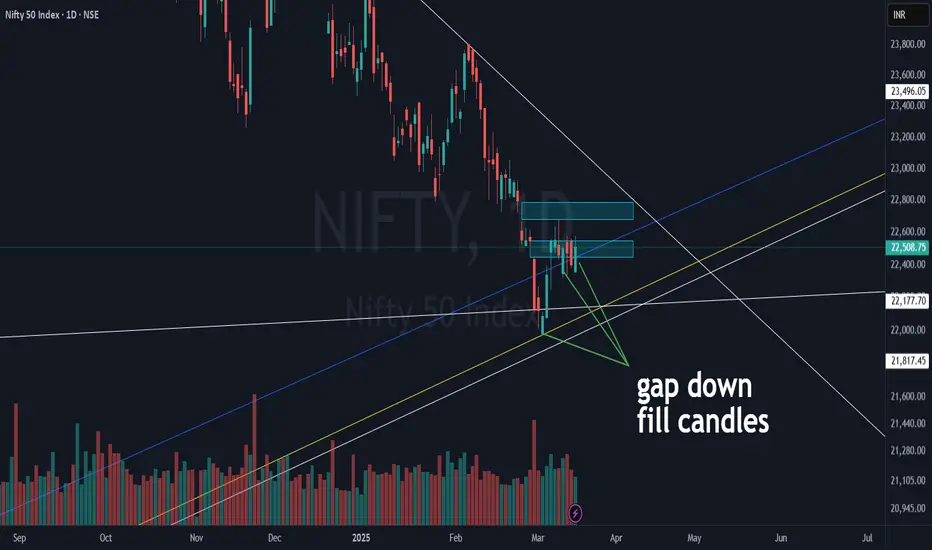
NIFTY 50 | Critical Levels & Gap-Fill Zones in Play!Nifty 50 continues to react strongly to key levels, but the overall structure still remains in correction mode. Let’s break it down:
White Lines (DTF Trendlines) ⚪:
2 key support lines and 1 counter-trendline (CT).
The DTF CT (near-term resistance) is around 500 points away from CMP, making it the next big test for bulls.
Blue & Yellow Trendlines (WTF & MTF Support) 📉:
A cluster of support created a bounce, but not as strong as past recoveries seen in 2023 or early 2024.
Despite FII selloffs & global stress, technical levels are holding up well!
Gap Zones (Blue Boxes) 📦:
The nearest gap got filled, and the next one sits just below our DTF white CT.
This could act as a magnet for price action in the near term.
Gap Down Fill Candles :
A few gaps got filled in a single session, showing bullish pressure at lower levels.
But, without a higher high - higher low structure or a DTF white CT breakout, the index stays in a corrective phase.
Nifty50
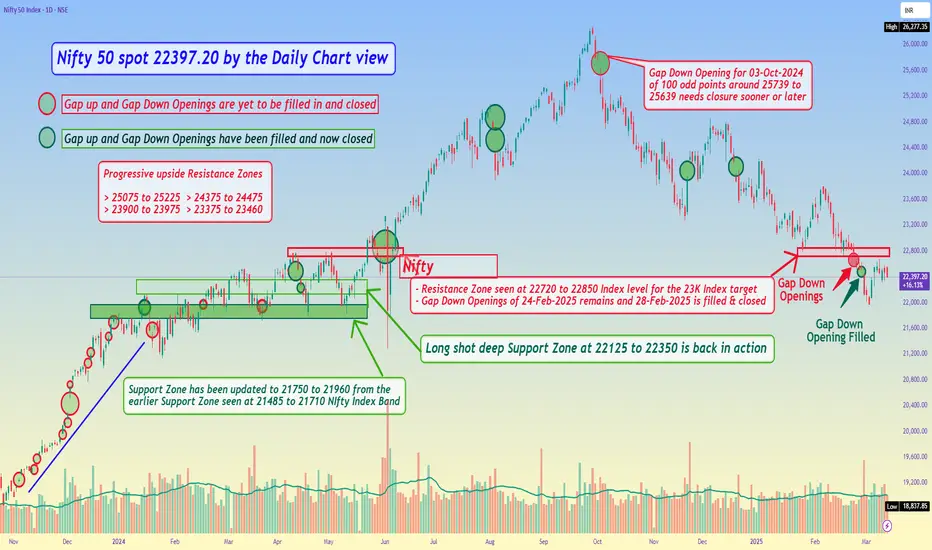
Nifty 50 spot 22397.20 by the Daily Chart view - Weekly updateNifty 50 spot 22397.20 by the Daily Chart view - Weekly update
- Resistance Zone seen at 22720 to 22850 Index level for the 23K Index target
- Gap Down Openings of 24-Feb-2025 remains and 28-Feb-2025 is filled & closed
- Long shot deep inline Support Zone seen at 22125 to 22350 is now back in action
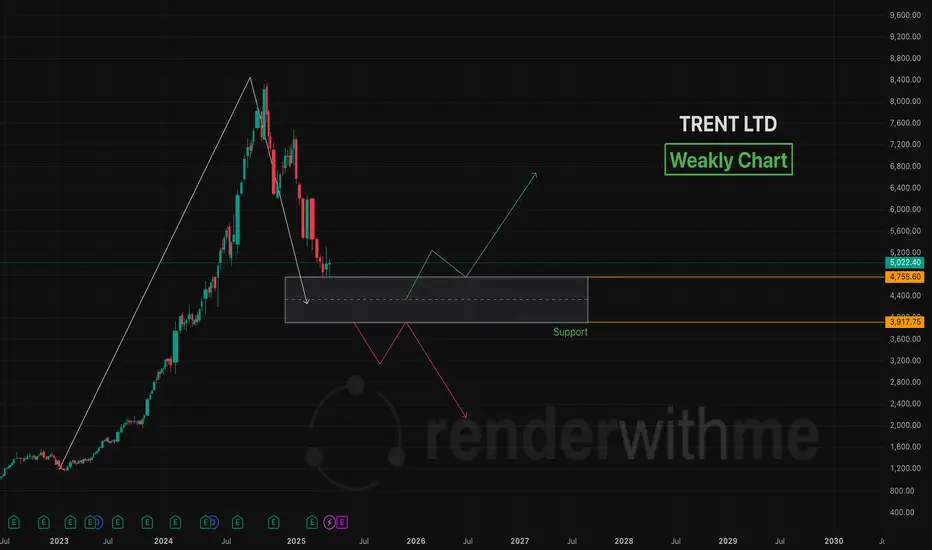
Trent Technical Analysis - Weakly Chart🇮🇳TrentLtd. is an Indian retail company under the Tata Group , operating brands like Westside, Zudio, and Star. Its stock (NSE: TRENT) has been a strong performer in recent years, driven by robust retail expansion and financial growth.
📈📉Chart For your reference
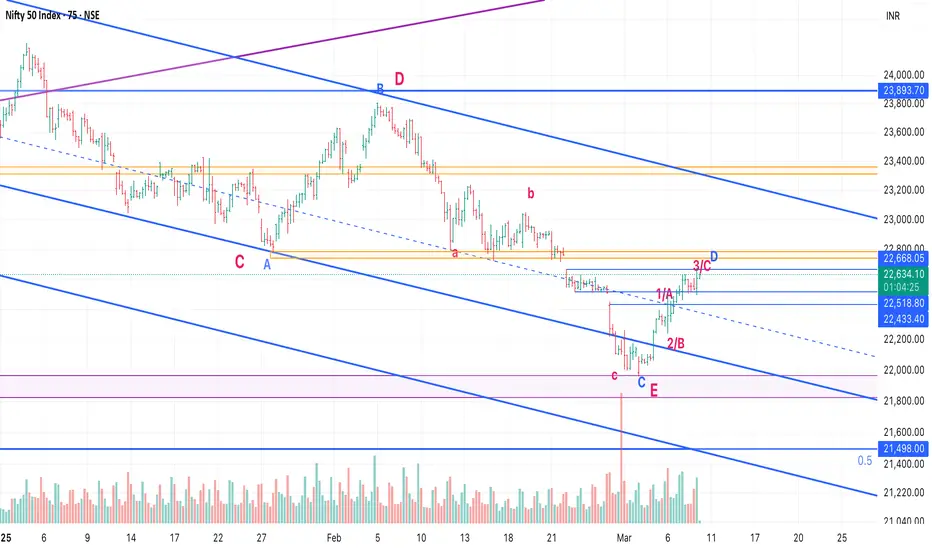
Nifty - EW Update - Time to be lightABC up from recent low seems to be done.
Also, we are in the range from where price had gapped down and broken last time
So, it's time to be cautious. If we make another leg up, then we have 5 up which will be good and we can start taking longs on the next retracement.
However, if we turn from here, we are going lower in E of E to 21500 or so.
Nifty weekly analysis for 10/03/2025.Is this the end of the fall or its just a retracement. The market after a while has given some hope of a green week.
It is a retest or a base formation no body knows. Nifty is trading around 22550 levels and looks somewhat positive for the coming week.
Market is still in the down trend and bullish trend will only be confirmed once a 'W' pattern is formed on higher time frame or a break out is done.
On the hourly charts, market remained in a range for the last trading session, the sideways market can continue as it may form a base and trend reverses from here.
In case the market remains in the trend lower levels of 21800-850 might be coming. Else market may start travelling on the higher side hitting the resistance levels.
Major support levels :- 22310-360, 22050-090
Resistance levls :- 21620, 21760
A gap filling trade on the higher side can be seen in the coming week as a gap is pending.
Watch for the price action and trade accordingly. A sideway or volatile market is more probable as the market has been trading in a trend.

Nifty 50 - Mar 2025 view - Is the correction over?If you have followed my last 2 views of Nifty50, you would be smiling definitely only if you didn't have any swings open.
We have seen a good correction in market since September 2024.
It was much needed in market since 2022 , we have seen an extended move in Indian markets.
I know mid and smallcaps have corrected more than 20% but they were bound for it because of overvaluation. We are in a slowdown phase of economy and earnings of those company wont match expectations.
Coming back to Nifty50, is the correction over?
IAnswe is cant be sure but 1 thing is definite, 21800-22000 will act as strong demand zone as we have seen a quick 600 points jump from 22000.
However, I will suggest to wait for confirmation for any new swings.
What next?
Nifty might be retesting 22800 breakdown. It can fall again towards 21800 and if it breaks 21800 which looks very less probable, 21000-21200 is a very very strong demand zone which should be the last zone for correction.
If Nifty manages to jump from 22000, it will be formation of W pattern(double bottom) which will be a sign of reversal. That's when you can start accumulating.
Expecting March to be sideways to bearish again. We might see a selling due to people booking losses for tax harvesting.
If 21800-22000 holds in March, we can see buying in April which will take it to 23900.
Be patient. Start analyzing stocks for accumulating. Stay healthy and wealthy!
Advanced Option Trading With Professionals The 3 5 7 rule is a risk management strategy in trading that emphasizes limiting risk on each individual trade to 3% of the trading capital, keeping overall exposure to 5% across all trades, and ensuring that winning trades yield at least 7% more profit than losing trades.
Why do 90% option traders lose money?
This is because option traders often find themselves directionless, making it difficult to predict market movements accurately. The complex nature of options, combined with the high volatility, leads to significant losses for most traders. It's time to stop option trading.

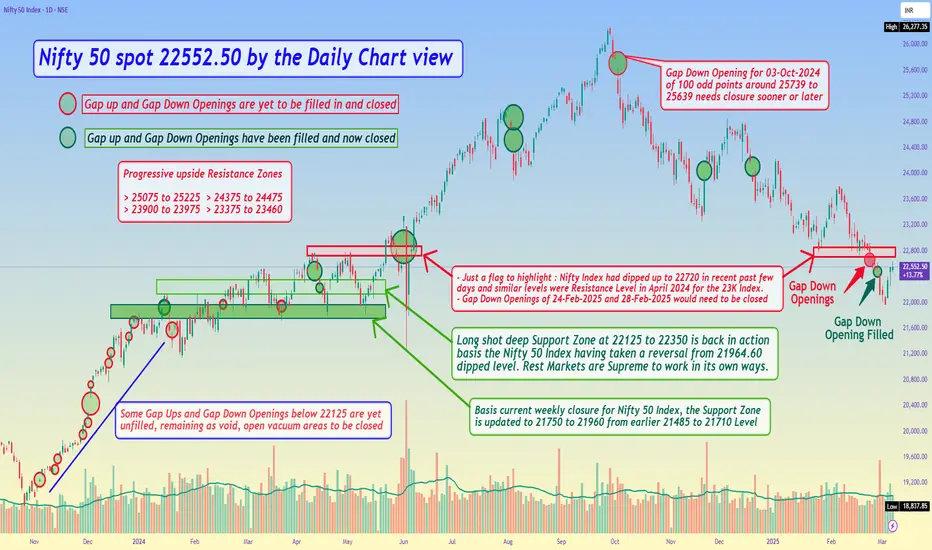
Nifty 50 spot 22552.50 by the Daily Chart view - Weekly Update*Nifty 50 spot 22552.50 by the Daily Chart view - Weekly Update*
- Gap Down Opening of 28th February, 2025 is now filled and has been closed
- Basis current weekly closure for Nifty 50 Index, the Support Zone is updated to 21750 to 21960 from earlier 21485 to 21710 Level
- Long shot deep Support Zone at 22125 to 22350 is back in action basis the Nifty 50 Index having taken a reversal from 21964.60 dipped level.
- Rest Markets are Supreme and work in their own ways. We can at most anticipate, expect and look forward for the best to happen by our assumptions
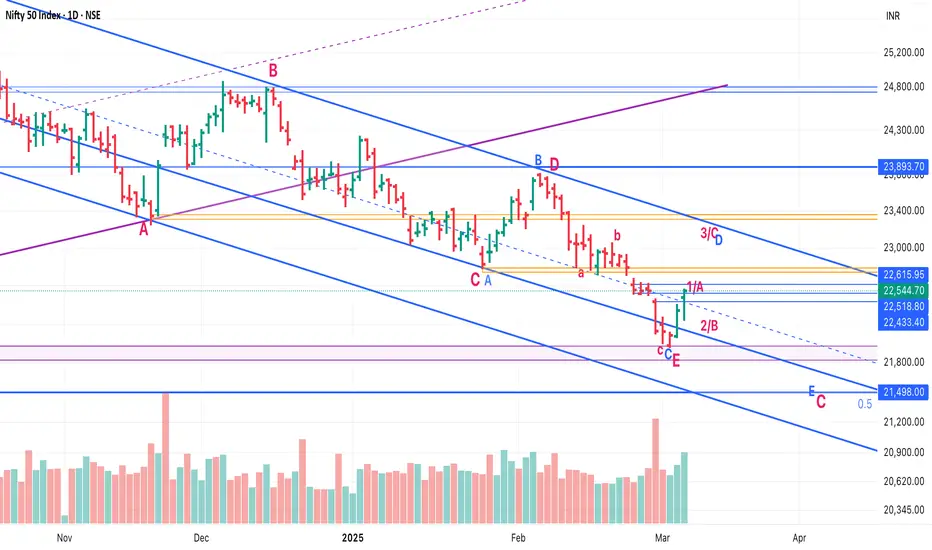
Nifty EW UpdateSo we had a good 2 days of upside.
I am changing the possibilities a bit:
1. Possibility 1 (Red): We are in larger Triangle (ABCDE - Red) E done and we have made a bottom. Wave 1 of next leg up seems done, we should expect a 2 now.
2. Possibility 2 (Blue): We are in a Larger ABC (Red) and C is further an ED (ABCDE - Blue).
In that case the leg up of last 2 days was an A.
We should expect a B down (22200-250) and C up (22800, 23050) which will complete D.
Post that, we will have a E of Red C down, mostly till 21500, 21200.
Still hoping red one holds, but no one knows. :)
ONGC I OIL Burning Bright : Inverted H&S Pattern!!Hello Traders,
- ONGC is trading at a place called AOI (Area of Interest) A place from where price usually reverses.
- 218 levels is acting as a strong support pushing prices higher after a intraday low of about 3% making a big pin bar candle on 1D chart
- Inverted head and shoulder on 15m timeframe.
PRO TIP/-
The Entry Line is the Neckline of the inverted Head and shoulder.
Target 1:- 228
Target 2 :-231
Entry Criteria
Strong Close above Entry Line (225) 15mins TF
Stoploss
Entry Candle Low (not more than 0.8%)
Not an Investment Advise

Is it a reversal in NIFTY?If we observe the daily chart of NIFTY, a pattern like Morning Star can be seen near the 161.8% retracement level. Also, as per our previous study, the recent fall was wave (Z).
The minimum target for it is 38.2% extension (which is a failure wave (Z) because most of the time, it is seen that wave (Z) is a failure or truncated).
So, we can have a risky buying opportunity here with a small stop-loss below the recent low. Or, if one wants to play safe, he may have his stop bellow 61.8% (21662) level.
The near target will be the bottom of wave (Y), i.e., 22786.90
This analysis is based on the Elliott wave theory and Fibonacci.
This is not any buying recommendations.
This analysis is for educational purposes only.

Nifty EW UpdateConfusion remains:
Either bottom done in an ABC in E
OR it's just 3rd wave in C3 done and 4th going on.
Crossing 22800 should give confidence that it's not C3, and we could have made a bottom.
All in all, stocks are doing well, Metals, PSEs, Capital goods etc are already breaking above the levels they were at when Nifty was at 23k.

Nifty - Elliot Waves UpdateWe are in a confusing situation right now.
Possibility 1 (in red): We are in an ED and E of ED got done in ABC
Possibility 2 (in blue): Larger C is going on and only 3 of C3 is done - We can head till 20500 (even lower) in this case.
In both cases we are either at bottom or within 5% of it. However, upside is big - at least 23500.
One good thing is that we recovered after a gap down in last 2 days, especially when US markets fell quite sharply yesterday.
Wait and watch time for traders. Deploy cash time for investors :)

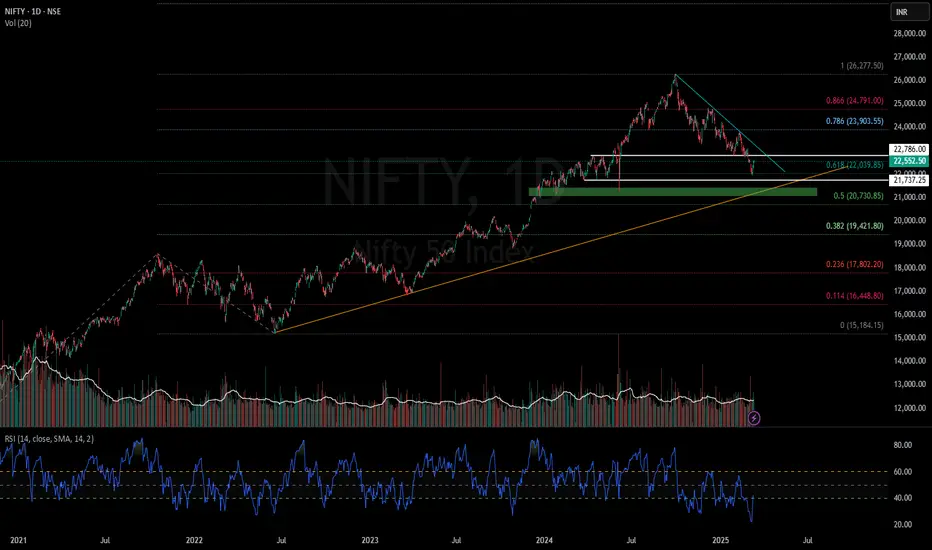
Nifty at a 1000-Day Trendline Support - Finally we are here !!Nifty is currently testing a confluence of two long-term trendlines – one from the monthly timeframe (blue line) and another from the weekly timeframe (yellow line). This 1000-day trendline cluster is a major reactive support zone, making this a make-or-break level for the index.
🔍 Key Observations:
✔️ The blue trendline represents a long-term uptrend, making it a crucial level for institutional traders.
✔️ The yellow trendline, which has also acted as a dynamic support, adds strength to this zone.
✔️ A breakdown below this cluster could open doors for further downside
✔️ However, if Nifty holds this level, a strong rebound can be expected, potentially continuing its long-term bullish structure.
🚀 What’s Next?
A weekly close below this zone could accelerate selling pressure.
If buying emerges, this could be a great risk-reward trade for swing and positional traders.
Price action confirmation is key before making any major trading decisions!
🔥 Will this historical support hold, or is a deeper correction coming? Drop your thoughts in the comments! 👇

Nifty 50: Mission Dive 2… Are We Gearing Up for Another Dive? Attention, traders! The Nifty 50 Air Force successfully completed its deep dive operation, hitting all marked coordinates—23,056, 22,208, and even making an exact low of 22,004.70, just kissing 22,003 like a pilot executing a perfect touch-and-go landing! 🎯
But before the ground crew could celebrate, Nifty pulled up and is now hovering at 22,121. So, what’s next? Is this a refuelling stop, or are we just gaining altitude for another nosedive? 🛫
The Battle Plan:
Nifty now faces enemy resistance at 22,413-22,455-22,670—a tough air defence zone. If it fails to break through, the flight path might take it towards deep bear territory at 21,287, 20,712, and, if things get really bumpy, 20,415. 🐻💥
🚨 Extreme Crucial Support Alert!
Before hitting full panic mode, one crucial airbase at 21,287 could provide emergency support. If this level holds strong, we might witness a solid counterattack from the bulls, leading to a potential rebound. However, if the support collapses, it’s a freefall toward 20,712 & 20,415—the deep war zones! 🚨📉
Trader’s Mission Briefing:
If Nifty breaches 22,670, it might try to regain lost altitude. 🚀
If it gets shot down at resistance, the descent mission resumes with 21,287 as the first landing strip. 🛬
Below 21,287, expect a sharp descent towards 20,712 and 20,415—time to brace for impact! 💣
Commanders, keep your trading parachutes (stop-losses) secured and eyes on the radar. The bears are still controlling the airspace, but 21,287 could be the last stronghold before bulls take a stand. This mission isn’t over yet! 🎖️
Over and out! 🛫⚡

Nifty Down 16% from Highs: Eyes on Next Support at 21,800● Nifty 50 has declined by approximately 16% from its all-time high, signalling a significant correction in the market.
● The next crucial support level is anticipated around the 21,800 mark, a level where the index has historically found support on five previous occasions.
◉ OI Data Analysis
● The 22,500 strike price has the highest concentration of call writers, establishing it as a strong immediate resistance level.
● Conversely, the 22,000 strike price shows the highest accumulation of put writers, indicating robust support at this level.
◉ Valuation Analysis
● From a valuation standpoint, the Nifty appears attractive, currently trading at a Price-to-Earnings (PE) ratio of 19.7.
● This is notably below its 5-year average PE of 24.8, suggesting the index may be undervalued relative to its historical standards.

RB Infrastructure Developers Ltd - Technical #irbinfra IRB Infrastructure Developers Ltd. is a major 🇮🇳Indian company focused on infrastructure development, particularly in the roads and highways sector. Established on July 27, 1998, and headquartered in Maharashtra, India,
📈📉Chart for your reference

Mahindra & mahindraM&M itself focuses primarily on mobility products and farm solutions. It’s a titan in India’s automotive sector, renowned for rugged SUVs like the Scorpio, Thar, and XUV700, and holds a dominant position in utility vehicles with an 11.4% market share, competing with Tata Motors, Hyundai, Kia, and Maruti Suzuki.
Chart for your reference

Nifty 50 spot 22124.70 by the Daily Chart viewJust sharing an update in continuation over the last week Nifty 50 Index chart data reading.
Nifty 50 spot 22124.70 by the Daily Chart view
- Next Support Zone at 21485 to 21710 Level
- Gap Down Openings of 24-Feb-2025 and 28-Feb-2025 would need to be closed

Downward Channel on NIFTY501. Downward channel on NIFTY50 weekly chart may lead to 21400-21500 range in short term.
2. Pivot S1 indicate 21100 levels
3. The gap-up on 4th Dec 2023 corresponds to support levels but that is too far to discuss now, though we will keep track on it.
4. Trend line from lower fractal lows, 3rd June 2024 (Lok sabha election result day) low is breached on week starting 13th Jan 2025.

Nifty 50 - Elliot Wave UpdateHere are the scenarios (ignore technical details (as I can post only one chart per post)
Possibility 1: ED in E of E - 22400 should be low
Possibility 2: C started in E - Can go till 22000 - 22250
Possibility 3: C1, C2 done C3 going on - This will be bad. - 21600 possible
Tomorrow (Friday, Feb 28) is a crucial day for us to get the answer.
Tracking Nifty 500 (currently at 20315) will give a better picture.
Why? Because it was holding above the previous low, while Nifty had broken. This was giving the confidence that Nifty is divergent and forming a bottom, and we should head up after Feb expiry.
So, here’s what we need to track in Nifty 500 (today’s close: 20315)
If we turn before 20130 - We'll go up till 22300-500
If we break 20130, then we'll first go down to 19300-500, and then recover to 21500-700
Best would be today’s closing becomes the bottom, and we have a +1% green day tomorrow - breaking 20550 tomorrow is important (20 month moving average).
Let's see what the market has in store!

Candlesticks PattensCandlesticks Pattens - Part -1
*SkyTradingZone* is your go-to source for educational content on trading, covering market insights, strategies, and in-depth analysis. Our goal is to empower traders with knowledge to navigate the markets effectively.
---
# *Candlestick Patterns: The Key to Understanding Market Psychology*
Candlestick charts are one of the most *powerful tools in trading, providing valuable insights into **market sentiment, reversals, and continuation patterns. They help traders make informed decisions by visualizing **price action* in a structured way.
---
## * Understanding Candlestick Basics*
A candlestick represents *price movement within a specific time frame* (e.g., 1 minute, 5 minutes, 1 hour, 1 day). Each candle contains *four key price points*:
📌 *Open* – The price at which the candle starts.
📌 *High* – The highest price reached during the time frame.
📌 *Low* – The lowest price reached during the time frame.
📌 *Close* – The price at which the candle ends.
### *Candlestick Structure:*
A *bullish (green)* candle forms when the closing price is higher than the opening price.
A *bearish (red)* candle forms when the closing price is lower than the opening price.
🕯 *Wicks (Shadows):* The thin lines above and below the candle body indicate the highest and lowest prices reached during that period.
---
## * Types of Candlestick Patterns*
### *📍 Single Candlestick Patterns*
These patterns consist of a *single candle* and indicate potential reversals or continuations.
✅ *Hammer (Bullish Reversal)*
- A small body with a long lower wick.
- Appears after a downtrend.
- Signals strong *buying pressure*.
✅ *Shooting Star (Bearish Reversal)*
- A small body with a long upper wick.
- Appears after an uptrend.
- Indicates *selling pressure* from institutions.
✅ *Doji (Indecision Candle)*
- Open and close prices are almost the same.
- Indicates *market indecision* and possible reversal.
✅ *Marubozu (Strong Trend Candle)*
- No wicks, just a full body.
- *Bullish Marubozu* → Strong buying pressure.
- *Bearish Marubozu* → Strong selling pressure.
---
### *📍 Double Candlestick Patterns*
These patterns involve *two candles* and suggest trend continuation or reversal.
✅ *Bullish Engulfing (Strong Uptrend Signal)*
- A small *red* candle followed by a large *green* candle.
- The green candle *completely engulfs* the red one.
- Indicates *buying pressure* and a potential reversal.
✅ *Bearish Engulfing (Strong Downtrend Signal)*
- A small *green* candle followed by a large *red* candle.
- The red candle *engulfs the previous green one*.
- Signals *strong selling pressure*.
✅ *Tweezer Bottom (Bullish Reversal)*
- Two candles with the *same low price*.
- Suggests *strong support* and buying interest.
✅ *Tweezer Top (Bearish Reversal)*
- Two candles with the *same high price*.
- Indicates *resistance* and selling pressure.
---
### *📍 Multi-Candlestick Patterns*
These patterns involve *three or more candles* and provide strong trade signals.
✅ *Morning Star (Bullish Reversal)*
- A *red candle, followed by a **small indecisive candle, and then a **big green candle*.
- Shows *trend reversal from bearish to bullish*.
✅ *Evening Star (Bearish Reversal)*
- A *green candle, followed by a **small indecisive candle, and then a **big red candle*.
- Indicates a *trend reversal from bullish to bearish*.
✅ *Three White Soldiers (Bullish Continuation)*
- Three *consecutive green candles* with higher closes.
- Indicates *strong buying momentum*.
✅ *Three Black Crows (Bearish Continuation)*
- Three *consecutive red candles* with lower closes.
- Signals *strong selling pressure*.
---
## * How to Use Candlestick Patterns in Trading?*
Candlestick patterns alone *are not enough; you must **combine them with other factors* for high-probability trades.
### *🔹 Combine with Support & Resistance*
- A *bullish engulfing at support* is a strong *buy signal*.
- A *shooting star at resistance* is a strong *sell signal*.
### *🔹 Use Volume Confirmation*
- *High volume* with a reversal pattern increases its reliability.
- *Low volume* means the pattern might fail.
### *🔹 Look for Confluence with Indicators*
- *RSI Oversold + Hammer Candle = Strong Buy Signal*.
- *Bearish Engulfing + MACD Crossover = Strong Sell Signal*.
### *🔹 Trade with Trend for Best Results*
- *Bullish patterns work best in an uptrend*.
- *Bearish patterns work best in a downtrend*.
---
## * Common Mistakes Traders Make with Candlestick Patterns*
🚫 *Trading Without Confirmation* – Always wait for the next candle or volume confirmation before entering.
🚫 *Ignoring Market Context* – A single pattern doesn’t guarantee a trend reversal; check the overall trend.
🚫 *Forcing Trades* – Don’t take a trade just because you see a candlestick pattern; wait for confluence with other signals.
---
## * Best Candlestick Strategies for Profitable Trading*
### *📌 Strategy 1: Engulfing Pattern + Support/Resistance*
🔹 Identify a *strong support or resistance level*.
🔹 Wait for a *bullish engulfing pattern at support* or a *bearish engulfing at resistance*.
🔹 Enter a trade with *stop-loss below support (for buy)* or *above resistance (for sell)*.
### *📌 Strategy 2: Hammer Candle + RSI Oversold*
🔹 Find a *hammer candle near a key support zone*.
🔹 Check if *RSI is below 30 (oversold zone)*.
🔹 Enter a *buy trade* when the next candle confirms the reversal.
### *📌 Strategy 3: Marubozu Breakout*
🔹 Find a *marubozu candle breaking a key level*.
🔹 Enter in the *direction of the breakout* after confirmation.
🔹 Place a *stop-loss below the breakout candle*.
---
# *Final Thoughts – Mastering Candlestick Patterns for Profitable Trading*
Candlestick patterns are an *essential tool for traders* to analyze price action effectively. However, *using them in combination with volume, support & resistance, and technical indicators will increase accuracy*.
📌 *Key Takeaways:*
✔ *Master single, double, and multi-candlestick patterns.*
✔ *Use them with support, resistance, and trendlines for best results.*
✔ *Avoid common mistakes like overtrading or ignoring confirmation.*
✔ *Follow price action and volume to validate trade setups.*
By understanding *candlestick psychology, traders can **predict market movements and improve profitability*.
---
🔹 *Disclaimer: This content is for educational purposes only. *SkyTradingZone is not SEBI registered and does not provide financial or investment advice. Please conduct your own research before making any trading decisions.

"JSW Infra: Climbing the Crane of Success!""JSW Infra: Sailing Toward the Fibonacci 0.618 Dock! 🚢📈"
This means the stock is likely retracing to the golden ratio (61.8%) level, a key Fibonacci retracement point often seen as strong support or resistance in technical analysis.
🚨 Disclaimer: Not Financial Advice! 🚨
** This is for educational purposes only! 📚😂 Do your own research, consult a professional, and remember—stocks can go up, down, or sideways faster than your morning coffee spills! ☕📉📈 Invest responsibly! 🚀💸 **
