Waaree Energies #Wararee Energies has moved down.
Now wave 5 looks complete or 1 leg. In both cases price to move to 2275- 2250 Zone next atleast in coming days.
2030 would be our protective stop loss.
Keep eye on RSI divergence.
RSI should not go down for more upmove.
Nifty50

Nifty laying traps... another one for sellers...Hello Traders!
The market is constantly trapping sellers without moving to the downside. Right now, nothing in draw on liquidity is obvious. It, frankly, can go either ways . And what does it mean when we can frame both sides of market using ICT concepts? It means that we have LOW PROBABILITY conditions . I'm sitting on the sidelines until the market gains clarity, favouring buyside delivery.
As long as the invalidation low of 22725 holds, my bias would remain bullish . Once that low is taken, I'm not interested in price and would wait for the market to provide more info.
When it looks that it can go either ways, the market structure gets filthy and PRECISION leaves the chat. WAIT FOR MORE CLARITY . Or gamble . It's absolutely your choice .
Have a safe trading day.
GLGT.

CDSL - Technical Chart🇮🇳❣️#cdsl is one of India's premier securities depositories, established in 1999. It plays a crucial role in the Indian capital market by providing electronic storage, transfer, and servicing of securities.
Technical #CHART for your reference.📉💘❣️

Nifty ready to move higher...Hello traders!
The market delivered exactly as we had expected for yesterday's trading. I've mentioned in the video idea what is to be expected for today's trading.
Not financial advice.
GLGT.

Shree Digvijay Cement - TechnicalEstablished in 1944, Shree Digvijay Cement is one of the pioneers in the Indian cement industry, starting production in 1949 under the trade name "Lotus". It has since transitioned through various partnerships and ownership structures.

Angel One - Technical - WeeklyAs of recent data, Angel One shares are trading at various prices across different sources, with the latest share price around ₹2,211 to ₹2,650 on the NSE, reflecting some fluctuation.
Hear is a chart overview for your reference.

Nifty WXYXZ Formation Nifty is forming WXYXZ correction.
Watch price closely. It is kind of falling wedge formation. Generally Price reverses sharply after wedge breakout.
Keep Watching, Keep Learning. Share feedback.

Sit STILL today! Let the GAMBLERS sacrifice themselves to LUCK.Hello traders!
Hope you find this video analysis helpful.
Not financial advice.
GLGT.

Nifty 50 Index spot 22929.25 by Monthly Chart viewNifty 50 Index spot 22929.25 by Monthly Chart view
- Nifty 50 Index trending along the Rising Support Trendline 4th time over since March 2020.
- Support point starting March 2020, next in March 2023 followed in Nov 2023 and now in Feb 2025.
- *What can we anticipate and can we hope for some upside reversal from here ????*

Nifty’s Eight-Day Slump: Is a Reversal Brewing at 22,800?● Last week proved to be a challenging period for the Nifty, as the index experienced a sharp decline of over 2.5%, extending its losing streak to eight consecutive trading sessions.
● A key support level to watch is at 22,800, which could act as a crucial floor for the index.
● This level gains further significance as Open Interest (OI) data reveals a substantial buildup of put writers at the 22,800 strike price, reinforcing the potential support zone.
● Market participants will closely monitor whether the index manages to hold above this level or breaches it in the coming sessions.
● Adding to the intrigue, a bullish RSI divergence has emerged, hinting at the possibility of a trend reversal in the near term.

Crisil Ltd.CRISIL Ltd. (NSE: CRISIL) is currently exhibiting a **Neutral** technical outlook, as indicated by various technical analysis indicators.
**Technical Indicators:**
- **Relative Strength Index (RSI):** The 14-day RSI stands at 38.43, suggesting a neutral market sentiment. citeturn0search3
- **Moving Averages:** The stock is trading below its 5-day, 10-day, 20-day, and 50-day simple and exponential moving averages, indicating a bearish trend. citeturn0search3
- **MACD (Moving Average Convergence Divergence):** The MACD value is -124.85, which is below the signal line, suggesting a bearish momentum. citeturn0search3
- **Stochastic Oscillator:** The Stochastic Oscillator is at 38.63, indicating a neutral market condition. citeturn0search3
**Support and Resistance Levels:**
- **Support:** The stock has support at ₹4,996.55. citeturn0search3
- **Resistance:** The resistance level is at ₹5,455.40. citeturn0search3
**Conclusion:**
CRISIL Ltd. is currently in a neutral technical position, with indicators suggesting neither strong bullish nor bearish momentum. Investors should monitor these indicators closely, as a breakout above resistance levels could signal a bullish trend, while a drop below support levels might indicate a bearish move. It's advisable to consider these technical factors alongside fundamental analysis and broader market conditions when making investment decisions.

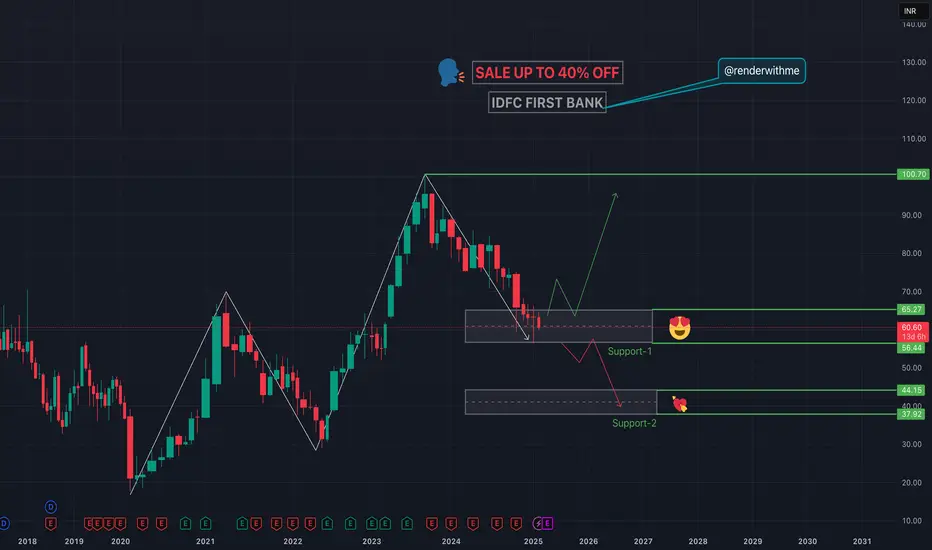
IDFC FIRST BANK - TECHNICAL#idfcfirstbank is an Indian private sector bank based in Mumbai, known for its wide range of banking services including personal banking, loans, accounts, cards, and investments. Here are some key levels in the chart about the bank #BankNifty #Nifty #renderwithme
What is option chain pcr ?The Put-Call Ratio (PCR) is a popular technical indicator used by investors to assess market sentiment. It is calculated by dividing the volume or open interest of put options by call options over a specific time period. A higher PCR suggests bearish sentiment, while a lower PCR indicates bullish sentiment.
The Put Call Ratio (PCR) is a popular metric traders use to gauge market sentiment. It is calculated by dividing the number of put options by the number of call options. A high PCR indicates a bearish sentiment, as more traders buy puts, expecting the market to decline
An options chain displays all available option contracts for a security, organized by expiration date and strike price. Options chains typically show each contract's bid price, ask price, volume, open interest, and implied volatility.

What is rsi ? how to use it ?The relative strength index (RSI) is an indicator used in technical analysis to determine overbought and oversold conditions, which provides traders with buy and sell signals (when to enter and exit positions). Values above 70 indicate overbought conditions and those below 30 indicate oversold conditions.
To use the RSI indicator, check if the value is above 70 to show an asset is overbought, or below 30 to show it is oversold. Traders can use these signals to find possible trading opportunities.
Successful trades often occur when the RSI crosses above 30 (indicating a buy signal) or below 70 (indicating a sell signal). Adjusting the RSI period to 9 can make it more sensitive to price changes and be suitable for more active trading strategies.

Pulling the Elephant by the tail...Hello traders!
Sellside has been delivered... Any shorts now are in grave jeopardy... Chasing the market at this point is like pulling the ELEPHANT by the tail and expecting it to get pulled...
In short, enjoy the weekend now and kill all short positions... Sellers in jeopardy for the last hour of trading... Market repricing to 22922 and above.
GLGT.
Not financial advice....

NIFTY analysis based on Elliott Wave theoryNIFTY is looking like in wave (Z).
Now, wave (Z) is always in 3 moves (ABC).
If we take a look in 75 min chart of NIFTY, we may see wave (a) of wave (Z) finished on 12 Feb. The price is in wave B of wave (b) now.
It looks like Zig-zag pattern is forming and it is observed most of the times that, Wave B of Zig-zag takes at least equal time of wave A.
So we may assume that, wave (b) of Zig-zag will finish at least by 19 Feb near 50% to 61.8% And then we may expect a fall to form wave (c) of Zig-zag.
This analysis is based on Elliott Wave theory and Fibonacci.
This analysis is for educational purpose only.

Triveni Turbine Ltd.#TRITURBINE SHOWING STRENGTH, JACKPOT CANDIDATE
TARGET - 720
ENTRY - 580
STOP LOSS - 550
TIME FRAME - MONTHLY
TECHNICALS - BULLISH
Ahead of the quarterly earnings for the December 2024 period, brokerage Motilal Oswal is bullish on the stock with a price target of Rs 830. "Despite weakness in domestic markets, Triveni Turbine posted healthy growth in revenue, profitability and order inflows in FY24
Triveni Turbine is forecast to grow earnings and revenue by 19% and 18.9% per annum respectively. EPS is expected to grow by 20.4% per annum. Return on equity is forecast to be 27.3% in 3 years.
THIS IS NOT ANY FINANCIAL ADVISE

Nitiraj engineers Ltd20% Upper Circuit: Stock jumps after reporting 32,450% QoQ net profit growth in Q3
The shares of a micro cap Electronic stock engaged in manufacturing and selling of Electronic Weighing Scales, Currency Counting Machines, Taxi Fare Meters, etc hits 20 percent upper circuit after posting strong Q3 results with Net Profits surging 204 percent YoY and 32,450 percent QoQ.
keep an eye on it...

What is adx and how to use it ?The ADX indicator is designed to quantify the strength of a trend, regardless of its direction. It does this by measuring the degree of price movement within a given period. The ADX values range from 0 to 100.
The traditional setting for the ADX indicator is 14 time periods, but analysts have commonly used the ADX with settings as low as 7 or as high as 30. Lower settings will make the average directional index respond more quickly to price movement but tend to generate more false signals.
ADX below 20: The market is currently not trending.
ADX crosses above 20: A new trend is emerging.
ADX between 20 and 40: This is considered as a confirmation of an emerging trend.
ADX above 40: The trend is very strong.
ADX crosses 50: the trend is extremely strong.

What are the most important things to remember while trading ?It is a high-stakes game where many are lured by the promise of quick riches but ultimately face harsh realities. One of the harsh realities of trading is the “Rule of 90,” which suggests that 90% of new traders lose 90% of their starting capital within 90 days of their first trade.
Stop loss
Plan the trade
Trading strategy
Control your trading capital
Correlated stocks
Discipline
Risk management
Arrange sufficient capital
Determine market conditions
Learn trading discipline
Market risk
Patience
Profits occur sporadically
Start small
Study the markets
Understand securities
Avoid overtrading
Avoid penny stocks
Broker requirements
Consider rebalancing portfolio occasionally
Consider your risk tolerance
Cut losses with limit orders
Diversification
Do not average your trades

Nifty 50 spot 22929.25 by the Daily Chart viewNifty 50 spot 22929.25 by the Daily Chart view
- Just an FYI to note, for the current status of the Nifty 50 Index Daily Closure
- Nifty 50 Index 22775 to 22950 Support Band is yet sustained and nothing more to quote

Nifty about to TRAP longs... Bullish? Think AGAIN!Hello traders!
I'm looking at equal lows/sellside as the draw. My narrative is that we would take out any longs remaining with BUYSIDE at 23144.70 .
If we gap up above buyside, which is what I expect, it would be an easy day for shorts.
If we gap down, we may see a rush up to buyside and then take the move forward to SELLSIDE at 22786.90 .
But whatever the gap scenario is, my draw remains towards 22786.90...
GLGT!
Not financial advice.

ONGC : Is oil Going to burn?
Technical View
Box trading strategy in which you identify a stock consolidating for couple of days and trade in the direction of the breakout. In case of ONGC the stock was consolidating for about three days before breaking out earlier today.
PRO TIP
Use the High of the candle as your stop loss and trail it to either protect profits or hold your trade for longer duration.
Target 227 Intra-day Target
Fundamentals
Weak Q3FY25 Results:
ONGC's consolidated net profit attributable to owners declined by 19.4% to ₹8,621.69 crore in Q3 FY25, compared to ₹10,703.13 crore in the same period last year. This drop was attributed to lower global crude prices.
The company reported a 6.9% decrease in net profit for the quarter, standing at ₹9,784 crore, down from ₹10,511 crore in the same period last year.
ONGC's gross revenue also showed a slight decline of 0.7%, falling to ₹1.66 trillion in Q3 FY25, compared to ₹1.67 trillion in Q3 FY241. The company's revenue from operations also saw a decline, reaching ₹166,096.68 crore.
Bearish Trend: The stock is trading below its 5-day, 20-day, 50-day, 100-day, and 200-day moving averages, which indicates a bearish trend in its short to long-term performance.
Brokerage Views:
CLSA has cut its FY25 EPS estimate by 5% due to cautious outlooks on the company's production and profitability
Not an investment advice
