NIFTY50 - VULNERABLE TO 20% CORRECTIONSymbol - NIFTY50
NIFTY50 has been trading within a defined range for the past several months, unable to generate any meaningful trending move due to the absence of strong fundamental or macroeconomic catalysts on either side. Both bullish and bearish drivers have remained largely muted, resulting in a period of indecision and lackluster volatility.
While the index itself has shown little directional progress, distribution patterns are increasingly visible across the broader market, which continues to exhibit a consolidation to bearish bias. This suggests that institutional participation may be shifting, and underlying sentiment is weakening despite the Nifty50’s apparent stability.
There are several macroeconomic and geopolitical factors that could contribute to a potential correction in global equity markets. Although listing them all would make this analysis excessively long, some of the key concerns include:
1. Rising inflationary pressures driven by US tariffs implemented under Trump’s economic policy.
2. Weak US fiscal policy and growing concerns that the US government could default on its debt obligations.
3. Elevated recession expectations in the United States.
4. Gold and Silver simultaneously hitting historic highs, signaling a clear risk-off sentiment, even as US equity markets trade at record levels.
5. Overvaluation and speculative euphoria in AI and machine learning related stocks, indicating a potential bubble in select sectors.
At current levels, valuations appear moderately high, and the 'smart money' or true value buying zones remain significantly lower. Based on these factors, my personal bias leans toward a major correction in the coming months. I anticipate a potential downside of around 20% or more in NIFTY50.
This is a positional view, so I am not sharing immediate support or resistance levels. However, the 20-21K zone and below may represent attractive long term accumulation levels for investors once the correction plays out.
It’s worth recalling that in my previous outlook last year, when Nifty50 traded near 26000, I projected a 10–15% correction, which materialized shortly after. This time, however, the downside potential could be even deeper - though only time will tell how the broader macro picture unfolds.
Disclaimer: This analysis is shared purely for educational purposes and should not be considered trading or investment advice.
Nifty50
#Nifty50 Next Week Analysis (October 27 - November 2, 2025)
The #Nifty 50 index closed the week ended October 24, 2025, at 25,795.15, marking a 0.37% decline and snapping a six-day winning streak amid profit booking in select heavyweights like banking and telecom stocks. This came after a strong rally that pushed the index near its all-time high territory around 26,000 earlier in the week. However, positive global cues, particularly the finalisation of the India-US trade deal, could provide a tailwind heading into next week.
#Support $ Resistance
Immediate Support - 25,800 to 25,300
Immediate Resistance - 26,400 to 26,200
#Influencing Factors
- Bullish Driver - Domestic flows remain strong, with FIIs net buyers (~₹12,000 crore last week) amid easing geopolitical tensions.
- Bearish Driver - US markets are choppy ahead of the November 5 election, and any escalation in Middle East tensions could pressure oil prices and risk assets.
#My Overview
Based on recent price action, the index is consolidating in a tight range after the pullback. It remains above Resistance Level now acting as a support given in the chart , indicating #Bullish -to-Neutral or #Bearish momentum without overbought conditions yet.
#Overall Outlook
#nifty50 Next week looks set for consolidation with a positive tilt, driven by trade deal optimism and resilient domestic buying. Bulls could regain control if Nifty sustains above 26,400 early in the week, targeting 28,000+. Bears may dominate on a close below 25,200, pulling toward 24,500. Stay tuned to US-India negotiations for intraday triggers.
#Trend Overview
Trend Neutral to Bearish and 'Can' go down due to bearish diversions -
~~ Disclaimer ~~
High Risk Investment
Trading or investing in assets like crypto, equity, or commodities carries high risk and may not suit all investors.
Analysis on this channel uses recent technical data and market sentiment from web sources for informational and educational purposes only, not financial advice. Trading involves high risks, and past performance does not guarantee future results. Always conduct your own research or consult a SEBI-registered advisor before investing or trading.
This channel, Render With Me, is not responsible for any financial loss arising directly or indirectly from using or relying on this information.

Nifty 50 spot 25795.15 by Daily Chart view - Weekly updateNifty 50 spot 25795.15 by Daily Chart view - Weekly update
- Support Zone 25430 to 25670 for Nifty Index
- Rising Support Channel stayed grounded by continued supportive role
- Falling Resistance Trendline and Resistance Channel Breakout well sustained
- Resistance Zone 25875 to 26060 and then 26200 to ATH 26277.35 for Nifty Index
- The final hurdles stand firm grounds and is yet untimely to get to see a New Lifetime High created
- Nifty Index earlier shied away to cross the 25K level and now acting likewise to breach the ATH 26277.35 mark
Nifty - Elliot WavesNifty showed some strong recovery today and seems to be headed higher.
There are two possibilities - We just recover part of the fall in B and then head to 24k in C down or we make a new high till 25800 and then head down to 23800.
My favored count is the latter, why? Because I expect BNF to make a new swing high.
Also, why am I looking and a new low? - Bank Nifty did a 5 wave down, so at least one new low has to come in another 5 waves down till 50-51k (I am expecting a deeper cut till 45-46k - but leaving that for later)
BNF counts:
In any case - we are good for a run up for a few days if not weeks in the market - look for pockets of strength and participate - I like realty, defense, IT and Pharma as RR is better there.
I feel auto, metals, PSU banks could be topping - I wouldn't bet on it though :)
All the best!

Daily Analysis Nifty: 23/10/25Quick analysis before we start our session. Clear levels for Nifty50 spot prices

NIFTY KEY LEVELS FOR 21.10.2025NIFTY KEY LEVELS FOR 21.10.2025
Timeframe: 3 Minutes
If the candle stays above the pivot point, it is considered a bullish bias; if it remains below, it indicates a bearish bias. Price may reverse near Resistance 1 or Support 1. If it moves further, the next potential reversal zone is near Resistance 2 or Support 2. If these levels are also broken, we can expect the trend.
When a support or resistance level is broken, it often reverses its role; a broken resistance becomes the new support, and a broken support becomes the new resistance.
If the range(R2-S2) is narrow, the market may become volatile or trend strongly. If the range is wide, the market is more likely to remain sideways
please like and share my idea if you find it helpful
📢 Disclaimer
I am not a SEBI-registered financial adviser.
The information, views, and ideas shared here are purely for educational and informational purposes only. They are not intended as investment advice or a recommendation to buy, sell, or hold any financial instruments.
Please consult with your SEBI-registered financial advisor before making any trading or investment decisions.
Trading and investing in the stock market involves risk, and you should do your own research and analysis. You are solely responsible for any decisions made based on this research.

Nifty Bulls Cooling Off Before Next Surge?Eyeing a Strategic Entry on Pullback!
Nifty continues to ride the bullish wave 🌊, but signs point to a short-term pullback by Friday’s close — a healthy dip before the next leg up. 📉➡️📈
🎯 Trade Setup:
🔹 Buy: 25850 CE (28th Oct Expiry)
🔹 Entry: ₹165
🔹 Stop Loss: ₹135
🔹 Target: ₹225
📌 Risk-Reward is solid, with smart positioning ahead of next week’s move.
🧠 Stay patient — let the price come to you. Great setups don’t chase, they wait and strike. 🐅
Your feedback drives our content and keeps everyone trading smarter. Let’s make those pips together! 🚀
Happy Trading,
– The InvestPro Team

JSWENERGY - Perfect Inverted H&S Pattern!!!JSWENERGY is forming a perfect inverted head and shoulders pattern with perfect volume levels,making highs and higher highs .
In the Weekly time frame too, there is 3 white soldiers pattern accompanied by perfect volume rise!!!(shown below)
Target and SL shown @ chart.
Safe Entry can be after breakout....with low of breakout candle being SL for the respective entry.
With results releasing tomorrow, volatile move expected!!!!
Just my view...not a tip nor advice!!!!
Thank you!!!!
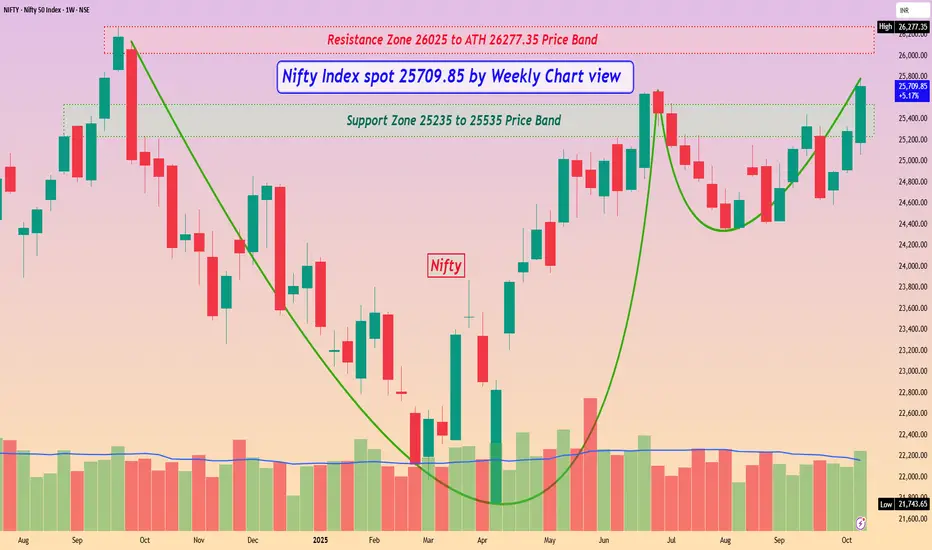
Nifty Index spot 25709.85 by Weekly Chart viewNifty Index spot 25709.85 by Weekly Chart view
- Support Zone 25235 to 25535 Price Band
- Resistance Zone 26025 to ATH 26277.35 Price Band
- Crystal Clear Bullish Cup & Handle formed around Support Zone
- Lets hope for the best to happen based on this Nifty 50 Index Chart setup
- Sharing this beautiful Nifty Index Chart setup, courtesy by a curious Co-Learners observation 😊👍🏽🤞🏽
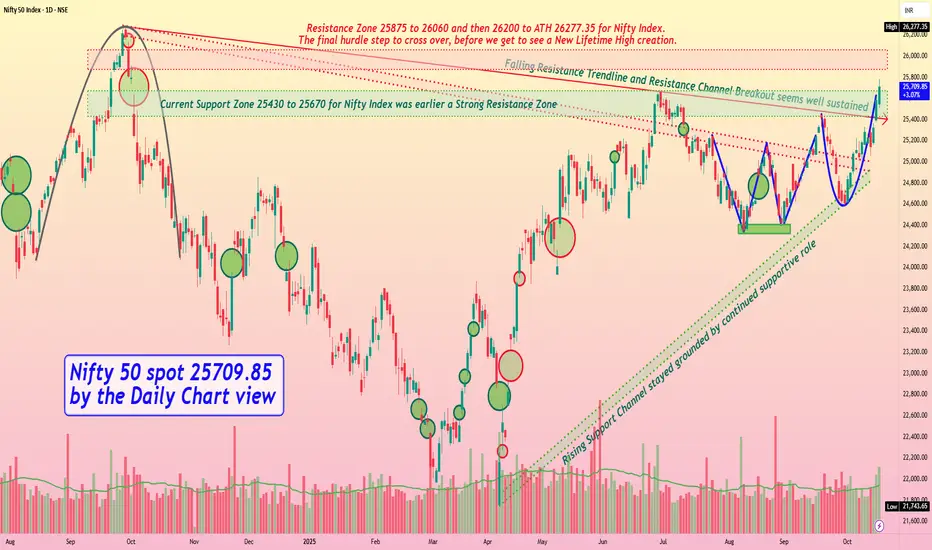
Nifty 50 spot 25709.85 by the Daily Chart view - Weekly updateNifty 50 spot 25709.85 by the Daily Chart view - Weekly update
- [ b]Nifty Index now just 567.50 points away from ATH 26277.35 for creating a New Lifetime High Milestone
- Resistance Zone 25875 to 26060 and then 26200 to ATH 26277.35 for Nifty Index
- The final hurdle step to cross over before we get to see a New Lifetime High creation
- Both Falling Resistance Trendline and Resistance Channel Breakout seem well sustained
- Current Support Zone 25430 to 25670 for Nifty Index was earlier a Strong Resistance Zone
- Rising Support Channel has stayed firmly grounded by providing the continued supportive role
- Bullish Technical patterns Double Bottom "W" followed by Rounding Bottom formed by Support Zone neckline
A quick alert for Nifty PUT buyers; 17/10/25All details in the video. Be alert for potential pitfalls in the market. If holding trades, make sure you know your exit points.
In my opinion, we have another high pending this Diwali 👍🏻

Nifty 50 Hits Major Supply Zone After Trendline & VCP Breakout!Today, we're diving deep into the Nifty 50 chart, which is painting a very interesting picture. After a significant downturn, the bulls have been patiently and persistently fighting back. We've seen the index respect several supply zones in the past, leading to temporary declines. However, the character of the market seems to be shifting, and a major breakout has just occurred that we need to talk about.
🚀 A Tale of Two Patterns: Triangles and VCPs
If you look closely at the price action, a story unfolds. For months, Nifty was constrained by a sloping trendline, getting rejected from it on two separate occasions. At the same time, the price was carving out a series of higher lows. This convergence of a flat top (the trendline resistance) and rising bottoms formed a classic ascending triangle pattern—a sign of building bullish pressure.
What makes this setup even more compelling is the subtle pattern within the pattern: a Volatility Contraction Pattern (VCP). Notice how after each minor decline, the pullbacks became shallower. This "drying up" of selling pressure is a textbook sign that sellers are losing control and the big players are accumulating positions. The formation of this VCP right before the breakout was a strong hint that the subsequent move could be powerful and decisive.
Yesterday, we witnessed the culmination of this battle. The price broke out of the triangle and shattered the downward-sloping trendline with significant momentum, slicing through previously tested supply zones. This is a clear victory for the bulls in the short to medium term.
What's Next? Navigating the Path Ahead 🎯
Now for the million-dollar question: where do we go from here? The breakout is strong, but the path ahead isn't without its obstacles.
The Immediate Hurdle: Price is currently pushing into a fresh supply zone . This is the first significant test for the bulls post-breakout. We should anticipate some friction here as sellers who were waiting at these levels might try to defend their territory. This could lead to a bit of consolidation or a minor pullback, which is perfectly healthy.
The Ultimate Test: If the momentum continues and buyers overwhelm the sellers at the current zone, the next major target comes into view. This upper supply zone is particularly critical because it coincides with the All-Time High (ATH). The ATH is not just a technical level; it's a major psychological barrier where many traders may look to book profits. A rejection from this all-important zone is a high probability, given its significance.
In the upcoming sessions, we'll be watching closely to see how the price behaves at these key levels. The strength of the current momentum suggests that the immediate supply zone could be overcome, but the real test awaits at the peak.
Lastly, Thank you for your support, your likes & comments. Feel free to ask if you have questions.
The goal of a successful trader is to make the best trades. Money is secondary.
Disclaimer: Please note that this analysis is purely for educational purposes and should not be considered as a trading or investment recommendation. I am not a SEBI registered Analyst. Always conduct your own research and consult with a financial advisor before making any investment decisions.

NIFTY The Nifty has moved up nicely after opening strong above the trend line. The first resistance is at 25,650, and the second is near the all-time high. Let's see what happens tomorrow, as it's Friday. Hopefully, Donald Trump isn't upset or planning any actions that could turn the market bearish.

GOKULAGRO – A Strong Demand Zone Meets Classic Breakout Retest 📈 Market Insights 📈
In the world of price action, every rally and pullback leaves behind clues — and supply and demand zones are among the most telling. These zones are the footprints of institutions — areas where large players once entered or exited positions, creating visible imbalances on the chart. When price revisits these zones, it often reacts sharply, as unfilled orders get triggered once again.
🧩 Supply & Demand View 🧩
In the case of GOKULAGRO , we’re witnessing this principle in action. After a powerful rally that pushed the stock to fresh all-time highs, the inevitable profit-booking wave stepped in — giving birth to a clean supply zone near the top. This is where sellers briefly took control, pausing the bullish momentum and cooling off the rally.
Now, what’s particularly interesting is where the price has landed. It’s currently hovering around a strong demand zone — not just any support level, but the very origin of the rally that broke previous resistance barriers and fueled the stock’s breakout run. These areas are historically loaded with pending buy orders, and a return to them often sparks a renewed upward reaction.
Demand Zone Strength: Located at the base of a prior impulse move, signaling prior institutional buying.
Price Reaction Potential: Sharp reversals often emerge from such zones as demand reactivates.
Buyer Interest Area: This zone marks where large players previously entered the market aggressively.
🚀 Classical Chart View 🚀
From a traditional technical standpoint, the broader structure also paints a bullish narrative. The stock recently broke through a significant resistance level — a level that had previously capped price for weeks. The breakout was accompanied by a notable volume surge , suggesting strong conviction behind the move.
What’s unfolding now is a textbook example of “resistance turning into support.” As price revisits this breakout zone, selling pressure has notably declined — reflected in a visible drop in volume during the pullback. This reduced activity indicates that sellers are losing steam, and the correction might simply be a healthy retest rather than a reversal.
Old Resistance → New Support: A classic structural shift confirming bullish continuation.
Volume Behavior: Declining sell volume during the pullback suggests waning bearish momentum.
Zone Confluence: The overlap of the demand zone with this retested level strengthens the bullish setup.
✨ Final Takeaway ✨
Both analytical lenses — supply and demand as well as classical technical — align seamlessly here. GOKULAGRO has already found footing at a high-quality demand zone , one that previously launched a major impulse move. If buyers step in again from this region, the stock could well be gearing up for its next leg higher .
For those observing this setup, keeping a protective stop-loss below ₹162.5 could provide a sensible cushion beneath structural support.
💡 Risk Management Reminder 💡
Even the cleanest patterns can fail — that’s the reality of trading. What separates consistent traders from the rest is discipline . Always size your positions wisely and respect your stop-loss.
“The art of trading is not about being right all the time, but about losing less when you are wrong.”
🔄 Patience, consistency, and emotional control often beat bold predictions in the long run.🔄
Lastly, thank you for your support, your likes & comments. Feel free to ask if you have questions.
⚡ Keep learning, keep analyzing — because every chart tells a story! ⚡
This analysis is purely for educational purposes and should not be considered as trading or investment advice. I am not a SEBI-registered analyst.

NIFTY KEY LEVELS FOR 15.10.2025NIFTY KEY LEVELS FOR 15.10.2025
Timeframe: 3 Minutes
If the candle stays above the pivot point, it is considered a bullish bias; if it remains below, it indicates a bearish bias. Price may reverse near Resistance 1 or Support 1. If it moves further, the next potential reversal zone is near Resistance 2 or Support 2. If these levels are also broken, we can expect the trend.
When a support or resistance level is broken, it often reverses its role; a broken resistance becomes the new support, and a broken support becomes the new resistance.
If the range(R2-S2) is narrow, the market may become volatile or trend strongly. If the range is wide, the market is more likely to remain sideways
please like and share my idea if you find it helpful
📢 Disclaimer
I am not a SEBI-registered financial adviser.
The information, views, and ideas shared here are purely for educational and informational purposes only. They are not intended as investment advice or a recommendation to buy, sell, or hold any financial instruments.
Please consult with your SEBI-registered financial advisor before making any trading or investment decisions.
Trading and investing in the stock market involves risk, and you should do your own research and analysis. You are solely responsible for any decisions made based on this research.

#Nifty | Will Nifty Break Free? Triangle Says Soon!#Nifty Daily Outlook:
CMP: 25,285
Pattern: Symmetrical Triangle ▶️
A Symmetrical Triangle pattern is forming on the daily timeframe , following a strong uptrend , a classic bullish continuation setup .
🟣 Breakout Level: A daily close above the falling trendline from the all-time high (ATH) ( marked in purple ) will confirm the breakout.
🎯 Pattern Target: 26,700
🔒 Pattern Invalidation: Close below 24,337 DCB
Price action is compressing tightly within the triangle, indicating a potential volatility expansion soon.
Breakout confirmation could reignite momentum toward new highs.
✅ Dips into support zones can be used for positioning, with proper risk management.
📌 Support & resistance levels remain the same as shared in the tagged weekly post.
#Nifty | #Nifty50 | #SymmetricalTriangle | #ChartPatterns | #SwingTrading | #PriceAction
📌 Disclaimer: This analysis is shared for educational purposes only. It is not a buy/sell recommendation. Please do your own research before making any trading decisions.

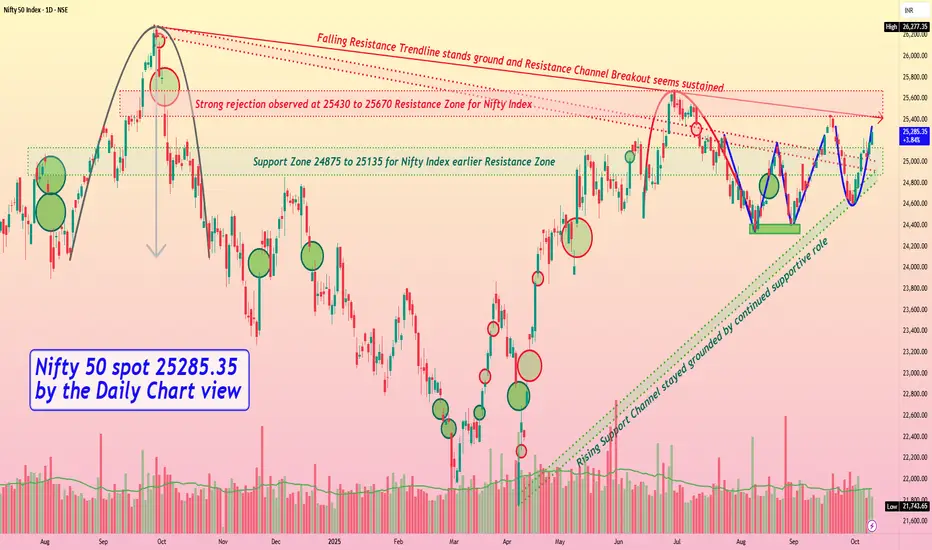
Nifty 50 spot 25285.35 by the Daily Chart view - Weekly updateNifty 50 spot 25285.35 by the Daily Chart view - Weekly update
- Support Zone 24875 to 25135 for Nifty Index earlier Resistance Zone
- Rising Support Channel stayed grounded by continued supportive role
- Strong rejection observed at 25430 to 25670 Resistance Zone for Nifty Index
- Falling Resistance Trendline stands ground and Resistance Channel Breakout seems sustained
- Bullish Technical patterns of "W" Double Bottom followed by Rounding Bottom formed around Support Zone
NIFTY 50 – Bullish Flag Breakout in Progress | Continuation NIFTY 50 is showing a clean bullish flag breakout on the 1H chart after a strong impulsive leg from recent lows.
This consolidation phase acted as a flag correction, where price stayed within a downward-sloping channel before breaking to the upside.
The breakout suggests a continuation of the existing uptrend , supported by price closing above the EMA cluster and reclaiming short-term momentum.
Key Observations:
🚀 Impulsive bullish rally followed by tight flag formation.
🔹 Breakout candle confirming strength above 25,080 zone.
📈 If momentum sustains, next upside targets are 25,180 → 25,250 → 25,300.
⚠️ Invalid if price falls back below 25,05 0 with strong volume.
NIFTY breaking out from a bullish flag pattern 🚀
Continuation setup in play after a strong impulse move.
🔹 Above 25,080 = bullish
🔹 Targets: 25,180 / 25,250 / 25,300
🔹 Invalidation: below 25,050
#NIFTY #PriceAction #Breakout #BullishFlag #TechnicalAnalysis #HenishMavani
Nifty 50 Index – Bullish Pole & Flag Breakout Setup(5-min-15min)The Nifty 50 index on the 5-minute and 15-minute timeframe is showing a bullish pole and flag continuation pattern. After a strong upward rally (the pole), the price has entered a downward-sloping consolidation channel (the flag), indicating healthy profit booking. The pattern suggests potential for a breakout on the upside, resuming the prior bullish trend.
Key levels to watch:
Support: 24,824 – 24,883 zone (green lines)
Resistance: 25,222 and 25,359 (red lines)
Breakout Target Zone: Above 25,400 if price sustains above the flag channel resistance.
The volume profile also indicates strong accumulation near 25,000, further strengthening the bullish bias.

NIFTY 50 – Trendline Support Retest and Possible Pullback Setup🔹 NIFTY 50 is respecting its ascending trendline after a healthy pullback.
🔹 Watch 25,100 support zone carefully — a bounce could resume the uptrend.
🔹 Breakdown below 25,070 = possible retracement.
🧩 Possible Scenarios:
Bullish:
If NIFTY sustains above 25,100 and breaks 25,270, we can target 25,400+.
Bearish:
A breakdown below 25,070 could invite short-term selling up to 24,950 or 24,880.
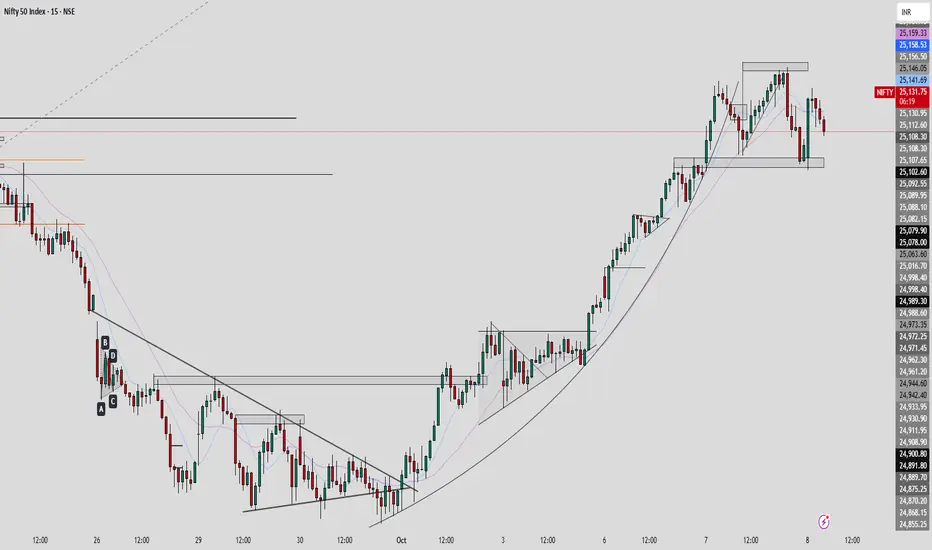
Nifty Updates: Not a bearish trend yet. 07/10/2I have mentioned all the levels in the video. Kindly note that on your chart.
It is still not bearish, so no PE calls yet, especially to carry forward.
Target for Nifty is still pending for 25500, 25800 on swing position (will keep updating for any changes)

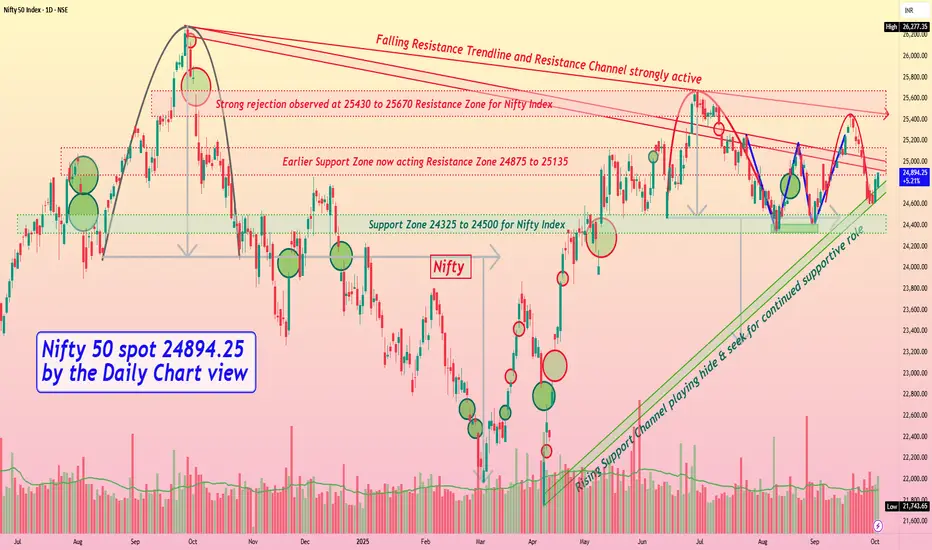
Nifty 50 spot 24894.25 by Daily Chart view - Weekly updateNifty 50 spot 24894.25 by Daily Chart view - Weekly update
- Support Zone 24325 to 24500 for Nifty Index remains active
- Rising Support Channel playing hide and seek for continued supportive role
- Strong rejection observed at 25430 to 25670 Resistance Zone for Nifty Index
- Current Resistance Zone 24875 to 25135 of Nifty Index remains an active hurdle
- Falling Resistance Trendline and Resistance Channel are still playing out pretty strongly
- Bearish Rounding Top scenario effect seems been negated by upswing over the past 2 days
Double Top at the Peak: Is a Bearish Reversal Coming in HDFC AMCHDFC AMC has given a good upside rally of 65% and is form a double top pattern.
The stock is following a bullish trendline but the RSI divergence is creating a bearish sentiment supported by the drop India VIX.
If the stock breaks below the trendline, a bearish trade can be entered with the first target of 5440 following it to 5208.
Bullishness will only be confirmed only once the stock starts trading above 6000 levels.
There is RSI divergence on the higher time frame too and gives more convincing trade in the stock.
Entry :- Below 5809
Target :- 5440 and 5208
Stop Loss :- Close above 5927 (daily charts)
Wait for the price action and trade accordingly.