Supreme industries Short opportunity !!!Supreme industries is looking good for a down move with very nice risk reward ratio...
Nothing much to explain.
Target and SL levels given in the chart
Just sharing my view...not a tip nor advice!!!
Thank you!!!
Nifty50

BITCOIN Neowave ForecastNamaskaram
Watch the video to understand my view...
following instruments Discussed in the video...
#XAUUSD
#BTCUSD
#NIFTY 50
#BANK NIFTY
FX:XAUUSD OANDA:XAUUSD COINBASE:BTCUSD

Gold | Bitcoin | Nifty | Bank Nifty | Neowave AnalysisNamaskaram Everyone
We have discussed following instruments in this video, if you have any query you can ask in the comments.
#Gold
#Bitcoin
#Nifty
#Bank Nifty
COINBASE:BTCUSD FX:XAUUSD OANDA:XAUUSD NSE:BANKNIFTY NSE:NIFTY

Daily analysis for Nifty50: 29/09/25Nifty is still not bullish. A trendline support test is quite possible. That comes at around 24535-24520 range of price. If that is breaching it will test lower levels of 24560, 24405 and 24360 as downside fall.
On bounce it will rise till 24630 to 24740 as resistance.

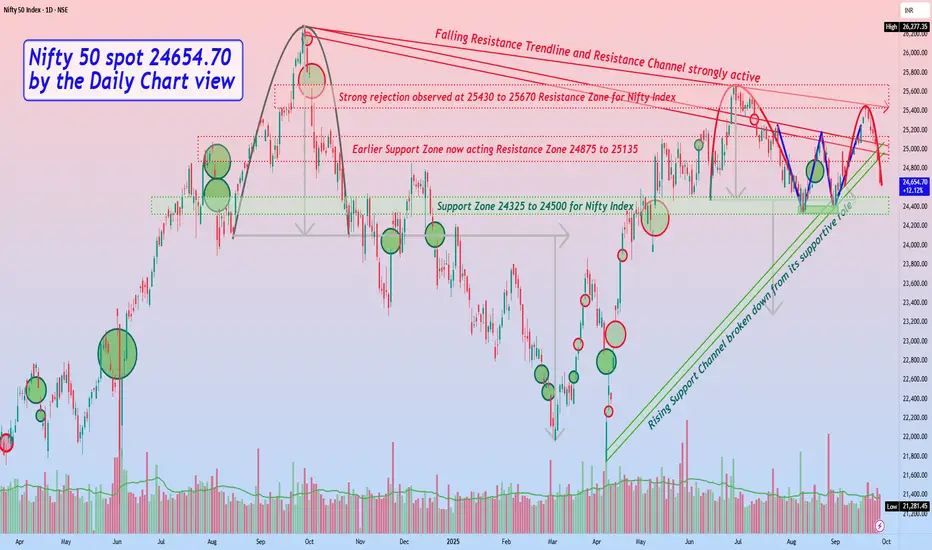
Nifty 50 spot 24654.70 by Daily Chart view - Weekly updateNifty 50 spot 24654.70 by Daily Chart view - Weekly update
- Support Zone 24325 to 24500 for Nifty Index
- Rising Support Channel broken down from its supportive role
- Earlier Support Zone now acting Resistance Zone 24875 to 25135
- Falling Resistance Trendline and Resistance Channel are strongly active
- Strong rejection observed at 25430 to 25670 Resistance Zone for Nifty Index
- Bearish Rounding Top is seen in the making process with Support Zone neckline
NIFTY50 - Long setup , 2hr TFIn the last three trading sessions, Nifty corrected 300 points from 25450 to 25150 . Support is now at 25150 , Change in polarity. What was previously resistance will now act as support.
Key Levels to Watch:
Immediate support at 25150.
Further Upside target around 25450.
Trade Plan:
Enter long above 15 min bullish candle close.
Stop loss 25100 to limit risk.
Target 25450 for conservative exit or trail stop as price moves Higher.
Disclaimer: Risk management is crucial in this volatile market, so keep position sizing appropriate. This analysis is intended for educational purposes and not financial advice.

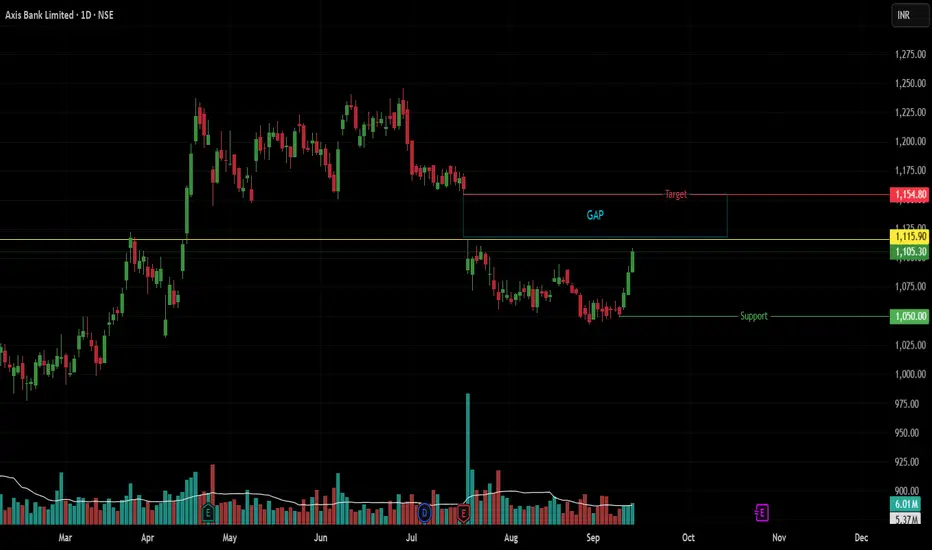
AXISBANK at ₹1115: Breakout or Rejection?Scrip: Axis Bank | Exchange: NSE | Timeframe: Daily
Summary:
Price is approaching a significant resistance level at ₹1115, which was the high of the July 18th gap-down session. A high-volume breakout above this level could trigger a move to fill the gap up to ₹1154. Conversely, a rejection at this resistance could lead to a decline.
Price Action Analysis:
Key Resistance: ₹1115 (The high of the massive gap-down day on July 18). This is the key level to watch.
Gap Analysis: The gap exists between the July 17 low (₹1154) and the July 18 open (₹1090). The first major hurdle to filling it is overcoming the ₹1115 high from that same day.
Key Support: ₹1050 (Recent Swing Low).
Scenario 1: Bullish Breakout (Gap Fill Play)
This scenario requires a true breakout, confirmed by a strong volume surge.
Trigger: A daily candle closing decisively above ₹1115.
Volume Confirmation: The breakout must be supported by significantly higher-than-average volume. This is essential for a "true" breakout and confirms real buying pressure.
Entry: High of the breakout candle (on closing basis).
Stop Loss: Low of the breakout candle.
Target: ₹1154 (To fill the July gap).
Scenario 2: Bearish Rejection (Resistance Hold)
This scenario plays out if the ₹1115 level holds as strong resistance.
Trigger: A clear bearish reversal candlestick at the ₹1115 resistance (e.g., a Shooting Star or Bearish Engulfing pattern on the daily timeframe).
Entry: Low of the reversal candle.
Stop Loss: High of the reversal candle.
Target: ₹1050.
Disclaimer: This is a technical analysis idea and not financial advice. Trading carries a risk of loss. Past performance is not indicative of future results. Always conduct your own research and manage your risk appropriately.
Double bearish pattern in Nifty50Originally, a gartley pattern was completed, and it gives lower targets till 25280, 25155, 25025.
While the targets are validating, it has given another bearish confirmation pattern of Head & Shoulder, which gives further lower targets, as mentioned in the video itself. Lower targets are 24850, 24760 levels.

Nifty weekly expiry analysis for 23/09/2025.Nifty has created 3 consecutive red candle on the daily charts and might touch its 20 EMA.
Market is around the All time high levels and chances of profit booking are there.
Today, nifty has closed 125 points lower than the pervious close.
Major Resistance levels :- 25311, 25438
Support levels :- 25094, 25010
On the hourly charts, the market seems to be taking rejection from the hourly 20 ema and it trading between 20 and 50 EMA.
It is trading in a close parallel channel range. If it remains in the range avoid trading or scalp as per the risk appetite.
Though nifty has taking down the 50 EMA and there are chance of it tested the higher moving averages soon.
Tomorrow is nifty weekly expiry. Wait and watch for the price action near the price levels before entering a trade.

Nifty 50 Analysis as of September 19, 2025~ Technical Analysis ~
Trend Overview: Nifty 50 remains in a broader uptrend, trading within a broken descending channel on the 4-hour chart. It has held above the key psychological support of 25,000 for most of September, but a corrective fall is possible if it breaches 25,250-25,000. Resistance is clustered around 25,400-25,850, with a potential breakout targeting 26,000-26,300.
Key Levels:Support: Immediate at 25,200 stronger at 25,000. A drop below 25,000 could accelerate bearishness toward 24,400-23,500.
Chart for your reference Posted
~~ Disclaimer ~~
This analysis is based on recent technical data and market sentiment from web sources. It is for informational \ educational purposes only and not financial advice. Trading involves high risks, and past performance does not guarantee future results. Always conduct your own research or consult a SEBI-registered advisor before trading.
# Boost and comment will be highly appreciated.

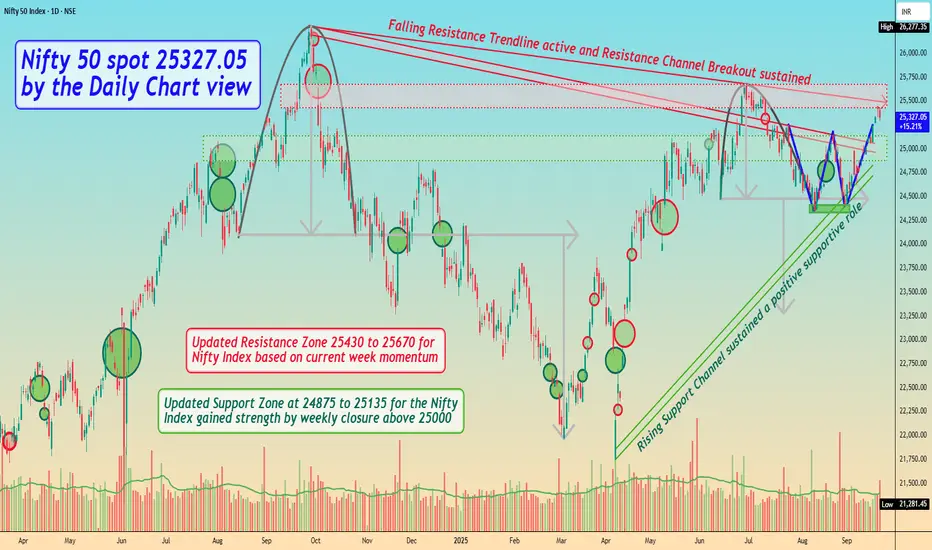
Nifty 50 spot 25327.05 by Daily Chart view - Weekly updateNifty 50 spot 25327.05 by Daily Chart view - Weekly update
- Rising Support Channel sustained a positive supportive role
- Bullish "W" Double Bottom uptrend momentum yet on strong ground
- Falling Resistance Trendline active and Resistance Channel Breakout sustained
- Updated Resistance Zone 25430 to 25670 for Nifty Index based on current week momentum
- Updated Support Zone at 24875 to 25135 for the Nifty Index gained strength by weekly closure above 25000
ETERNAL (ZOMATO) By KRS Charts17th April 2025 / 1:24 PM
Why Eternal ??
1. All Over Bullish Stock. Yet Not Profitable but Business model has potential in near Future.
2. Wave Count is suggesting 4th wave is likely finish and 5th last leg is started which can last till 340 Rs.
3 RSI & MACD is showing bullish continues Divg. bears gave there all but failed to make new lower low.
4. Lower TF is showing W pattern Breakout as well with good volume.
Targets and SL 1W Closing Basis are mentioned in chart.

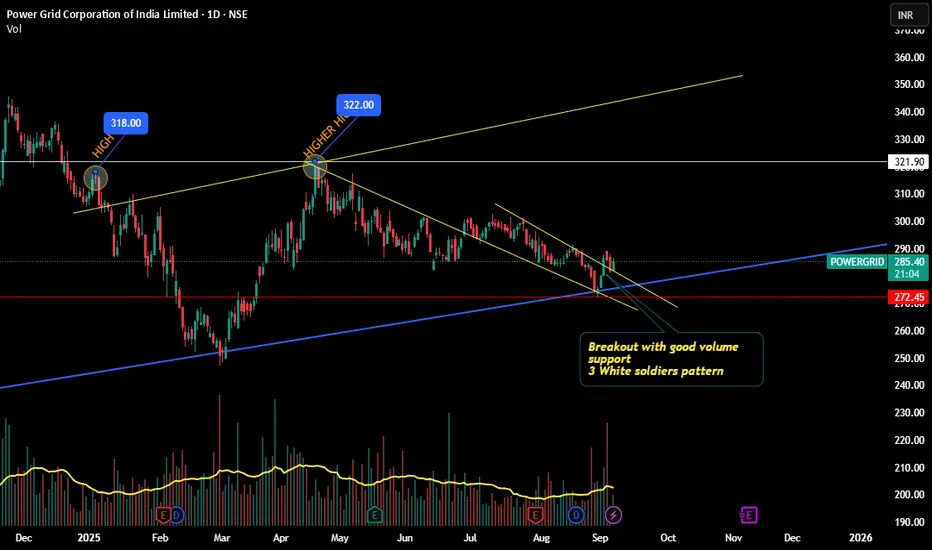
Powergrid showing Many Bullish signs!!!Things explained well in the chart...
Showing you the Monthly and Weekly charts below as Snapshot
For the past 5 years, September been giving good movement for Powergrid(3 years giving nearly 9% upmove)...Let's wait and watch!!!
Just my view ....not a tip nor advice!!!!
Thank you!!!
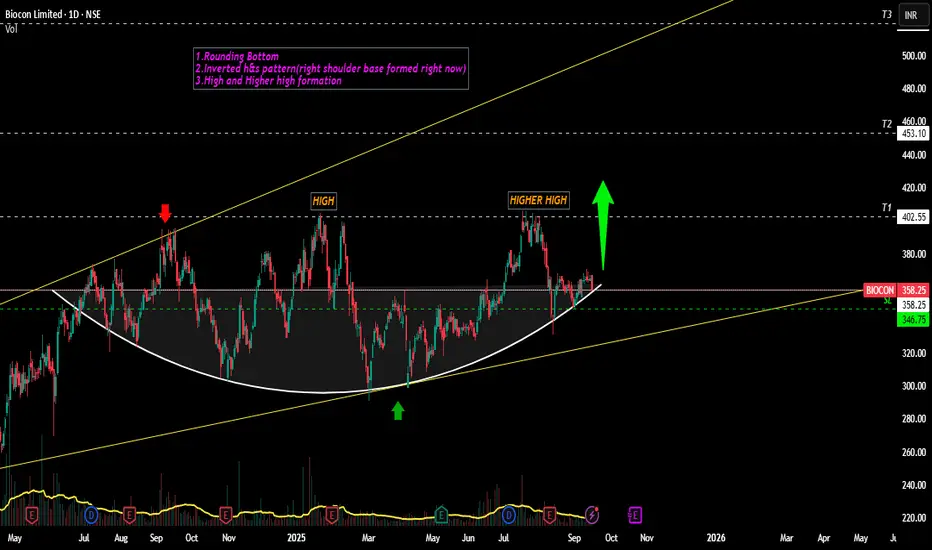
Biocon likely to see Bulls Surge!!!Yes, Charts give the indications for the upcoming long move in Biocon
Below is the daily timeframe wholesome look -
( Expanding Triangle pattern above chart)
(Inverted H&S pattern - above chart)
other points ,target, sl levels mentioned in the chart.
We can expect a Breakout (most likely)/Breakdown(less likely) by this week!!!!
Just sharing my view...not a tip nor advice!!!
Thank you,
mmjimm
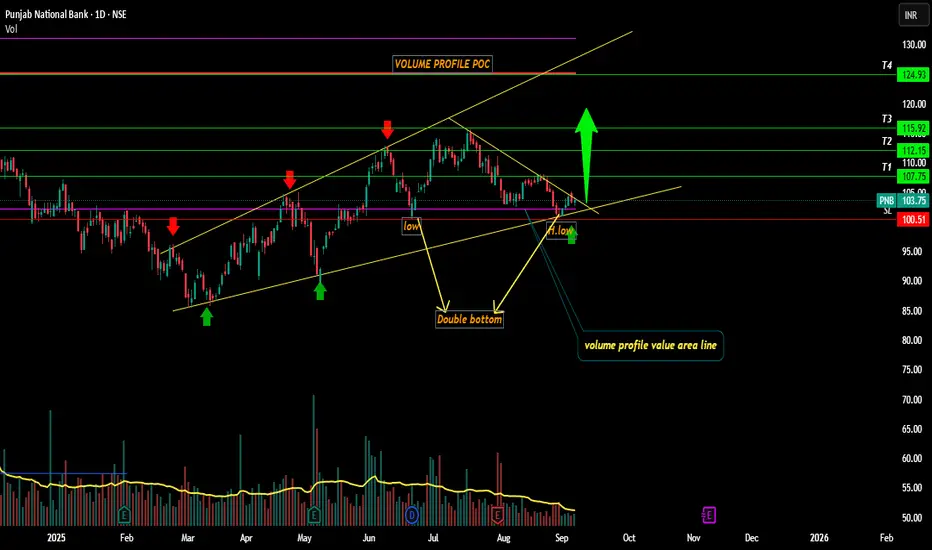
PNB looking Bullish ahead??!!Kindly check out the chart for the explanation.
Reasons-
1. Trendline Support
2. Double bottom
3. Fixed volume profile value area support
4. Low and lower low
5. PSU BANK index too looking bullish , check out idea below
Close below 100.52 - invalidation level
Targets mentioned @ chart.
Just my view ...not a tip nor advice!!!!
Thank you!!!
Nifty Neowave Counts updateHello Everyone
Welcome to intelligent investor, we provide market insights by synchronising and combining all the price action waves from different time frames and gives you single trend.
If you see different keyword in charts, here is the meaning and an explaining video will be made in some time how to read and trade with these waves charts.
Still if you have any query , you can leave a comment.
Keyword Mean-
S- Short Term Trend
M- Medium Term Trend
L- Long Term Trend
1,2,3,4,5 are wave bullish or bearish wave count
C- mean consolidation or correction
X- Like a joint in a trend or consolidation.

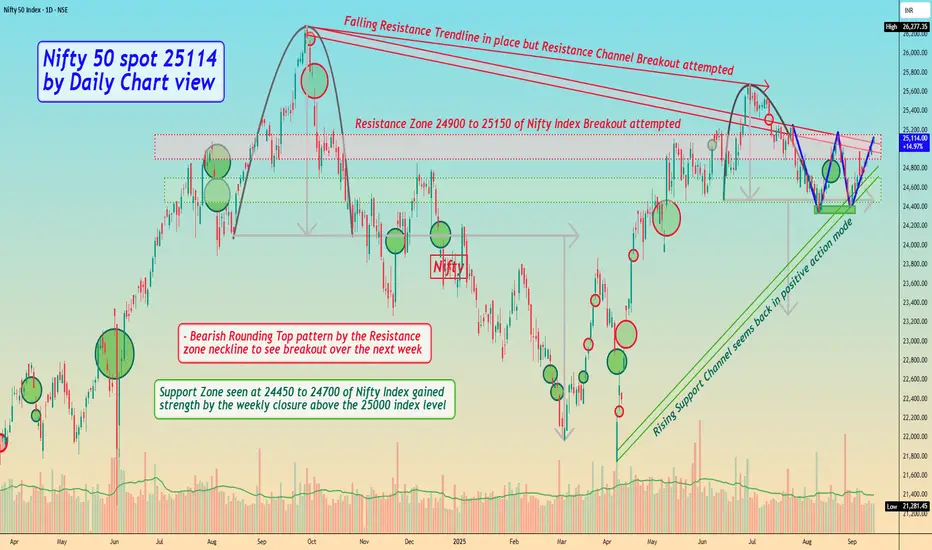
Nifty 50 spot 25114 by Daily Chart view - Weekly UpdateNifty 50 spot 25114 by Daily Chart view - Weekly Update
- Rising Support Channel seems back in positive action mode
- Resistance Zone 24900 to 25150 of Nifty Index Breakout attempted
- Falling Resistance Trendline in place but Resistance Channel Breakout attempted
- Bearish Rounding Top pattern by the Resistance zone neckline to see breakout over the next week
- Bullish "W" with Double Bottom formed below Support Zone, seems instrumental for uptrend momentum
- Support Zone seen at 24450 to 24700 of Nifty Index gained strength by the weekly closure above the 25000 index level
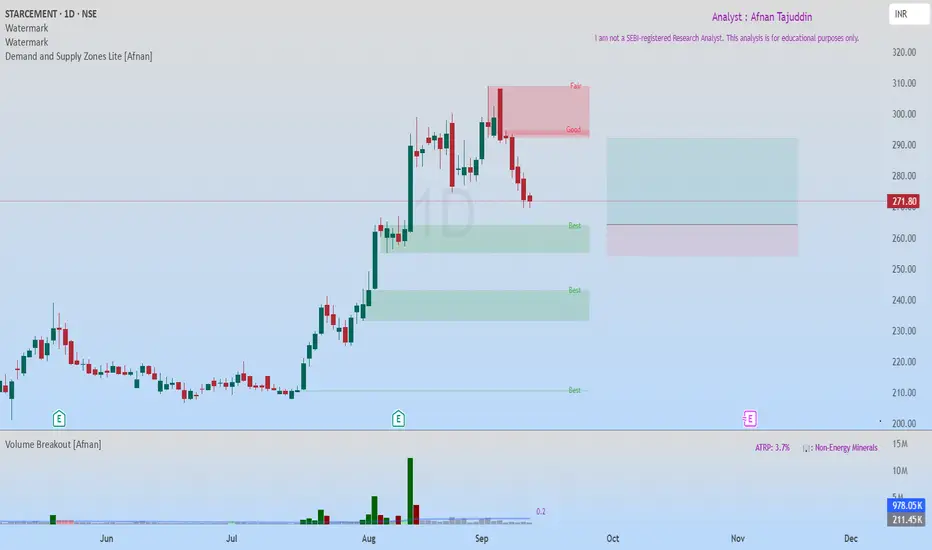
StarCement at Fresh Demand Zone – High Probability Bullish SetupStar Cement recently hit an all-time high and is now retracing towards a fresh Rally-Base-Rally (RBR) Demand Zone . This zone is of high quality, and the overall market structure remains strongly bullish. The best part? There’s no immediate supply zone until a potential 1:2 risk-to-reward target , which makes this setup even more attractive.
🔥 Why This Setup Looks Promising 🔥
The trend is super bullish .
Price is pulling back into demand , creating an opportunity for a low-risk entry.
Demand zone quality is excellent, supporting potential upside continuation.
No major supply zones nearby, leaving room for clean upward movement.
🔄 Two Possible Trade Scenarios 🔄
First Entry Opportunity: Enter near the current demand zone with stop-loss (SL) just below the zone. This is the stronger setup due to the fresh RBR formation.
Second Entry Opportunity: If the first SL gets hit and price dips lower, a secondary demand zone just below provides another entry chance. Place SL below that demand zone for safety.
💡 Risk Management Reminder 💡
While the setup looks strong, risk management remains key . Always place SL below demand zones and size positions carefully. Even the best setups can fail, but disciplined risk control ensures long-term success.
“In trading, it’s not about being right every time, it’s about managing risk and letting probabilities work in your favor.”
🚀 Keep learning, keep practicing, and remember—every pullback is a chance if you know where to look! 🚀
Lastly, thank you for your support, your likes & comments. Feel free to ask if you have questions.
📌 This analysis is purely for educational purposes and is not a trading or investment recommendation. I am not a SEBI registered Analyst.
Public sector banks ready for the rally soon??!!!Reasons for my view-
1.Rounding bottom,
2.Inverted Head and Shoulders pattern,
3.High and higher high formation
PSU bank index -
72.57% Constituted by
SBIN(33.44%),
BANKBARODA(14.79%),
PNB(12.2%),
CANBK(12.14%)
Mark these 4 stocks and add to watch list!!!
Just my view ...not a tip nor advice!!!!

Nifty Auto Sector : A possible talk of the Town.The much talked sector of the Indian stock market is Automobile sector after the government slashed the GST rate from 28% to 18% for small cars and trimming effective tax on large engine SUVs.
Major gainer from the GST rate cuts were the companies dealing in passenger vehicles i.e. 4-wheeler & 2-wheeler.
1. Impact of rate cuts on Passenger Vehicles (2-wheelers)
a. Lower Price : India is a price sensitive market and the price cut will significantly boost the volumes as the entry level bikes and scooters will become affordable, a potential boost to the rural demand after a good monsoon this year.
b. Stock Makret reaction : HeroMoto Corp, Bajaj Auto and TVS Motors are the major beneficial of the GST reform. Analysts project mid to high sales growth in the 2-wheeler companies over the coming quarters as the sector will recover from the sluggish growth due to high inflation rate post-COVID .
c. Margin Expansion : Companies may pass most of the benefits to the consumers but could allow retention of a portion of the benefits, leading to improved Operating margins. Both demand boost and margin gains can be seen in premium models like Bajaj Pulsar, TVS Apache, Royal Enfield (Eicher Motors).
d. Impact on EV : EV scooters (Ola Electric, Ather, TVS iQube, Bajaj Chetak) already benefit from FAME-II subsidies. Now, with ICE two-wheelers getting cheaper, EV makers might face tighter price competition, but overall demand expansion will grow the entire category.
2. Impact of rate cuts on Passenger Vehicles (4-wheelers)
a. Price reduction fuels demand : GST cut on small cars, SUVs and large cars will reduce effective rate from 50%+ to around 40% making cars more affordable across segments, stimulating demand from middle class families as well as premium buyers.
b. Passenger Vehicles Boost : Maruti suzuki (small cars leader) is the biggest beneficiary as price sensitive buyers will return to showrooms. While M&M and Tata motors benefits from the SUVs, which remain the fastest growing category.
c. EV Four-Wheelers : GST cut makes ICE vehicles cheaper, but EVs (already taxed at just 5% GST) remain far cheaper on tax. Beneficiaries: Tata Motors (Nexon EV, Tigor EV), M&M (XUV400 EV, BE 6E, XEV 9E), Maruti (upcoming EVs).
3. Stocks and their YTD Returns
a. Hero Moto Corp (29.23%) : Dealing in 2-wheelers, the stock has giving good return and remain a hot stock as it had acquired 32.5% in Euler Motors, signaling entry into Electric 3-wheeler segment.
b. Bajaj Auto (4.18%) : Stock has delivered a Net profit of Rs. 2049 Crore (up~ 5.8%) while declaring a dividend too. The company has faces a potential "zero month" in August for EVs due to rare-earth magnet supply issues from China. Some brokerages remain neutral suggesting the stock is fully valued in the short term.
c. TVS Motors (46.78%) : Companies EV Expansion and its iQube saw 44% YoY growth. Company plans launching new EV Scooters and EV 3-wheelers.
d. Eicher Motors (36.47%) : Royal enfield recorded its highest quarter sale (~2.8 lakh units) and crossed 1 Million sales in FY25. Though, company will not be relaxed by the GST rate cuts as the premium Bikes (over 350 cc) will now be taxed 40% up from ~31%. Stock is creating new ATH high on the prospect of the Commercial vehicles as reduction of auto components costs by 7-8%. Better margins, improved volumes and healthy ROI in coming quarter, reinforces its growth outlook.
e. Maruti Suzuki (37%) : Maruti is the leading small car producers and will be the leading beneficial of the GST rate cut on small cars. The entry in the EV will also improve the company's portfolio and the upcoming festive season seeing the discounted rate of the GST may help boost the sales.
f. Tata Motors (-6.55%) : Company's outlook is mixed to cautiously optimistic, growth drivers include EV adoption and strong demand on the upcoming car models. Most analysts project modest upside in single digits.
g. Mahindra & Mahindra (19%) : Most beneficial of the GST rate as uniform rate of 40% across all SUVs, 18% on the small cars, 5% GST on tractor segment. The company has demonstrated impressive EV segment growth. The favorable GST reform, pent-up demand and strong booking will help company in good quarter numbers.
Indian Auto sector can be seen as a good sector to invest in for the upcoming quarter considering GST rate cuts, festive season demand and EV adoption.

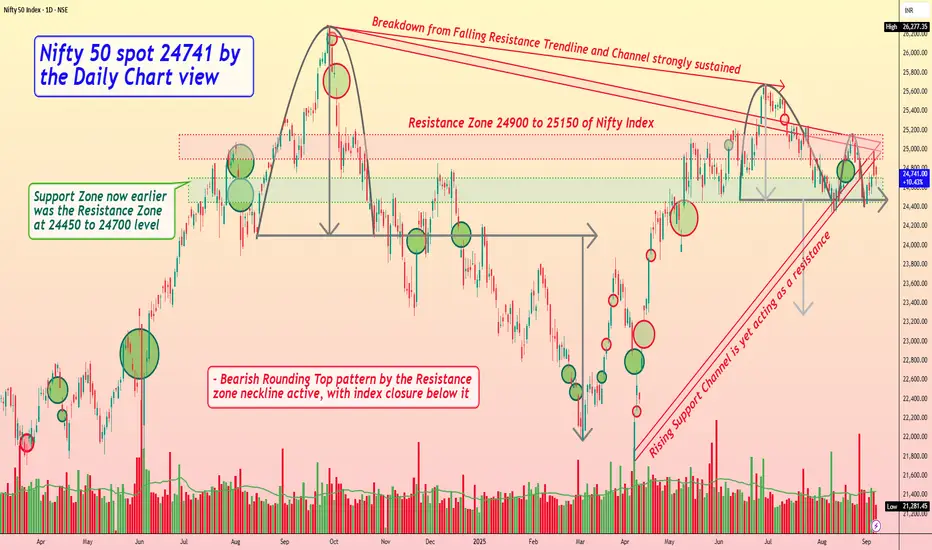
Nifty 50 spot 24741 by Daily Chart view - Weekly updateNifty 50 spot 24741 by Daily Chart view - Weekly update
- Resistance Zone 24900 to 25150 of Nifty Index
- Rising Support Channel is yet acting as a resistance
- Support Zone now earlier was the Resistance Zone at 24450 to 24700 level
- Breakdown from Falling Resistance Trendline and Channel has strongly sustained
- Bearish Rounding Top pattern by Resistance zone neckline active, with index closure below it
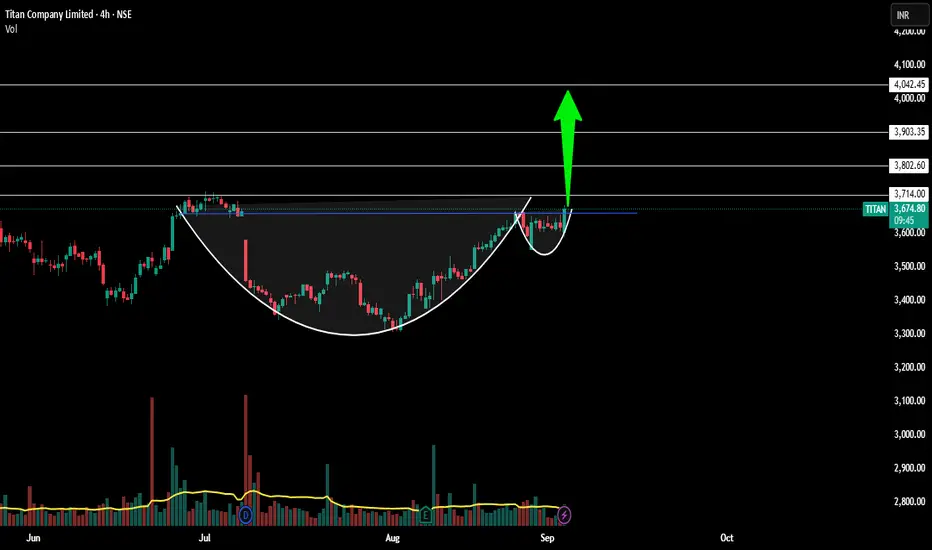
Titan looking good for a 10% upmove to All time high??!!Just a simple Cup and handle pattern...depth of the cup to be the target....
10% from now would be the target level.
Immediate resistance 3726.50...needs to break it!!!!
Looking good in monthly time frame too...with 3 white soldiers candles following a consolidation ....we can expect a good rally if wider markets don't make a panic down move ahead!!!
just my view...not a tip nor advice!!!
Thank you!!!
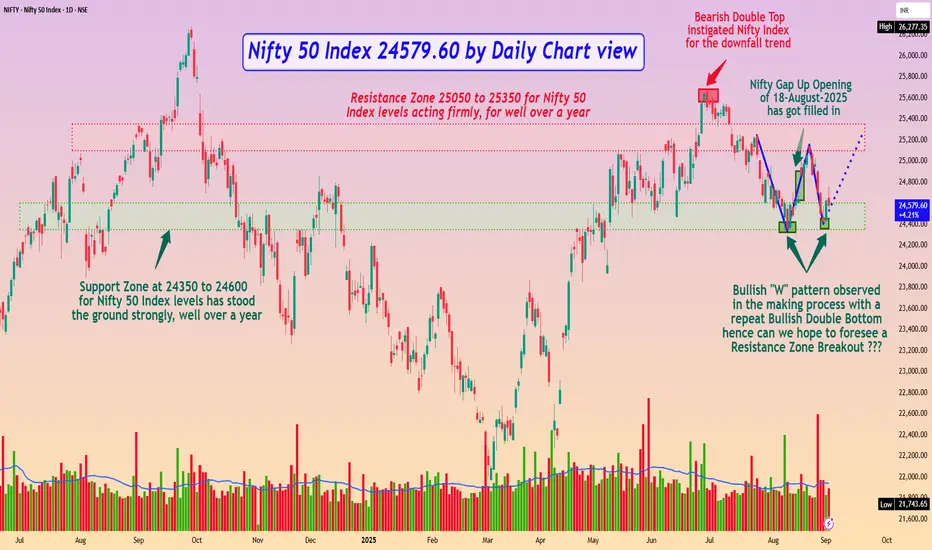
Nifty 50 Index 24579.60 by Daily Chart viewNifty 50 Index 24579.60 by Daily Chart view
- Nifty Gap Up Opening of 18-August-2025 has got filled in
- Bearish Double Top instigated Nifty Index for the downfall trend
- Resistance Zone 25050 to 25350 for Nifty 50 Index levels acting firmly, for well over a year
- Support Zone at 24350 to 24600 for Nifty 50 Index levels has stood the ground strongly, well over a year
- Bullish "W" pattern observed in the making process with a repeat Bullish Double Bottom hence can we hope to foresee a Resistance Zone Breakout ???