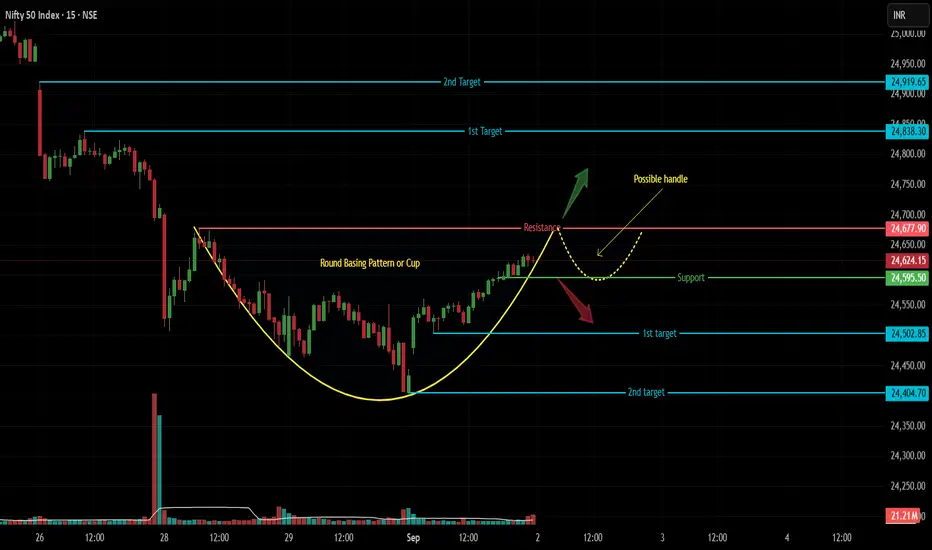
Nifty Intraday Expiry Setup! Sep 02 - Cup & Handle in Play!Body:
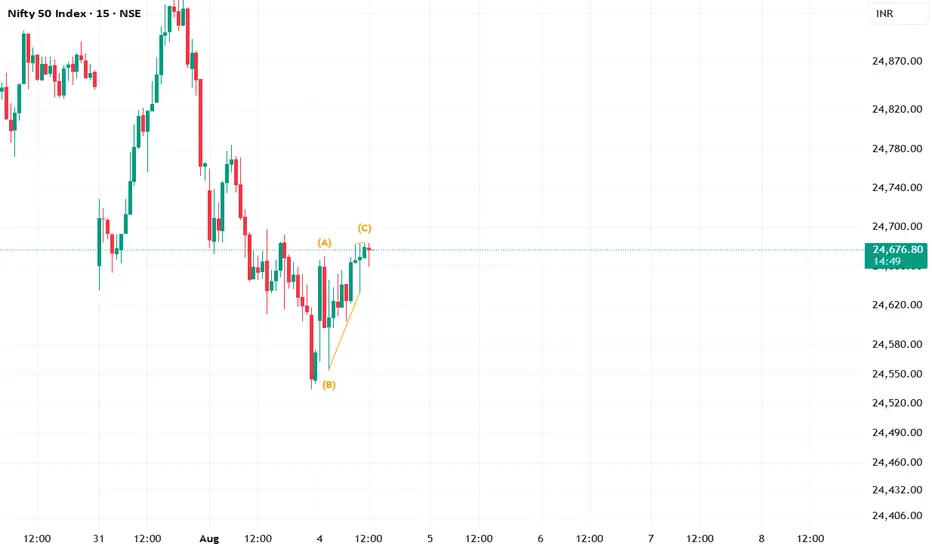
Nifty 15m is painting a classic price action setup! A nice rounding cup ☕ is aiming for the resistance zone ⚡
⚔️ Key Levels:
Resistance: 24680 - 24700
Support: 24595 - 24600
The Playbook:
✅ Handle Formation (Ideal): Price hits resistance, makes a U-turn to test 24595-600 as support to form the handle. Then we wait for the next breakout!
🔻 Break DOWN (Support Breaks):
T1: 24500
T2: 24400
🔺 Break UP (Resistance Breaks):
T1: 24800 - 24840
T2: 24900 - 24920
No directional trades between support & resistance! Wait for the break for a clear signal. 🚦
Disclaimer: This is purely an educational idea and not trading advice. Please do your own research and understand the risks involved before trading.
Boost 👍 and Follow for more price action ideas!
Nifty50
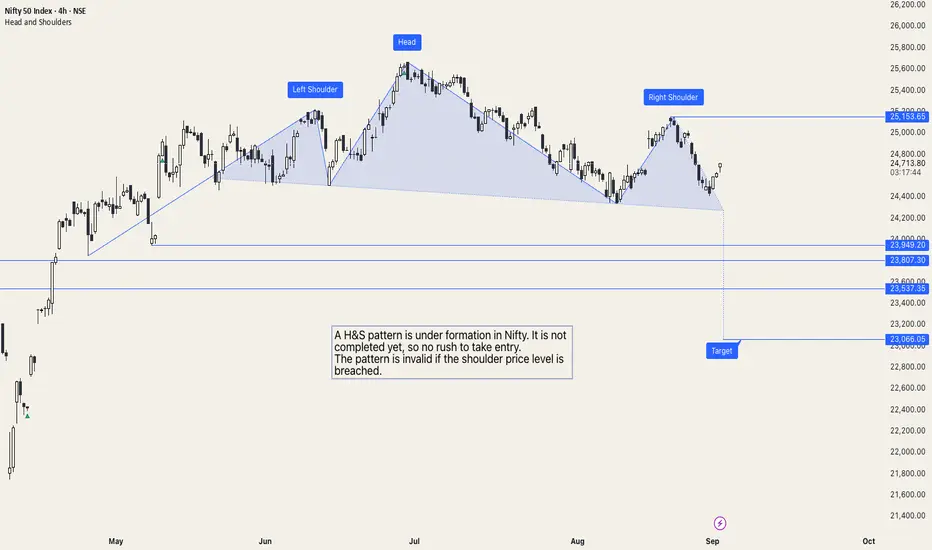
Head and Shoulder pattern in NiftyA H&S pattern is under formation in Nifty. It is not yet completed, so there is no rush to take entry.
The pattern is invalid if the shoulder price level is breached. The chart and levels will be updated once the pattern is validated or invalidated.
Downside levels are 23950, 23810, 23540 and 23070.
Upside levels are 24900, 25150.
Crucial Week Ahead: Bounce or Breakdown for Nifty?The Nifty ended Friday’s session at a very crucial technical level, which makes the coming week particularly important for market direction. The index has been showing signs of weakness after a sharp rally, and the 24350 level has now emerged as a key support zone. If Nifty fails to sustain below this level, it could open the doors for further downside. The next major support is placed around 24000–23800, which also coincides with previous demand zones and moving average clusters.
Traders should note that the market sentiment next week will be critical. A sustainable bounce from the current level could re-establish bullish momentum and keep the uptrend intact. However, a decisive breakdown below 24350 may trigger profit booking and a short-term trend reversal toward lower levels.
Overall, next week could act as a make-or-break zone for the Indian market, as price action around these levels will decide whether we continue higher or witness a deeper correction.
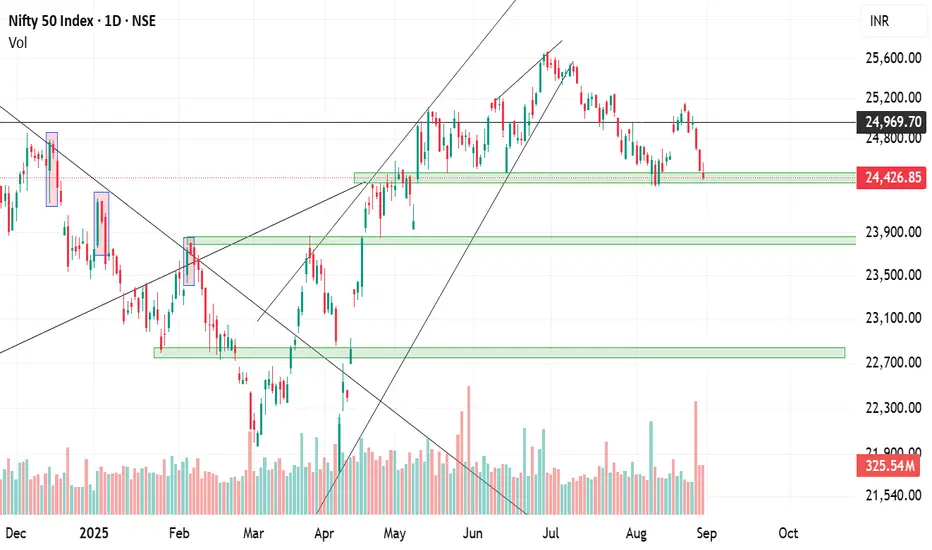
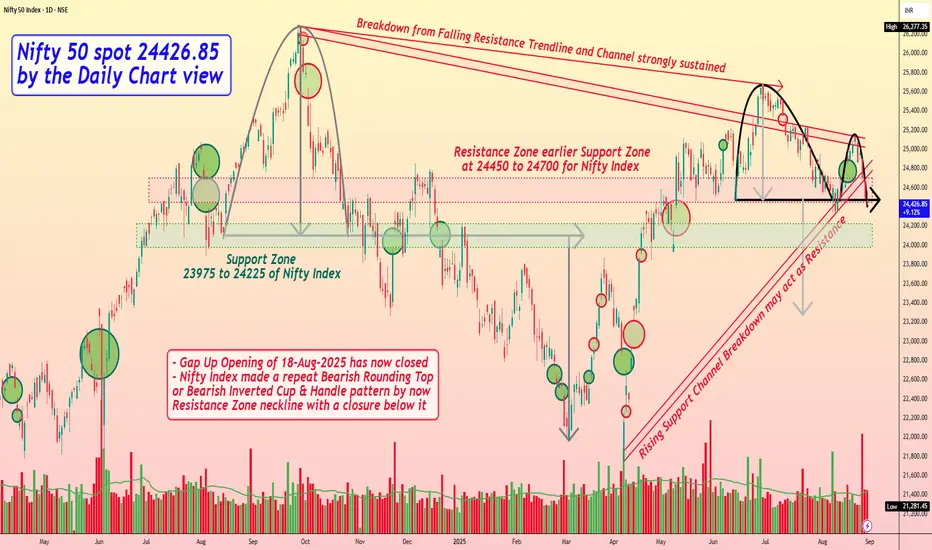
Nifty 50 spot 24426.85 by the Daily Chart view - Weekly updateNifty 50 spot 24426.85 by the Daily Chart view - Weekly update
- Support Zone 23975 to 24225 of Nifty Index
- Gap Up Opening of 18-Aug-2025 has now closed
- Resistance Zone earlier Support Zone at 24450 to 24700 for Nifty Index
- Rising Support Channel Breakdown may act as Resistance for upside move
- Breakdown from Falling Resistance Trendline and Channel has strongly sustained
- Nifty Index made a repeat Bearish Rounding Top or Bearish Inverted Cup & Handle pattern by now Resistance Zone neckline with a closure below it
Bearish Engulfing Pattern: Spotting Reversals with Discipline🔎 Intro / Overview
Managing a trade after entry is just as important as finding the right setup. The Bearish Engulfing is one of the most reliable candlestick patterns to spot potential reversals. When traded with discipline, it helps you recognize momentum shifts early and manage risk objectively.
📔 Concept
A Bearish Engulfing occurs when:
The first candle is a small green candle that continues the uptrend.
The next candle is a large red candle whose body completely engulfs the green candle’s body .
👉 This shows a clear psychological shift — buyers push higher (green candle), but sellers step in aggressively (red candle) and erase those gains.
📌 How to Use
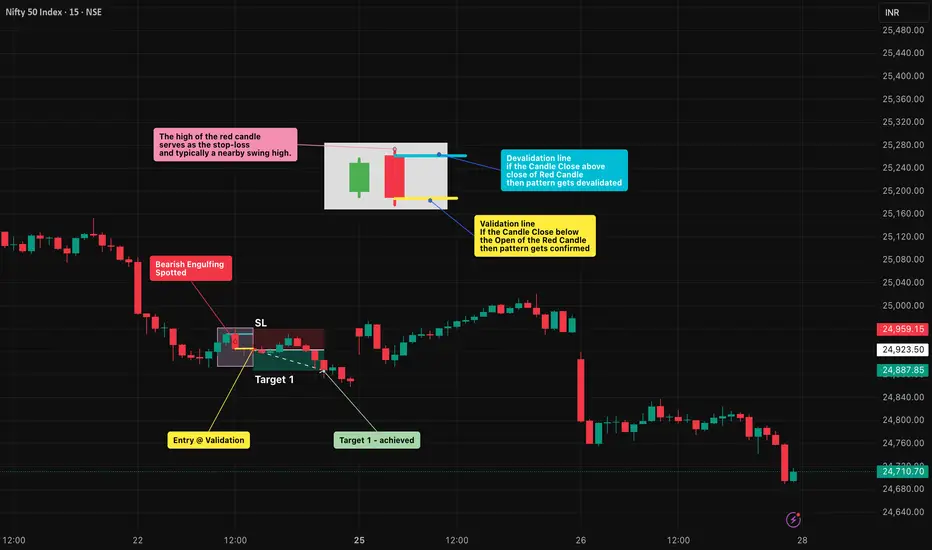
✅ Validation → The candle must close below the open of the red candle.
❌ Invalidation → If price closes above the close of the red candle before confirmation.
Trading Plan:
Entry → After confirmation of the red candle’s close.
Stop-Loss (SL) → Above the high of the red candle which is also a swing high.
Take-Profit (TP) :
Conservative → 1R (Entry → SL distance)
Moderate → 2R
Aggressive → Book partial at 1R and trail the rest using tools like ATR, Fibonacci levels, or structure-based stops to ride any extended downside move.
📊 Chart Explanation
On the chart, the first small green candle represents buyers continuing the uptrend. The next large red candle completely engulfs the green candle’s body and closes lower, signaling that sellers have taken control.
The pattern was validated at the close of the red candle , where the short entry was taken. The high of the red candle is used as the stop-loss level, while the targets are mirrored in reverse using the same distance.
In this example, Target 1 was quickly achieved . From there, traders can apply trailing stop methods to lock in profits and manage further downside targets.
👀 Observation
Works best when the pattern forms at major resistance levels or after a sustained uptrend .
A high-volume red candle strengthens the reliability of the signal.
In sideways or choppy conditions , false signals are common — always confirm with structure and indicators before acting.
❗ Why It Matters?
The green candle shows buyer optimism .
The red candle shows seller dominance .
This clear flip in control creates a rule-based setup with defined entry, SL, and TP.
🎯 Conclusion
The Bearish Engulfing is a strong sign of reversal — but it’s powerful only when combined with structure, confirmation, and disciplined risk management.
🔥 Patterns don’t predict. Rules protect.
⚠️ Disclaimer
For educational purposes only · Not SEBI registered · Not a buy/sell recommendation · No investment advice — purely a learning resource
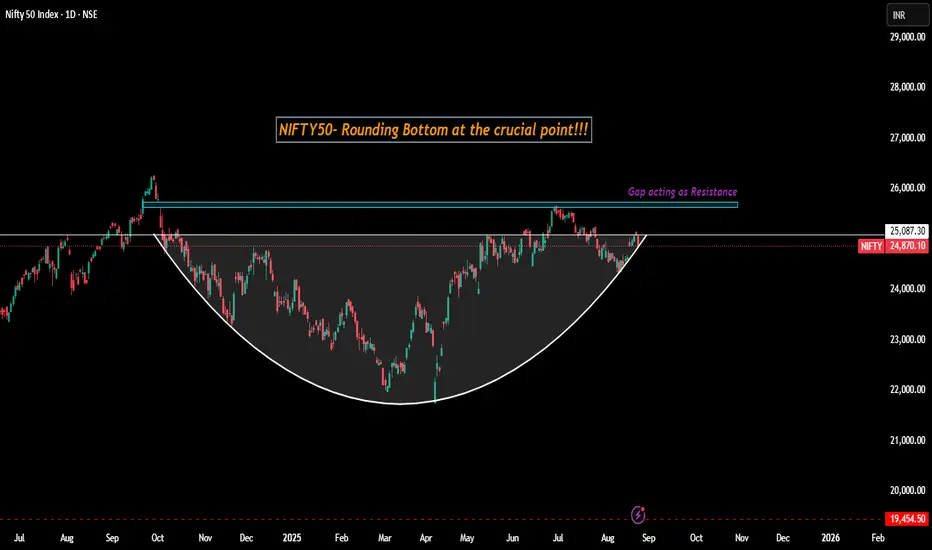
Nifty50 Rounding Bottom Pattern!!Yes!!!
Nifty has been trading inside the bearish range for the past 1 year giving nearly 0% return(from aug 24 to aug 25).At the same time, technically its been forming a Rounding Bottom and right now, pattern is at the crucial level.
If it breaks above as per pattern , it can be a volatile move...upwards!!!
Nothing much more to explain...just noticed the pattern and posted it...
Most of the traders are at the fearful stage on the Indian markets!!!(as most know on INDIA -US bitter relation after tariff, over valuation).
This scenario getting my mind through Warren buffet's famous quote below,
Be Greedy when others are Fearful !!!
Let's wait and watch!!
Just my view ...not a tip nor advice!!!!
Thank you!!!
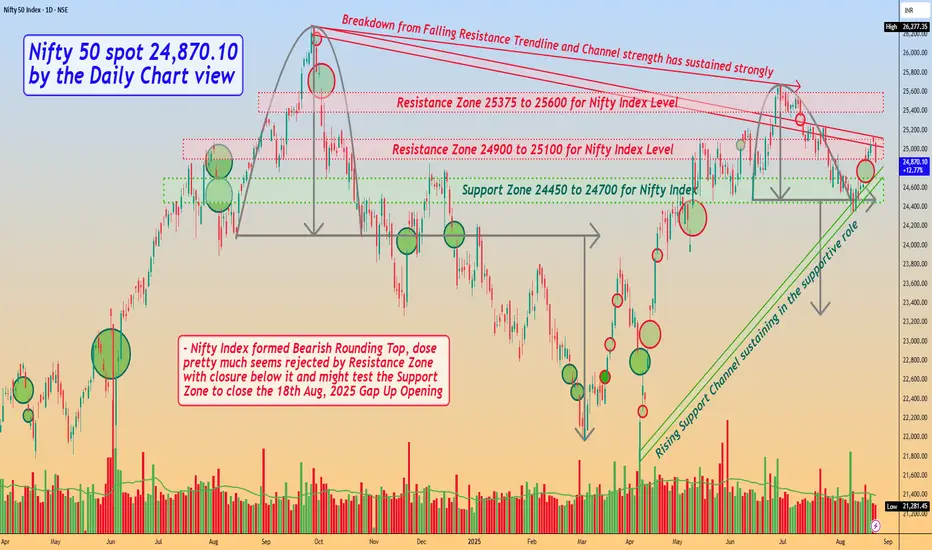
Nifty 50 spot 24,870.10 by the Daily Chart view - Weekly updateNifty 50 spot 24,870.10 by the Daily Chart view - Weekly update
- Support Zone 24450 to 24700 for Nifty Index
- Rising Support Channel sustaining in the supportive role
- Resistance Zone seen at 24900 to 25100 for Nifty Index Level
- Next Resistance Zone seen at 25375 to 25600 for Nifty Index Level
- Nifty Index formed Bearish Rounding Top, dose pretty much seems rejected by Resistance Zone with closure below it
- Basis Gap Up Opening done on 18th August, 2025, Nifty Index might just test Support Zone for closing Gap Up vacuum area
- Rest, let us HOPE FOR THE BEST TO HAPPEN, for the known fact that MARKETS ACT SUPREME ALL THE TIME, no matter what we propagate
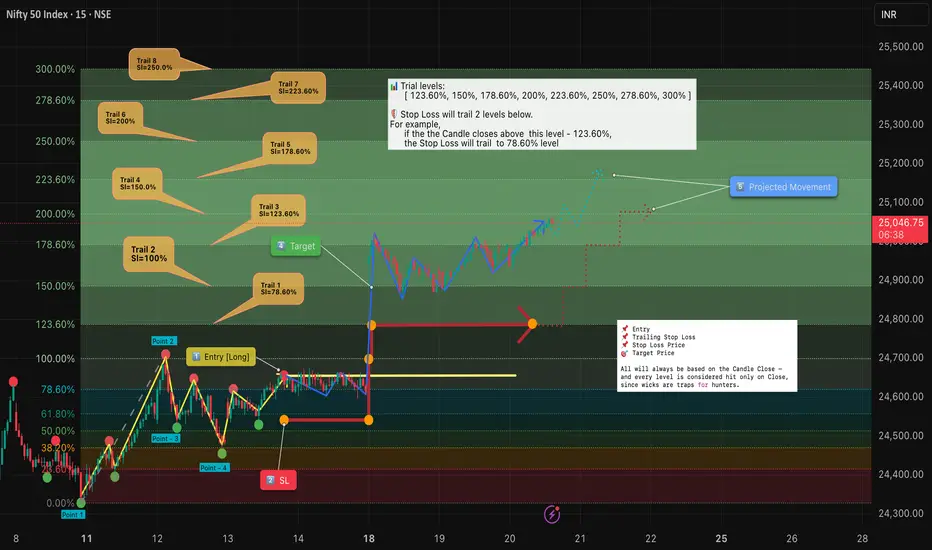
Trailing Stops: Protect Profits & Ride the Trend with Discipline🔹 Intro / Overview
Managing a position after entry is just as important as identifying the entry itself.
Here, we are specifically discussing trailing stops using Fibonacci retracements .
A well-structured trailing stop helps traders:
✅ Lock in profits
🛡️ Reduce risk
📊 Stay objective in the face of market noise
This idea shows how trailing stops can be applied in a structured way to complement Fibonacci retracements and trend management.
📖 Concept
📍 A trailing stop is a dynamic stop-loss that adjusts as price moves in your favor.
🔄 Instead of staying fixed, it “trails” price at a chosen distance — capturing more upside while capping downside.
🧩 Traders often trail stops using swing lows/highs, moving averages, or volatility measures like ATR .
📊 Chart Explanation (Step-by-Step)
1️⃣ Entry Criteria
✅ Successive closes above 78.6% confirm the long entry.
2️⃣ Stop Loss (SL)
📉 Placed at the previous swing low for structure-based protection.
⏩ SL adjustments move forward only with trailing rules — never backward.
3️⃣ Trailing Levels
👉 SL always trails two levels below the current trail level if the candle closes above it.
📈 Trail 1: 123.60% → SL moves to 78.60%
📈 Trail 2: 150.00% → SL moves to 100.00%
📈 Trail 3: 178.60% → SL moves to 123.60%
📈 Trail 4: 200.00% → SL moves to 150.00%
📈 Trail 5: 223.60% → SL moves to 178.60%
📈 Trail 6: 250.00% → SL moves to 200.00%
📈 Trail 7: 278.60% → SL moves to 223.60%
📈 Trail 8: 300.00% → SL moves to 250.00%
4️⃣ Target Points
🎯 At Target 1 , book one lot to secure profits.
📊 Remaining positions can be trailed further with the next levels.
5️⃣ Projected Path
🔍 Dotted blue/red projections illustrate potential movement under this trailing system.
🔍 Observations
📌 Objective Entry : Requires successive closes above 78.6%, reducing false signals.
🎯 Partial Profit Booking : Taking one lot off at Target 1 ensures realized gains.
🔄 Two-Level Trailing : Locks in profits while leaving room for trend continuation.
📊 Rule-Based Framework : Clear Fibonacci-based progression keeps decisions mechanical and consistent.
✨ Why It Matters
✔ Prevents turning winning trades into losers.
✔ Builds confidence by removing emotions from exit decisions.
✔ Lets profits run while maintaining protection.
✅ Conclusion
Trailing stops are not about perfection — they’re about discipline .
By systematically adjusting stops as the market moves, traders:
🛡️ Protect capital
🚀 Let profits run
🤝 Remove emotions from decision-making
When combined with Fibonacci retracements , trailing stops provide a structured framework to manage trades effectively after entry.
⚠️ Disclaimer : For educational purposes only · Not SEBI registered · Not a buy/sell recommendation · No investment advice — purely a learning resource
Nifty50 Intraday Rebound-Sets Eyes For Long 🔍 Key Observations:
✅ A fresh Buy label has printed after a series of lower lows — suggesting potential momentum shift.
🔴 Previous Sell cluster accurately marked the swing high near 25,145 zone.
⚪ Price is still trading below the 200 EMA, but attempting to reclaim short-term trendlines.
🟫 Minor Liquidity Box indicates supply pressure ahead, aligning with previous structure resistance.
📊 Risk-to-reward suggests the move could extend towards 25,145.35, if price holds above 24,707.
🎯 Setup Summary:
Bias: Cautiously bullish, short-term retracement within broader downtrend
Target Zone: 25,145 – matching previous support turned resistance
Invalidation: Below 24,647 where recent demand may fail
🧠 Educational Insight:
This setup highlights a classic counter-trend bounce from oversold levels, often seen when market participants begin profit-taking or short-covering. Momentum confirmation is crucial beyond the red zone to validate follow-through.
⏱ Timeframe:
15-Minute (Intraday)

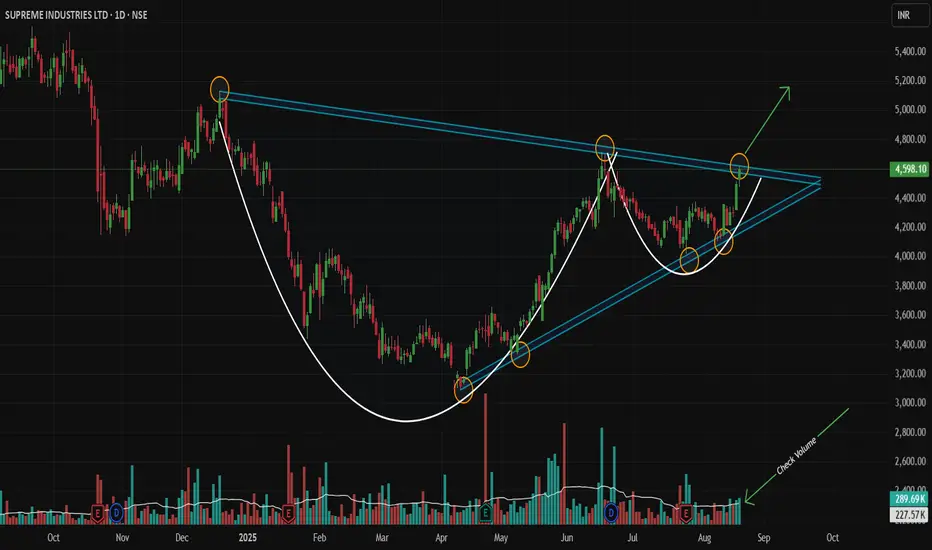
Nested Bullish Patterns Signal Major Breakout!Script: NSE:SUPREMEIND | Timeframe: Daily | Analysis Type: Technical (Pure Price Action) | Patterns: Symmetrical Triangle + Cup & Handle
Idea Summary 💡
A powerful, nested pattern setup is concluding on the daily chart! A large Symmetrical Triangle contains a secondary Cup and Handle (Bullish) pattern. This rare confluence signals strong accumulation and suggests an imminent, powerful upside breakout is likely!
Chart Pattern Logic 🔍
Primary Pattern (Symmetrical Triangle): Characterized by descending resistance (highs: Dec-18-2024, Jun-17-2025) and ascending support (lows: Apr-9-2025, May-9-2025, Jul-24-2025).
Secondary Pattern (Cup & Handle): Formed entirely within the triangle, adding a potent layer of bullish confirmation.
Confluence: This pattern-within-a-pattern setup significantly amplifies the potential for a strong upward resolution.
Trade Thesis 📈
Price is coiling at the triangle's apex under immense pressure. A decisive break above the upper trendline could ignite the next major bullish impulse phase.
Trade Setup ⚡
Direction: LONG 🟢
Entry Trigger: WAIT for a strong Marubozu green candle 🕯️ to close above the triangle's trendline on high volume (min. 1.5x average).
Stop Loss: Below the low of the breakout candle. 🛑
Profit Targets: 4700 🎯 | 4800 🎯 | 5125 🎯
Long-Term Target: 6000+ (Extended Target Based on Pattern Confluence & Momentum) 🚀
Risk Management: Trail stops aggressively after Target 1.
Got another stock you want me to break down? 📊
Drop the ticker in the comments below! If you found this idea useful, like and follow for more pure price action analysis.
Disclaimer: This post/information is solely for educational purposes and should not be construed as a recommendation or financial advice. Trading carries a risk of loss. Please conduct your own research or consult a financial advisor before making any investment decisions. The author and TradingView are not liable for any financial losses incurred based on this content.
M&M Short term Swing trade with 1:3.5 RRIf Nifty holds its current level of 24,600 and is not bearish for next two-three trading sessions then
there are high chances that this setup will work and buyers will take control in M&M.
It is a supply & demand + Trend + Liquidity Trap based setup.
The setup looks good but the only concern is the overall market sentiment so take your risk accordingly.
Good Risk to Reward for first Target is 1:3.5
Let me know if you have any questions or doubts.
Happy to help!
Gaurav.

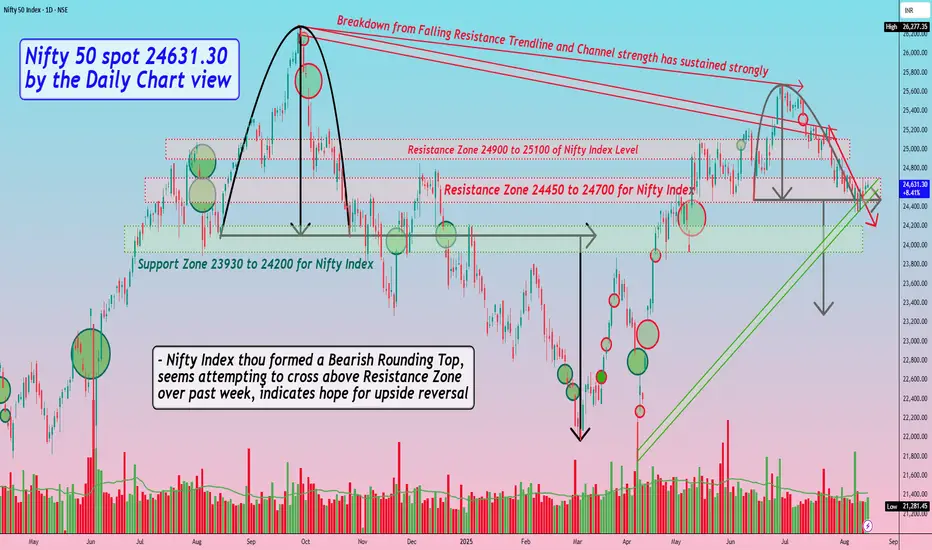
Nifty 50 spot 24631.30 by Daily Chart view - Weekly updateNifty 50 spot 24631.30 by Daily Chart view - Weekly update
- Support Zone 23930 to 24200 for Nifty Index
- Resistance Zone 24450 to 24700 for Nifty Index
- Breakout from above one of the Tiny Falling Resistance Trendline seems well sustained
- Rising Support Channel seems back in supportive role and maintained by current status of Nifty Chart setup
- Nifty Index thou formed a Bearish Rounding Top, seems attempting to cross above Resistance Zone over past week, indicates hope for upside reversal
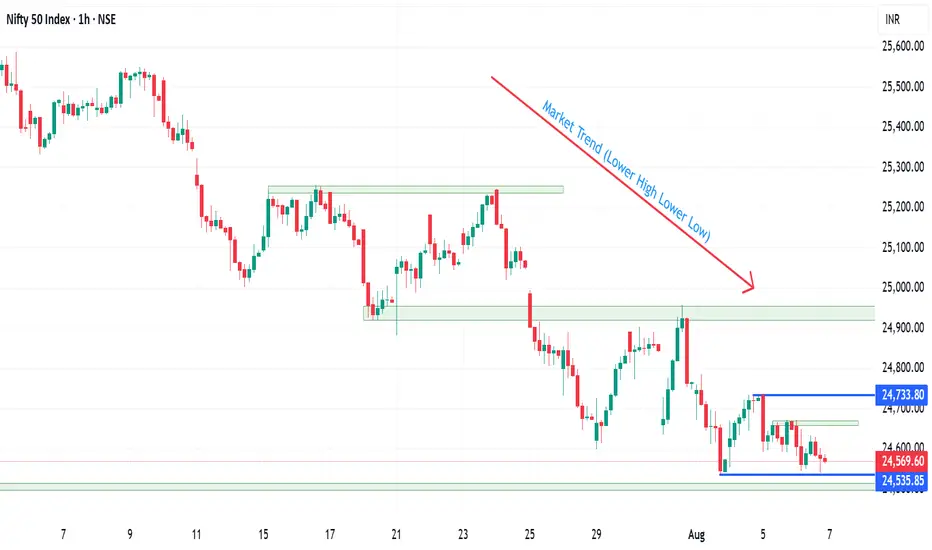
renderwithme | NIFTY-50 for the week of August 11–15, 2025The Nifty 50 index, a benchmark for the Indian stock market, is expected to exhibit cautious and potentially bearish behaviour for the week of August 11–15, 2025, based on recent market trends, technical analysis, and macroeconomic factors. Below is a detailed analysis for the upcoming week
# Current Market Context
Recent Performance: As of August 8, 2025, the Nifty 50 closed at 24,363.30, down 232.85 points (-0.95%), reflecting a bearish sentiment driven by foreign fund outflows and US-India tariff tensions. The index has been trading within a descending channel, characterised by lower highs and lower lows, indicating short-term weakness.
Technical Indicators:
Weekly Chart: A candle formed on the weekly chart, signalling market Bearish. Confirmation of this pattern could indicate further consolidation or a directional move.
Moving Averages: The Nifty is below its 21-day EMA, suggesting bearish momentum. The 5-day SMA and EMA are around 24,843.75 and 24,865.11, respectively, acting as resistance.
RSI and MACD: RSI is in the 35–40 range, indicating oversold conditions, which could signal a potential short-term bounce. MACD remains bearish, reflecting sustained selling pressure.
Pivot Levels: Key resistance is at 25,600–25,925, with immediate support at 23,250–23,400. A break below 23,200 could push the index toward its 200-day DMA (~23,900).
Market Sentiment: Sentiment is cautious due to:FII Outflows: Foreign Institutional Investors (FIIs) sold equities worth ₹4,997.19 crore on August 7, 2025, exerting downward pressure. Domestic Institutional Investors (DIIs) countered with ₹10,864.04 crore in buys, providing some support.
Global Cues: Mixed global market performance (e.g., NASDAQ down 2.24%, Dow Jones up 0.29% on August 4) and US tariff hikes on Indian imports are weighing on sentiment.
RBI Policy: The upcoming RBI policy decision could influence market direction, particularly if it addresses interest rates or liquidity measures.
Nifty 50 Forecast for Next Week (August 11–15, 2025)Based on available data, here’s the forecast for the week:Key Levels to WatchSupport Levels: 23,200, 23,500, (200-DMA). If A weekly candle break and close below 22,000 could accelerate selling toward 22,500.
Resistance Levels: 25,545–25,955. A sustained move above 25,900 could signal a potential reversal, with 26,000 as a critical psychological level.
Trend: Bearish with support at 24,200 critical. A positive global cue (e.g., GIFT Nifty up 0.36% on August 4) could support a modest recovery.
#Technical Outlook
- Bearish Scenario: If the Nifty fails to hold 23,200, it could slide toward 22,900 or lower, aligning with the 200-DMA. The inverse head-and-shoulders pattern on the weekly chart suggests a potential base at 22,900, but confirmation is pending.
- Bullish Scenario: A break above 24,600 could trigger a short-term rally toward 24,925–25,045. Sustaining above 25,000 may push the index toward 25,250, potentially signaling a trend reversal.
Indicators: Oversold RSI (35–40) suggests a possible bounce, but bearish MACD and selling volume indicate caution. Traders should monitor for a bullish crossover in MACD or RSI moving above 50 for confirmation of upward momentum.
Key Factors to WatchGlobal Markets: Movements in major indices like NASDAQ, Dow Jones, and FTSE will influence Nifty’s direction. Positive cues from GIFT Nifty (24,685 on August 4) could support a recovery.
FII/DII Activity: Continued FII selling could pressure the index, while DII buying may limit downside.
RBI Policy: Any dovish signals or liquidity measures could boost sentiment.
Sector Performance: Banking, IT, and energy sectors are critical. Stocks like SBI, Bharti Airtel, and Tata Motors may drive index movements.
Geopolitical and Tariff Issues: US-India trade tensions could cap upside potential.
Monitor volume and global cues for intraday trades.
Long-Term Investors:Current valuations near 23,200–23,400 are attractive for quality stocks. Accumulate fundamentally strong Nifty constituents (e.g., HDFC Bank, Reliance) on dips.
Use oversold conditions as an entry point for long-term portfolios, but diversify to mitigate volatility risks.
Critical PerspectiveWhile the sources provide detailed technical levels and predictions, they rely heavily on historical patterns and short-term indicators, which may not account for sudden macroeconomic shifts or black-swan events. The bearish bias is driven by FII outflows and tariff concerns, but DII support and potential RBI interventions could stabilize the market. Predictions like those from (e.g., Min: 22,200, Max: 26,240) show wide ranges, reflecting uncertainty and volatility. Investors should question overly precise forecasts and focus on broader trends, such as the index’s proximity to the 200-DMA and global market correlations.
ConclusionThe Nifty 50 is likely to remain range-bound between 23,900 and 24,925 next week, with a bearish bias unless it breaks above 24,600. Key supports at 24,200–24,000 and resistance at 24,600–25,045 will dictate short-term movements. Traders should stay cautious, monitor global cues, and prioritise risk management, while long-term investors may find opportunities in oversold conditions. Always verify critical information and consult a financial advisor before making decisions.
Chart for your Reference Only
~~ Disclaimer ~~
This analysis is based on recent technical data and market sentiment from web sources. It is for informational \ educational purposes only and not financial advice. Trading involves high risks, and past performance does not guarantee future results. Always conduct your own research or consult a SEBI-registered advisor before trading.
# Boost and comment will be highly appreciated.
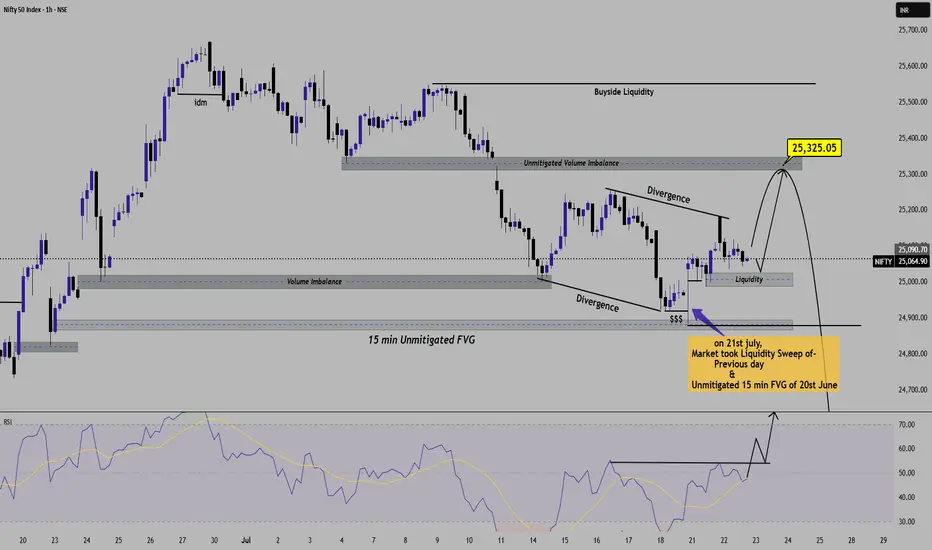
Nifty50 AnalysisShort term Nifty 50 Technical Outlook is Bullish towards 25300 levels.
Nifty50 -- 1h Timeframe
nifty current close -- 25060
Short term Outlook -- Bullish towards 25300 Volume Imbalance zone.
Key Observation --
1. Liquidity sweep & FVG Mitigation
--on 21st june,Price has swept previous day's low liquidity.
--Also tapped the unmitigated 15 min FVg zone of 20th june which helped for strong upside reaction.
2. Bullish RSI Divergence
-- Clear bullish divergence seen both in price and RSI, which confirms trend change.
3. Volume Imbalance zone
-- Price is going towards unmitigated Volume Imbalance and Liquidity zone of 25300 25350 levels.
-- Clear buy-side Liquidity is resting near 25300 levels which may act as strong resistance levels.
Main Target ---25300-25325 (Buyside Liquidity zone.)
If price fails to support below 24920, then setup gets invalid.
Longer term Outlook ---- (After short term 25300 levels done)
-- Price to reject upside move above 25400 levels and give downside view.
-- Confirmation to be with Market structure shift and Imbalance.
-- lONG-term Is again 24400-24000 levels to be seen after 1st target 25300 liquidity is taken.
Your views or comments are most welcome.
Disclaimer -- This idea is published only for an Education purpose. I'm not SEBI Registered Research Analyst.
Do not consider it as any investment idea.
Consult your financial advisor before investments.
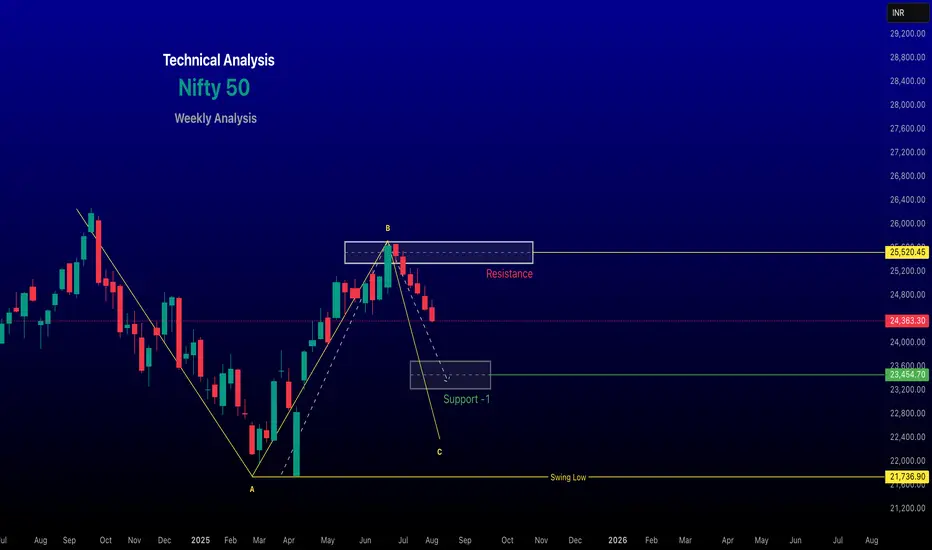
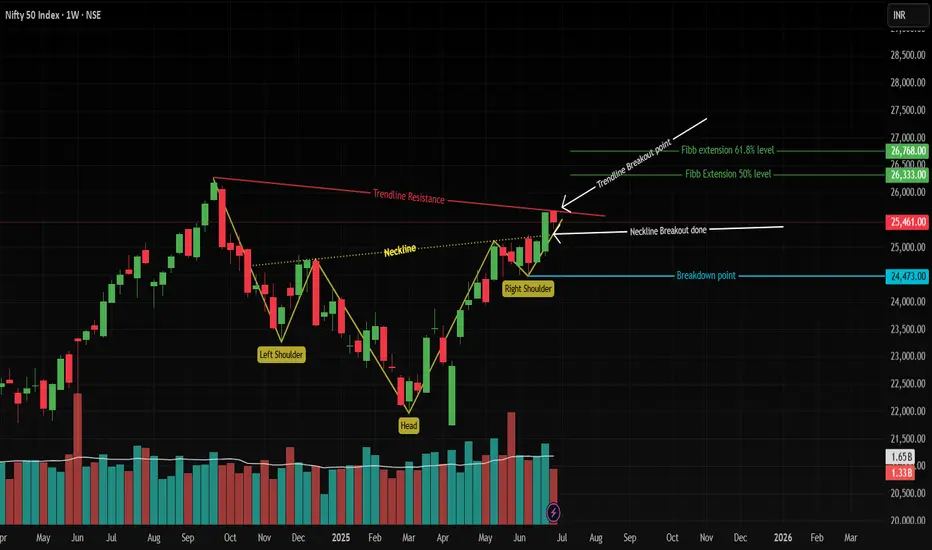
Nifty 50 Weekly: Inverted H&S Breakout Confirmation Awaited!Pattern & Breakout:
Inverted Head & Shoulders formed on the weekly chart (bullish reversal pattern). ✅
Neckline breakout occurred last week, but confirmation pending! This week failed to close above breakout level.
Confluence Alert: Weekly close above breakout level = Trendline resistance (red) breakout! 🚀
Targets (If Confirmed):
50% Fib extension: 26,333 📈
61.8% Fib extension: 26,768 🎯
(Fib drawn from 3rd March 2025 swing)
Key Invalidation:
Right Shoulder Low: 24,473 (blue line). Break below = pattern failed! ⚠️
Action Plan:
Wait for weekly close ABOVE neckline breakout.
Enter longs on confirmation (targets: 26,333 → 26,768).
Stop loss: Below 24,473.
Disclaimer:
This analysis is for educational purposes only. Trade at your own risk. Past performance isn’t indicative of future results. Always conduct your own research or consult a financial advisor. 📉💰
Boost visibility: 👍 Like | 💬 Comment | 🔔 Follow
Nifty - Elliot Waves Counts - LongLooking for bottom everyday, as broader markets indicating one more high.
Aligning Nifty counts with broader markets - We have an ABC with C ending in an ED - If it has to turn and head up to another high, this is the time.
Wait for one green day for confirmation.
Level at which view goes wrong - If 24320 breaks on the downside.
All the best!
Expecting a nice move on Nifty weekly expiry 07/08/2025.Nifty for the last three days is forming an inside candle, chances of it moving either side is high.
If the market starts trading below 24510, it may test the pervious support around 24230 and another levels below it.
On the higher side, trade can only be initiated only once 24650 levels are taken out.
In case of a gap down wait for the retest of the support zone that will act as the resistance now. Enter trade only once the setup triggers.
Major resistance levels :- 24660, 24733
Support levels :- 24500 (psycological level), 24228
Hourly Moving averages are above the closing price while the Daily 100 EMA is around the closing leves, which can act as the support else it can come to test the 200 EMA (24200).
Wait for the price action near the levels before entering the market.
Nifty - Elliot Waves - Short term Long TradeIn immediate short term - We had a leg up in Nifty (1 or A), followed by a pullback in what it seems like an abc.
c=0.618 of a is at 23480, where 0.786 retracement of 1/A also lies. Hence, if this holds, we get at least one more leg up to 24900.
It's a good RR for ling. All the best!

Nifty 50 in Range Ahead of RBI Decision – Watch 24,780 & 24,530 Nifty 50 is currently trading in a tight range between 24,780 and 24,530, with the market awaiting the RBI rate cut decision, which is due in the next few minutes.
If the RBI announces a rate cut, we may see a short-term recovery or bounce within this range. However, if rates remain unchanged or commentary stays neutral/hawkish, the prevailing downtrend is likely to continue.
Key Levels to Watch:
🔼 Resistance: 24,780
🔻 Support: 24,530
🕒 Event Risk: RBI Policy Decision (Due Shortly)
📌 Bias: Neutral to Bearish – Recovery possible only on rate cut, else downside pressure may resume.
#Nifty50 #RBIPolicy #IndianStockMarket #TechnicalAnalysis #PriceAction #LiveMarket #TrueDirections1

Is that an ending diagonal?Can you spot an ending diagonal trying to finish the ABC Zigzag move? If correctly labelled, Nifty may again see a fresh low.
**This is an educational market outlook, not investment advice. Please consult a SEBI-registered advisor before taking any investment decisions.**
Nifty - Elliot Wave Counts - Update (Neutral)In our last post we discussed that in short term 25700 is the target and if we cross that, then Leading diagonal gets invalidated and hence we look for much higher levels.
Last post:
Thankfully, we didn't get out in shakeouts and rode the entire move till +25600
Now, unfortunately we did not cross 25700 and hence the chance of Wave 1 or something else ending at 25670 became stronger.
As of now, we are at a place where there is a lot of confusion. I see a 5th up pending in wider indices, but Nifty seems done.
So, is there a possibility that other indices go up, while Nifty just does a pullback as part of the correction and not make a new swing high?
A few charts for reference:
Nifty Smallcap:
Nifty 500:
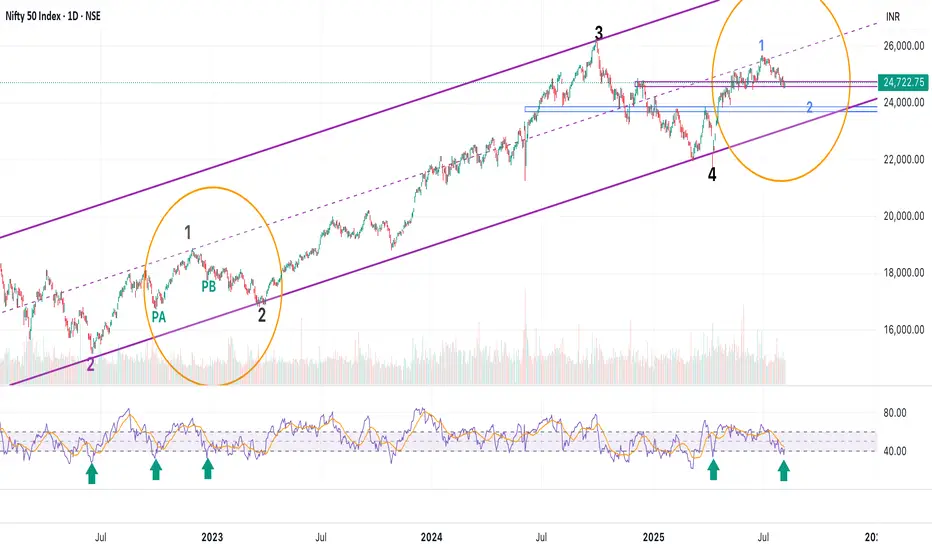
That's about the counts : From other technicals perspective the move looks very similar to Sep 2022 - March 2023 period. But where in that period are we?
PA (point A)Oct 2022 - where one more high till Dec 2022 is left?
or
PB - Feb 2023 - where we just get a pullback and drift lower?
(I have marked green arrows on RSI charts to show the reference)
So, what do we do in such case?
Ditch nifty, play stocks. Lot of stocks looking good - starting 5th up (Just browse through and you'll find many making similar structure as SmallCap index)
(Hint - Defence, Realty, Autos, Metals, Pharma)
All the best!
I will share updates, if I get more clarity on Nifty - till then enjoy the stocks and trade light - remember we are playing seemingly the last leg. :)
Is Nifty 50 going down and down?What seems to be impulse wave 3, Nifty may see more downfall in the coming week. However, for an alternative count, we may also be in a wave C. But for either scenario, we can observe more downward movement ahead.

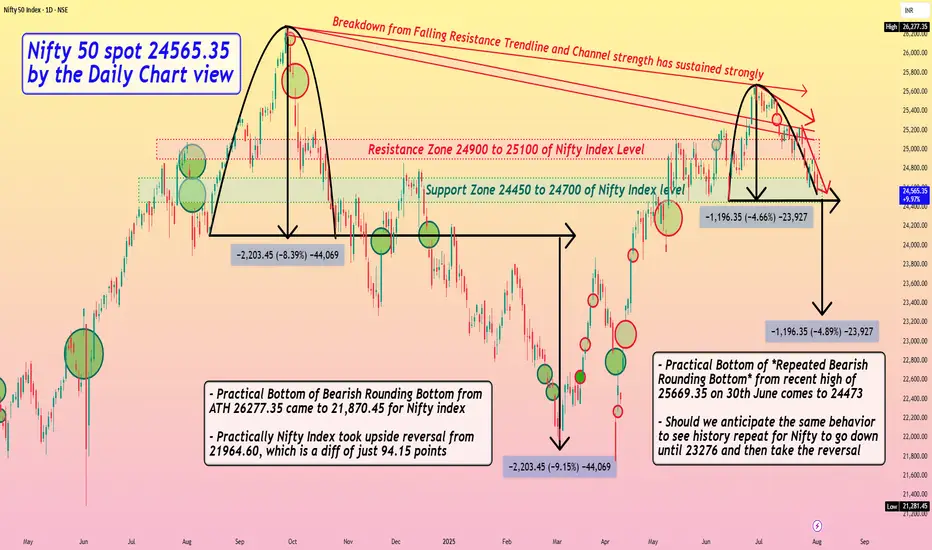
Nifty 50 spot 24565.35 by the Daily Chart view - Weekly update*Nifty 50 spot 24565.35 by the Daily Chart view - Weekly update*
- Resistance Zone 24900 to 25100 of Nifty Index Level
- Support Zone 24450 to 24700 of Nifty Index level still seen sustained
- Bearish Rounding Bottom after ATH level seen repeated at current week closure
- Practical Bottom of *Bearish Rounding Bottom* from ATH 26277.35 came to 21,870.45 for Nifty index
- Practically Nifty 50 Index later took an upside reversal from 21964.60, which is a diff of just 94.15 points
- Practical Bottom of *Repeated Bearish Rounding Bottom* from recent high of 25669.35 on 30th June comes to 24473
- Should we anticipate the same behavior to see history repeat for Nifty to go down until 23276 and then take the reversal