GAIL Bullish way ahead?!!!Chart patterns suggest me the above titled opinion
1. Its is travelling in a Ascending channel pattern making Higher highs and higher lows .
2. Now it is at the bottom support loading for the explosive move ahead.
3. Let's wait for the Breakout and enter.
Target levels mentioned in chart...SL update after breakout.
Longer time frames also shows the bullish edge in GAIL
This is just my opinion..... not a tip nor advice!!!!
Thank you!!!
Nifty50

Nifty 50 at a Critical Juncture – Breakdown or Bounce Ahead?Technical Overview – Trendline Test in Action
After breaking out of a well-defined falling wedge pattern in April 2025, the Nifty 50 had been respecting an ascending support trendline, offering steady higher lows and consistent bullish structure.
However, in the most recent session, price closed just below this key trendline at 24,926.80, with volume slightly elevated — a signal that the bulls are losing control unless support is reclaimed quickly.
Key Technical Levels
Immediate Resistance: 25,100–25,250
Trendline Support (Broken): ~24,950
Major Demand Zone: 24,300–24,600
Critical Breakdown Level: 24,850
Options Chain Snapshot – What Smart Money Is Signaling
Expiry: 31st July 2025
Spot: 24,935.50
Futures: 24,956.50
🔸 Call Writers in Control
Significant OI at 25,000 CE (140.7K) and 24,950 CE (38K)
Call unwinding seen from 24,700 to 25,200, suggesting profit booking or reduced bullish conviction
IVs remain compressed across ATM and OTM calls → calm surface, but pressure building
🔹 Put Writers Still Active
24,900 PE (101K OI, +59.5K) and 25,000 PE (143K OI, +40.9K) are heavily defended
PCR remains above 1 for 24,950–25,000 zone → put writers betting on expiry support
Rising OI at 24,800 PE (84K) also shows growing downside hedges
Data vs. Price – A Divergence Worth Watching
While options data suggests bulls are trying to defend 24,900–25,000 with heavy put writing, price action tells a different story. A clean break of the trendline and a lower daily close below 24,850 would shift momentum in favor of the bears.
📉 Breakdown Confirmation:
Sustained move below 24,850
Rising call OI at 25,000+
Unwinding of 24,900 PE and 24,800 PE
Pickup in IV and red candle with volume
Strategy Ideas (Educational Purpose Only)
🟩 Bullish Scenario
Bias: Long above trendline reclaim
Entry: On breakout above 25,050
Stop Loss: Below 24,850
Target: 25,300 and then 25,500
🟥 Bearish Scenario
Bias: Short below confirmed breakdown
Entry: Below 24,850
Stop Loss: Above 25,050
Target: 24,600, possibly extending to 24,300
🟨 Neutral / Non-Directional View
Bias: Range-bound / IV crush play
Strategy: Short Straddle using 24,950 CE + 24,950 PE
Hedge Zone: Manage risk beyond ±150 points
Goal: Capture premium decay as expiry nears
🧭 Conclusion – Prepare, Don’t Predict
The Nifty 50 is sitting at a crucial inflection point — where structure meets sentiment. While option writers continue to show faith in the 24,900–25,000 zone, a clean break below the recent support could trigger swift downside toward the 24,400 zone.
In times like these, reacting to confirmation is smarter than pre-empting moves. Watch price, volume, and open interest shifts closely in the coming sessions.

Sbilife Getting ready for the rally ahead?!!!Chart patterns suggest me the above titled opinion
1. Weekly time frame shows a three white soldiers (month of april 2025) with good volume support....now the consolidation happening
2. In daily time frame, it is travelling in a expanding channel pattern , currently at the support line at the bottom
3. We need a confirmation for the rally with a Breakout candle....which we can expect during the result release.
4.If we make our entry now, we can make our stoploss as daily candle close out of the channel
5. Best entry is to wait for the Breakout and enter with SL below the breakout candle
6.Target levels as mentioned in the chart.
With strong fundamentals and decent valuations, Sbilife is one of the best options for long term bet in the insurance sector!!!
This is just my opinion ....not a tip nor advice..
Thank you!!!!

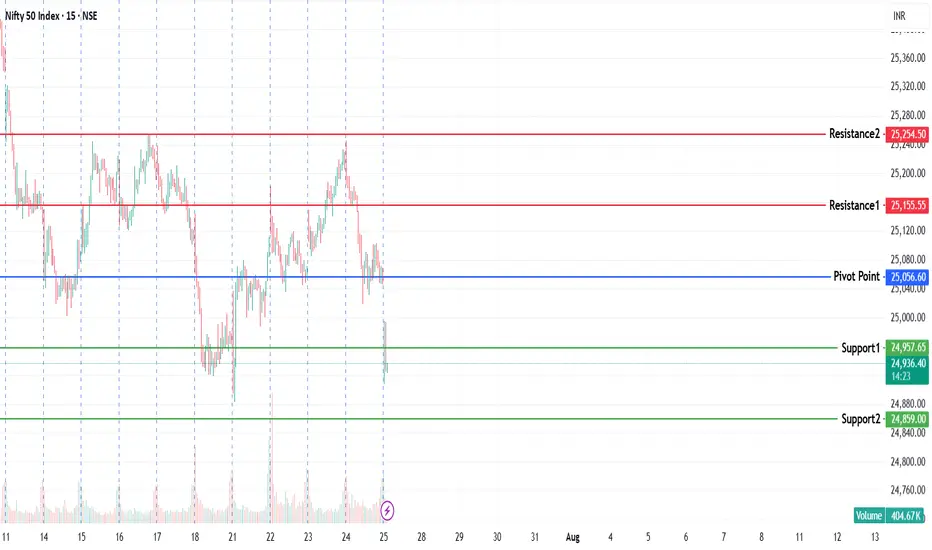
NIFTY KEY LEVELS FOR 25.07.2025NIFTY KEY LEVELS FOR 25.07.2025
If the candle stays above the pivot point, it is considered a bullish bias; if it remains below, it indicates a bearish bias. Price may reverse near Resistance 1 or Support 1. If it moves further, the next potential reversal zone is near Resistance 2 or Support 2. If these levels are also broken, we can expect the trend.
If the range is narrow, the market may become volatile or trend strongly. If the range is wide, the market is more likely to remain sideways
📢 Disclaimer
I am not a SEBI-registered financial adviser.
The information, views, and ideas shared here are purely for educational and informational purposes only. They are not intended as investment advice or a recommendation to buy, sell, or hold any financial instruments.
Please consult with your SEBI-registered financial advisor before making any trading or investment decisions.
Trading and investing in the stock market involves risk, and you should do your own research and analysis. You are solely responsible for any decisions made based on this research.
Nifty50 Trend Analysis Daily TFNifty 50 is currently in a corrective phase, forming wave 4 on the daily time frame. Given the long-term bullish outlook of the market, wave 4 is expected to be a shallow correction, potentially ending around 24,821 or 24,311. A deep correction down to 23,898 is also possible, but the probability of this is low—around 10%, unless wave 5 becomes trapped in a complex triple-three corrective pattern.
The direction of Nifty 50 is strongly correlated with Reliance Industries' price movement. If Reliance fails to reverse from the ₹1,373 level, it may drop further to ₹1,332. In that case, Nifty 50 is unlikely to regain bullish momentum and may continue to consolidate sideways until Reliance completes its correction.
Key Levels to Watch:
Nifty 50: 24,821 (shallow correction), 24,311 (support), 23,898 (deep correction - low probability)
Reliance Industries: ₹1,373 (key support), ₹1,332 (deep correction level)
A strong bullish rally in the broader market is likely only if Nifty 50 finds support around 24,821 and Reliance reverses from ₹1,373.

Trading Master Class With Experts🔰 Introduction
In today’s fast-moving financial markets, trading has evolved from basic buying and selling to data-driven strategies, advanced analysis, and systematic execution. A Trading Master Class With Experts is not just another course—it’s a comprehensive mentorship program that bridges the gap between beginner-level knowledge and professional-level performance.
This class is designed for those who are serious about trading as a skill, business, or career, and who want to learn directly from experienced traders, analysts, and market strategists. The program focuses on real-time learning, practical strategies, market psychology, and risk management, giving participants the tools to trade confidently and consistently.
🎯 Objective of the Master Class
The primary goal of the Trading Master Class With Experts is to transform retail traders into independent, strategy-based professionals. It’s structured to help you:
Understand how markets really work
Learn proven strategies from professional traders
Avoid common beginner mistakes
Build and test your own trading system
Develop the mindset and discipline of institutional-level traders
🧠 What You Will Learn
This master class covers a holistic approach to trading with a strong focus on practical execution, including:
🔍 1. Market Basics & Trader Foundation
How stock markets work
Key players: Retail vs Institutions
Types of markets: Bullish, Bearish, Sideways
Trading styles: Intraday, Swing, Positional, Scalping
Asset types: Equity, Derivatives, Forex, Crypto, Commodities
🕯️ 2. Technical Analysis
Reading and analyzing candlestick patterns
Support and Resistance theory
Trend identification and trendline accuracy
Price Action-based entry and exit techniques
Volume analysis and institutional behavior spotting
📊 3. Indicators and Tools
Moving Averages (SMA, EMA)
RSI, MACD, Bollinger Bands, Supertrend
Fibonacci retracement and projection
Volume Profile and VWAP
How to avoid indicator overloading
🧱 4. Chart Patterns & Setups
Reversal patterns: Double Top/Bottom, Head and Shoulders
Continuation patterns: Flags, Pennants, Triangles
Breakout trading vs Pullback trading
Building entry/exit rules with confirmation signals
🧮 5. Options and Futures Trading (Optional Module)
Understanding Calls and Puts
Option chain analysis and Open Interest
Option Greeks (Delta, Theta, Vega, Gamma)
Directional vs Non-directional option strategies
Institutional Option Trading Techniques
💹 6. Risk Management
Capital allocation methods
Risk-to-reward ratio and win-rate planning
Stop-loss and trailing stop methods
Diversification and exposure control
Avoiding overtrading and emotional decisions
🧘 7. Trading Psychology & Discipline
How to handle losses without fear
Dealing with greed and overconfidence
Mindset of a consistent trader
Journaling, post-trade analysis, and routine building
💻 8. Live Trading & Practical Learning
Real-time market sessions with expert commentary
Watching experts plan, execute, and review trades
Hands-on assignments and trade simulations
Market opening/closing routines
Building your personal trading plan
🔧 Advanced Topics (for Experienced Traders)
Institutional Trading Strategies
Smart Money Concepts
Volume Spread Analysis (VSA)
Multi-leg Option Strategies
Algo-trading basics (optional)
Trading Journals and performance analysis tools
👨🏫 Who Are the Experts?
This master class is conducted by a team of seasoned professionals:
Full-time traders with 10+ years of market experience
Certified technical analysts and SEBI-registered mentors
Option strategists and quantitative traders
Risk managers and trading psychologists
They provide you with:
Live mentorship
Real trade breakdowns
Direct Q&A sessions
Feedback on your trading plans
👥 Who Should Join This Master Class?
This program is ideal for:
Aspiring traders who want to start with clarity
Traders stuck at breakeven or in losses
Professionals looking to become part-time traders
Students or working individuals with serious interest in trading
Anyone who wants to trade like an institution, not a gambler
📜 Certification & Support
Upon completion, you will receive:
A certificate of participation
Access to recorded sessions
A trading toolkit: Checklists, planners, and journals
Lifetime access to community/mentorship group
🧭 Final Words
A Trading Master Class With Experts is not about shortcuts or tips. It’s a structured pathway to build you into a professional-level trader who understands risk, follows a system, and survives long-term.
Markets will always test you—but this master class gives you the skills, mindset, and mentorship to pass every test with confidence.

Advance Option TradingKey Concepts in Advanced Options Trading
Multi-Leg Strategies:
Advanced options trading heavily involves multi-leg strategies — using two or more options contracts in a single trade. Popular ones include:
Iron Condor: A neutral strategy involving four different options contracts to profit from low volatility. It generates a limited profit if the stock remains within a specific range.
Straddles and Strangles: Used when expecting a large price move, but unsure of the direction. Traders buy both a call and a put option.
Butterfly Spreads: These limit both risk and reward and are ideal when the trader believes the stock will stay near a specific price.
Adjustments and Rolling:
Unlike basic options traders who may let contracts expire, advanced traders constantly adjust positions. For example, if a trade moves against them, they may "roll" the position — closing it and reopening another at a different strike or expiry.
Understanding Option Greeks:
Advanced traders don’t just bet on direction; they manage exposure to:
Delta (Direction)
Gamma (Rate of change of delta)
Theta (Time decay)
Vega (Volatility sensitivity)
Rho (Interest rate impact)
This helps in building more calculated, data-driven trades.
Volatility Trading:
Volatility is key in advanced options. Some traders look to exploit Implied Volatility (IV) — pricing of future volatility — by trading IV crush around earnings or economic events. For instance, an Iron Condor may be used when IV is high, aiming to profit from the IV drop.
Directional vs. Non-Directional Trading:
Advanced traders often prefer non-directional strategies. These are setups where you can make money even if the market goes sideways, such as with Iron Condors or Calendar Spreads.
Risks in Advanced Options Trading
While the rewards can be higher, so are the risks. Complex strategies can lead to significant losses if misunderstood. Margin requirements can be high, and some trades may have unlimited loss potential (e.g., uncovered calls). Hence, strict risk management, stop-loss rules, and position sizing are essential.
Final Thoughts
Advanced options trading is not for beginners, but for those who want to move beyond simply guessing market direction. It’s about constructing trades that work in various market conditions — bullish, bearish, or sideways — and using volatility and time as weapons. With the right knowledge and discipline, advanced options can become a powerful tool in any trader’s arsenal. However, success requires education, continuous learning, and a clear understanding of risk and reward

Demand & Supply Price Action Play – CMSINFO Price Structure & Market Context
CMSINFO’s recent price action has followed a textbook path, respecting clean structural levels driven by institutional order flow. It's one of those charts where the zones aren’t just technical—they're telling a story. And right now, that story is setting up a potentially meaningful long opportunity.
💡 Daily Timeframe – Big Picture Bias
The daily chart remains resolutely bullish . We're still seeing that healthy rhythm of higher highs and higher lows , signaling that the uptrend is very much intact.
📍 Daily Supply Zone: ₹540 – ₹546
That said, price did face some resistance recently—right where we’d expect it to. A fresh supply zone Rally Base Drop around ₹540–₹546 served up a rejection and sparked the current pullback. Nothing unusual there. In fact, in strong trends, these kinds of pullbacks often offer the best risk-adjusted entries —as long as we’re positioned at the right zones.
⏱️ 125-Minute Timeframe – Precision Entry Layer
Zooming into the 125-minute chart gives us a much clearer map for potential execution.
🟢 Demand Zone: Rally Base Rally ₹500 – ₹498
Here’s where things get interesting. This demand zone hasn’t been touched since it formed—making it a fresh zone , and by definition, high-probability for a first bounce. Price has just tapped into it, which could attract short-term buyers looking to ride the next leg up.
🔴 Supply Zone: Rally Base Drop ₹532 – ₹537
This zone sits just overhead and marks the first potential resistance . If price moves up from the current demand area, this is where traders may begin trimming positions or tightening stops.
🎯 Trade Blueprint 🎯
Entry: Between ₹500 – ₹498 (inside 125-minute demand zone)
Stop Loss: Below ₹498 (conservative buffer: ₹495)
Target 1: ₹532 – ₹537 (nearest 125min supply)
🧩 Why This Setup Deserves Attention 🧩
Daily Trend Structure Remains Bullish – higher timeframe bias supports a continuation upward.
Fresh LTF Demand Zone – first touch makes this zone statistically favorable.
Defined Risk-Reward Parameters – tight stop with layered targets for flexible management.
Pure Price Action Logic – just clean, institutional footprints.
🚀 “Opportunities don’t come from chasing— they come from waiting in the right places.” 💡 Stay patient, respect your zones, and let the market come to you.
This analysis is purely for educational purposes and does not constitute a trading or investment recommendation. I am not a SEBI registered analyst.
Lastly, thank you for your support, your likes & comments. Feel free to ask if you have questions.

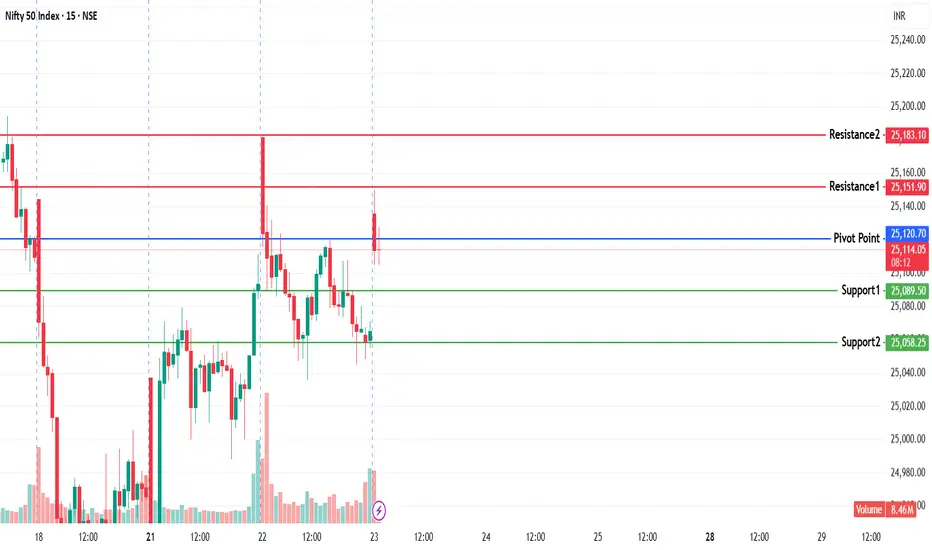
NIFTY KEY LEVELS FOR 23.07.2025NIFTY KEY LEVELS FOR 23.07.2025
If the candle stays above the pivot point, it is considered a bullish bias; if it remains below, it indicates a bearish bias. Price may reverse near Resistance 1 or Support 1. If it moves further, the next potential reversal zone is near Resistance 2 or Support 2. If these levels are also broken, we can expect the trend.
If the range is narrow, the market may become volatile or trend strongly. If the range is wide, the market is more likely to remain sideways
📢 Disclaimer
I am not a SEBI-registered financial adviser.
The information, views, and ideas shared here are purely for educational and informational purposes only. They are not intended as investment advice or a recommendation to buy, sell, or hold any financial instruments.
Please consult with your SEBI-registered financial advisor before making any trading or investment decisions.
Trading and investing in the stock market involves risk, and you should do your own research and analysis. You are solely responsible for any decisions made based on this research.
Option Trading Advanced Strategies📌 Introduction: Why Go Beyond Basic Options?
Basic option strategies like buying calls or puts, or even covered calls, offer simplicity—but they don’t fully unlock the potential of options as a strategic tool.
When you enter the advanced territory, you gain the power to:
Profit in sideways markets
Neutralize directional risks
Create high-probability income
Minimize drawdowns
Take advantage of volatility shifts
Advanced strategies require you to understand multi-leg positions, greeks, risk/reward shaping, and market timing.
Let’s break it all down into clear, real-life explanations.
🧩 1. Iron Condor – Profit in Range-Bound Markets
🔍 What is it?
An Iron Condor involves selling a call spread and a put spread at the same time, expecting the stock/index to stay in a tight range.
🔧 Construction:
Sell 1 OTM Call
Buy 1 further OTM Call
Sell 1 OTM Put
Buy 1 further OTM Put
All with same expiry.
🎯 Ideal Market View:
Market is range-bound
You expect low volatility
No major event expected
💰 Max Profit:
Occurs when stock expires between the two short strikes
⚠️ Max Loss:
Happens when stock moves beyond outer strikes
✅ Why use it?
Generates monthly income
Defined risk
High probability if used smartly
⚖️ 2. Butterfly Spread – Profit from Precision
🔍 What is it?
The Butterfly Spread is a neutral strategy where the trader expects the stock to close near a specific price.
🔧 Construction (Call Butterfly):
Buy 1 ITM Call
Sell 2 ATM Calls
Buy 1 OTM Call
All with same expiry.
🎯 Ideal Market View:
You expect stock to move very little
Great for expiry day setups or low-volatility trades
💰 Max Profit:
When stock closes exactly at strike price of sold calls
⚠️ Max Loss:
When price moves significantly up or down
✅ Why use it?
Cheap entry cost
Controlled risk
Can return 200–300% with precise movement
🌀 3. Calendar Spread – Play on Time and Volatility
🔍 What is it?
A Calendar Spread profits from time decay and implied volatility expansion.
🔧 Construction:
Sell 1 Near-Term Option
Buy 1 Longer-Term Option
Same strike, same type (Call or Put)
🎯 Ideal Market View:
Expect stock to stay around strike price in short term
Expect volatility to increase
💰 Max Profit:
When the short-term option decays and stock remains near the strike
⚠️ Max Loss:
If stock makes a strong move or IV drops unexpectedly
✅ Why use it?
Good for earnings events
Plays time + volatility
Low capital strategy
💡 4. Ratio Spread – When You Want a Controlled Gamble
🔍 What is it?
A Ratio Spread involves selling more options than you buy (like buying 1 Call and selling 2 Calls). It’s directional but nuanced.
🔧 Construction (Call Ratio Spread):
Buy 1 ATM Call
Sell 2 OTM Calls
You can reverse for puts if bearish.
🎯 Ideal Market View:
Expect a mild bullish move, not a breakout
Moderate volatility
💰 Max Profit:
When stock closes near the short strike
⚠️ Max Risk:
If stock moves too much upward, losses can be unlimited (unless hedge is applied)
✅ Why use it?
High reward-to-risk if market behaves
Can be converted into a risk-free structure using debit/credit adjustments
🏹 5. Straddle and Strangle – Playing Big Moves
🔍 What is it?
Straddle and Strangle are volatility-based strategies.
Straddle = Buy Call + Buy Put at same strike
Strangle = Buy OTM Call + Buy OTM Put
🎯 Ideal Market View:
Expect a big move but unsure of direction
Perfect for events: earnings, budget, Fed announcements
💰 Max Profit:
When market makes a big move, either up or down
⚠️ Max Loss:
When market stays flat
✅ Why use it?
Useful before news or big breakout
Non-directional but aggressive
🧮 6. Delta-Neutral Trading – Profit Without Direction
🔍 What is it?
Delta-neutral trading aims to neutralize directional risk (delta = 0) using a combination of options and/or futures.
💡 Example:
Sell ATM Call + Buy underlying stock in proportion so total delta = 0
Or balance long and short options across strikes
🎯 Ideal Market View:
Expect volatility or time decay
No strong directional bias
✅ Benefits:
Income generation regardless of market direction
Hedged and flexible
🔁 7. Rolling Strategies – Actively Adjust for Profit
🔍 What is it?
Rolling means shifting an existing position to a new strike or expiry to manage risk or lock profit.
Use Cases:
Roll down puts in falling market
Roll up calls in bull trend
Roll to next expiry to extend time decay
✅ Benefits:
Dynamic control
Prevents stop-loss triggers
Protects profits in trending markets
🛑 Risk Management Tips for Advanced Traders
Always define max loss – Use spreads, not naked trades
Check IV before trading – High IV = sell premium; Low IV = buy premium
Position sizing – Never go all-in on a strategy
Use alerts and automation – Advanced strategies need fast reaction
Avoid illiquid options – Stick to Nifty, Bank Nifty, liquid stocks
Paper trade first – Test complex strategies without real money
📈 Real-Life Example – Iron Condor on Nifty
Let’s say Nifty is at 24,300 and expiry is 7 days away. You expect Nifty to stay between 24,000 and 24,600.
Trade Setup:
Sell 24,000 Put
Buy 23,800 Put
Sell 24,600 Call
Buy 24,800 Call
Net credit: ₹50–60
Max Profit: ₹50 if Nifty stays between 24K–24.6K
Max Loss: ₹150 if market breaks either side
This gives a 1:3 risk-reward with 70%–75% probability.
💬 Final Thoughts
Advanced option strategies aren’t about gambling—they’re about precision, hedging, and income generation with structure. They offer you more control than simple buying/selling.
But with more power comes more responsibility:
Know your market view
Know the structure of your strategy
Know when to adjust or exit
Once you understand how to read volatility, manage risk with Greeks, and construct defined-risk trades, options can become your most flexible and profitable tool in the market.
Bank Nifty and Nifty50 Scalping TechniquesWhat is Scalping in Index Trading?
Scalping is a high-frequency intraday trading style where a trader looks to capture small price movements multiple times throughout the day. In indices like Nifty50 and Bank Nifty, where price movement is fast and often sharp, scalping is a preferred strategy for many traders.
Scalpers don't aim to catch a ₹100 move. Even ₹20–₹30 on a Bank Nifty option, done 3–4 times a day with volume and discipline, can generate consistent returns.
Why Nifty50 & Bank Nifty for Scalping?
High Liquidity: Tight bid-ask spreads make it easier to enter and exit quickly.
Option Volatility: Options on these indices give quick 5–10% moves in minutes.
Trend & Momentum Friendly: These indices often move in clean intraday trends, giving plenty of scalping chances.
Institutional Interest: Nifty and Bank Nifty are tracked by institutions, so technical levels work well.
Tools Every Scalper Must Use
Before we dive into strategies, make sure you have these ready:
5-Minute / 3-Minute Candlestick Chart
VWAP (Volume Weighted Average Price)
CPR (Central Pivot Range)
Price Action Levels (Previous Day High/Low, Opening Range)
Option Chain Analysis (for OI build-up)
Volume & Momentum Indicators (e.g., RSI, MACD)
Top Scalping Techniques for Nifty & Bank Nifty
1. VWAP Bounce Strategy
Best Time: 9:30 AM to 11:00 AM or 1:30 PM to 3:00 PM
How it works:
Wait for price to test the VWAP line.
If trend is up, and price bounces from VWAP with a bullish candle → enter Call Option.
If trend is down, and price rejects VWAP with bearish candle → enter Put Option.
Entry: On confirmation candle after touching VWAP
Target: 15–25 points on option premium
Stop Loss: 5-minute candle close above/below VWAP
Why it works: Institutions use VWAP for entries; many intraday algos are VWAP-based.
2. CPR Breakout Scalping
Best Time: Opening hour or post-lunch (2:00 PM onwards)
How it works:
If the day’s CPR is narrow, expect trending moves.
Wait for a breakout above CPR high (for long) or below CPR low (for short).
Entry only after a strong 5-minute candle closes outside CPR.
Bonus Tip: Narrow CPR + gap-up = trend day; very scalper-friendly.
Targets: 1:1.5 or trailing stop loss
Risk: High if you trade before confirmation—wait for candle close.
3. Opening Range Breakout (ORB)
Best Time: 9:15 AM – 9:45 AM
How it works:
Mark high and low of first 15 minutes (Opening Range).
Wait for price to break above high or below low with volume.
Ride the momentum for a quick 20–30 point move.
Ideal with: Volume spike + option chain confirmation (OI buildup)
Setup Example:
Bank Nifty breaks above 15-min high, with strong buying in 44,000 CE option → go long.
4. Momentum Scalping with RSI + Candles
How it works:
Use 3-minute chart.
If RSI crosses 60 and a strong green candle forms → go long.
If RSI drops below 40 and red candle forms → go short.
Why this works: Combines price momentum with volume conviction.
Targets: Small, quick moves (10–20 points in Nifty, 20–40 in Bank Nifty options)
Stop Loss: Fixed SL or previous candle high/low
5. Option Chain Scalping – "Smart Money Footprint"
How it works:
Track OI build-up in real-time (especially at ATM or 1-step OTM strikes).
If you see heavy OI build-up + volume spike at 44,000 CE → momentum may build.
Enter on confirmation from price chart (ideally with VWAP or CPR confluence).
Bonus: Combine this with Live Change in OI (many brokers offer this now).
Tools to watch:
Strike Price OI Build-up
IV Rise (Implied Volatility)
Volume on Option Contracts
Important Scalping Do’s & Don'ts
Do’s:
Trade only when price structure + indicator + volume align.
Use limit orders to reduce slippage.
Cut losses fast. Scalping is risk-first.
Have fixed daily targets (e.g., ₹1,500/day)
Trade less when market is choppy
Don’ts:
Don’t chase after big moves already gone.
Don’t increase lot size without system consistency.
Don’t scalp in low volatility phases (e.g., between 12–1:30 PM).
Mindset of a Nifty/Bank Nifty Scalper
You are not a trend trader – you’re a sniper.
Profits come from repetition, not jackpot moves.
You must read the pulse of the market within the first 30 minutes.
No trade > bad trade.
Scalping is about control, discipline, and micro-decisions. Even 3–5 successful trades in a session can result in high accuracy days.
Example Live Scenario (Bank Nifty)
Date: Suppose Bank Nifty opens at 44,000
CPR Range: 43,940–44,060 (tight)
VWAP: At 44,020
Option Chain: 44,000 CE OI increasing rapidly, price trading above VWAP
Setup: CPR breakout + VWAP hold + OI build-up at CE
Trade: Buy 44,000 CE @ ₹120
Target: ₹140–₹160
SL: ₹110
Exit: Within 10–15 mins
Avoid trading just on gut feeling. Use structure.
Conclusion
Scalping in Nifty and Bank Nifty is not gambling—it's calculated, quick decision-making with small but consistent profits. Whether you’re using VWAP, CPR, or live option data, your edge comes from preparation and discipline, not prediction.
If you're just starting, begin with paper trading or small lots, and gradually scale up once your win-rate improves. With time, you'll find the setup that fits your personality best—whether it’s breakout-based, pullback scalping, or OI-driven.
Global Factors Impacting Indian MarketsIntroduction
The Indian stock market, like any other major market, is deeply interconnected with global events. While domestic news like RBI policy, election results, or monsoons do influence our stocks, global factors often act as the real drivers behind sharp up-moves or crashes.
Whether you're an investor, trader, or analyst, understanding how global cues influence Nifty, Bank Nifty, Midcaps, and even commodities is essential for smart decision-making.
In this explanation, we’ll break down the major global factors, how they affect Indian markets, and what traders should watch daily and weekly.
1. U.S. Federal Reserve & Interest Rates (Fed Policy)
Why it matters:
The U.S. Federal Reserve’s interest rate decisions directly impact global liquidity. When the Fed raises rates, money becomes costlier. Foreign investors often pull out from emerging markets like India to invest in safer U.S. bonds.
Impact on India:
Rising U.S. interest rates = FII selling in India
Weakens rupee, inflates import costs (e.g., crude oil)
Tech & high-growth sectors take a hit (especially those sensitive to valuations)
2. Crude Oil Prices
India is a major oil importer—more than 80% of our crude is imported. Crude price volatility has massive ripple effects across inflation, currency, fiscal deficit, and stock market sectors.
Impact on India:
High crude = inflation + weak rupee + fiscal stress
Negatively affects oil-dependent sectors like aviation, paints, logistics, autos
Boosts oil marketing companies' revenue (but hits margins if subsidies increase)
Example:
If Brent Crude moves from $70 to $95 in a month, expect:
Nifty to correct
INR to weaken vs USD
Stocks like Indigo, Asian Paints, Maruti to face pressure
💰 3. Foreign Institutional Investors (FII) Flow
FIIs bring in billions of dollars into Indian equity and debt markets. Their buying or selling behavior is often influenced by:
Global risk appetite
Currency trends
Interest rate differentials
Geopolitical tensions
When do FIIs sell?
When the dollar strengthens
When there’s fear in global markets (e.g., war, U.S. recession)
When India underperforms vs peers
When do FIIs buy?
When global liquidity is high
India shows growth resilience vs China or other EMs
Post-election clarity, reform hopes, etc.
Daily Tip:
Watch FII cash market activity—daily inflows/outflows often decide Nifty’s intraday trend.
🏦 4. U.S. Economic Data (CPI, Jobs, GDP, PCE)
Every month, the U.S. releases:
CPI (inflation data)
Jobs Report (NFP)
GDP numbers
PCE (Personal Consumption Expenditures)
These influence Fed decisions, hence impacting global markets.
Example:
A hot U.S. inflation print → Fear of more rate hikes → Nasdaq crashes → Nifty follows
A weak U.S. jobs report → Rate cut hopes → Global rally → Bank Nifty surges
Keep an eye on U.S. calendar events, especially the first Friday of every month (NFP Jobs) and mid-month (CPI release).
🌏 5. Geopolitical Tensions & Wars
Markets hate uncertainty. Global conflicts often lead to panic selling, flight to safety, and surge in gold/crude prices.
Key global risk zones:
Russia-Ukraine
Middle East (Israel-Iran, Saudi-Yemen)
China-Taiwan-U.S. tensions
Impact on India:
Spike in gold and crude
Selloff in equity markets
Rise in defensive sectors (FMCG, Pharma, IT)
Surge in defence stocks (BEL, HAL, BDL)
💱 6. Dollar Index (DXY) & USD-INR Movement
The Dollar Index (DXY) measures the dollar's strength vs other currencies.
Rising DXY = Stronger dollar = FII outflows from India = Nifty weakens
Falling DXY = More risk-on = Money flows into emerging markets = Nifty rallies
Rupee’s role:
A weak INR/USD makes imports costly → impacts inflation
A strong INR/USD helps improve trade balance → attracts investors
💹 7. Global Equity Markets (Dow Jones, Nasdaq, Asian Peers)
The Indian market is heavily influenced by:
Dow Jones, Nasdaq (overnight sentiment)
SGX/GIFT Nifty (pre-market cues)
Asian Markets (Nikkei, Hang Seng, Shanghai)
How it affects us:
Strong global cues = Nifty opens gap-up
Weak Nasdaq = IT stocks sell off at open
Mixed Asian markets = Rangebound Nifty till clarity
Pro Tip: Always check Nasdaq futures and GIFT Nifty levels before the market opens.
🧭 8. China’s Economic Health
As a large global player in manufacturing, China’s growth (or lack of it) sends signals across the world.
If China slows down:
Commodities fall (good for India)
Asian currencies weaken
Global markets get jittery
If China shows strong stimulus:
Metal stocks rally globally (Tata Steel, Hindalco benefit)
Global optimism lifts all EMs
🏦 9. Global Banking or Financial Crises
Remember the Silicon Valley Bank collapse (2023)? Or the 2008 Lehman crisis?
Global financial stress always triggers:
A sell-off in Indian banks
Panic across all indices
Shift toward safe havens (gold, USD)
Traders should monitor:
Global bond yields
Credit Default Swaps (CDS spreads rising = trouble)
Bank stress signals in Europe/U.S.
🌾 10. Global Commodity Cycles (Metals, Energy, Agri)
India, being resource-dependent, reacts to global commodity moves.
Rally in metals = Tata Steel, Hindalco, JSW Steel surge
Rally in coal, oil = Uptrend in ONGC, Coal India, Oil India
Rally in agri = FMCG and consumer food stocks affected
Keep a watch on:
LME (London Metal Exchange) prices
Global wheat/rice/cocoa/sugar trends
🛑 Final Thoughts
Global factors are not just background noise. They are active triggers that move Indian markets every single day.
A smart trader or investor should:
Track global cues as seriously as domestic ones
Prepare for overnight risks using hedges or stop losses
Read market behavior through global context, not just stock-level news
By staying connected to the world, you can stay one step ahead of the market.

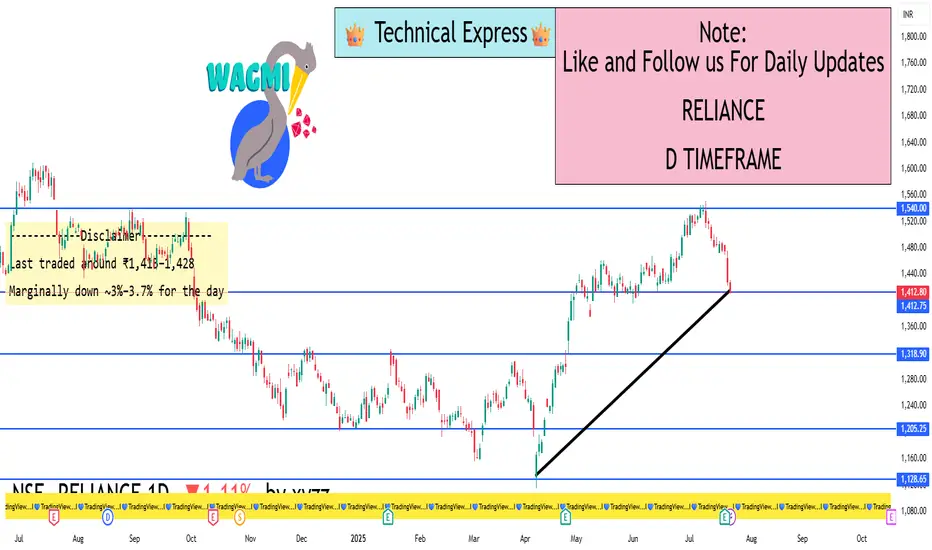
Reliance 1D Timeframe📊 Reliance Industries – Intraday Overview
Previous Close: ₹1,428.6
Opening Price: Opened slightly lower around ₹1,427–₹1,431.
Intraday High: Approximately ₹1,432 during early session.
Intraday Low: Dropped towards ₹1,410 during the mid-session.
Current Trading Price: Trading near ₹1,415, showing around 0.9% to 1% decline from the previous close.
🔍 Key Reasons for Movement Today
Post-Earnings Pressure: After recent earnings, Reliance faced profit booking as some investors booked gains following a previous rally.
Sector Weakness: Energy and telecom segments showed subdued strength while retail remained flat.
Heavy Volume: Trading volume remained above average, suggesting active participation from institutions and retail traders.
📈 Technical Snapshot
Immediate Support Zone: ₹1,410–₹1,412. If this breaks, next support could be near ₹1,400.
Immediate Resistance Zone: ₹1,430–₹1,432. A breakout above this may lead towards ₹1,440–₹1,450.
Trend Positioning: Reliance is currently below its short-term (20-day) moving average, indicating mild short-term weakness but no major breakdown.
💡 Intraday Strategy Levels
Scenario Trigger Point Expected Move
Bullish Reversal Above ₹1,432 Potential upside towards ₹1,445–₹1,450
Neutral/Bearish Between ₹1,410–₹1,430 Consolidation zone with limited moves
Breakdown Risk Below ₹1,410 Could slide to ₹1,400 or even ₹1,390 short-term
✅ Summary Conclusion
Reliance is trading with a mild negative bias, with price action holding between ₹1,410–₹1,432. The overall short-term structure remains weak after intraday profit booking, but key support is holding near ₹1,410. Watch for recovery above ₹1,432 for any bullish reversal or break below ₹1,410 for further downside.
Trade Like Istitution💡 What It Means to Trade Like Institution
✅ You analyze the market like a pro, focusing on price action and key liquidity areas.
✅ You avoid retail traps like false breakouts and late entries.
✅ You follow smart money flow, using higher timeframes for bias and lower timeframes for precision entries.
✅ You target high-probability zones, not random entry signals.
🟣 Core Institutional Trading Concepts
1. Liquidity Hunting
Institutions know where most traders place stop-losses — above recent highs and below recent lows. They:
Push the price to grab liquidity,
Then reverse the market to their original direction.
2. Order Block Theory
An Order Block (OB) is the last bullish or bearish candle before a major move.
Institutions leave footprints at these points:
Bullish Order Block = Entry zone for long trades.
Bearish Order Block = Entry zone for short trades.
3. Market Structure
Smart money never trades randomly. Institutions:
Trade with the trend: identifying Break of Structure (BOS).
Change bias when Change of Character (CHOCH) happens.
Always trade in alignment with market structure.
4. Fair Value Gaps (FVG)
When price moves rapidly, it leaves imbalances on the chart (FVG zones). Institutions often come back to fill these gaps before continuing.
🎁 Trade Like Institution – Step-by-Step Method
Step 1: Mark Higher Timeframe Zones
Use 4H or Daily timeframe to identify major order blocks and liquidity zones.
Step 2: Track Liquidity
Look for equal highs/lows (liquidity build-up).
Wait for liquidity grabs before entering.
Step 3: Look for Break of Structure (BOS)
After liquidity is grabbed, wait for a market structure shift (BOS or CHOCH).
Step 4: Refine Entries on Lower Timeframes
Drop to 5min or 15min timeframe.
Wait for clean entry at order block or FVG, with a small stop loss.
Step 5: Manage Risk Like Institutions
Risk 1-2% per trade maximum.
Target 2:1, 3:1, or more, but exit partially at key liquidity zones.
📝 Institutional Trading Mindset
✅ Patience is Power: Institutions wait for price to come to them.
✅ Quality over Quantity: Few high-probability trades, not dozens of small trades.
✅ Risk Management First: Protect capital like a professional fund.
✅ Follow the Smart Money Flow, never the crowd.
🧩 Example Institutional Trade Setup (Simple):
✅ Timeframe: 4H for direction, 15min for entry.
✅ Mark Daily Order Block → Wait for liquidity grab.
✅ Wait for CHOCH on 15min → Enter after FVG fill.
✅ SL below OB → Target last high (RR 1:3).

Learn Institutional Trading💡 What Does “Learn Institutional Trading” Mean?
When you learn institutional trading, you focus on:
Smart Money Behavior — How institutions think and trade.
Market Manipulation — How the big players create fake moves to trick small traders.
Liquidity Zones — Areas where institutions enter or exit trades.
Order Blocks, Breaker Blocks, Fair Value Gaps — Special price zones where banks place their orders.
Higher Time Frame Analysis — Institutions trade on bigger time frames like 4H, Daily, and Weekly.
🎁 Why Learn Institutional Trading?
✅ Understand why price moves before big news.
✅ Learn where to enter trades with high accuracy.
✅ Trade with peace of mind by following market logic, not emotions.
✅ Get consistent profits by following smart money footprints.
🔥 Key Topics to Learn in Institutional Trading
1. Market Structure
Learn how the price moves in trends: Higher Highs, Higher Lows (Uptrend) and Lower Highs, Lower Lows (Downtrend).
Identify key swing points used by big traders.
2. Liquidity Concepts
Price always goes where liquidity is (stop-loss clusters, pending orders).
Learn about liquidity grabs, stop hunts, and false breakouts.
3. Order Blocks
The secret zones where institutions enter trades.
Once you spot order blocks, you can trade before the market moves big.
4. Fair Value Gap (FVG)
Price always returns to imbalance zones where few trades happened.
Learn to trade the gap fills with high accuracy.
5. Entry Techniques
Learn how to enter using Break of Structure (BOS) or Change of Character (CHOCH).
Use confirmation entries on lower time frames (5min, 15min) after spotting order blocks on higher time frames (4H, Daily)
🧩 Tools You Need to Learn Institutional Trading
✅ TradingView — For chart analysis.
✅ Forex Factory — For news events and market sessions.
✅ SMC Indicators — Some free, some paid tools available for order block marking.
✅ YouTube or Paid Courses — Channels like Mentfx, ICT (Inner Circle Trader), etc.
✅ Trading Journal — To track every trade and improve.
📊 Example Setup (Simple Explanation):
Timeframe: Daily chart for order block → 15min chart for entry.
Step 1: Spot Order Block on Daily.
Step 2: Wait for Liquidity Grab.
Step 3: Wait for CHOCH on 15min.
Step 4: Enter trade with SL below OB → Target previous high/low.
📝 Conclusion:
Learning Institutional Trading = Trading Smart Money Way
This method teaches you to follow the banks and big traders — not get trapped by them. Mastering these skills takes time and practice, but it transforms you from a random gambler into a professional trader.

A possible Head and Shoulder formation in BankniftyChance of a head and shoulder formation on the hourly chart of the Index.
If the market clears the resistance line around 57300, it can form another high or test the recent high made.
On the lower side, there is are support and it may respect the support levels.
Major support levels :- 56800, 56640
Resistance levels :- 57285, 57600
Wait for the market to move above the neck line for any bullish trade to enter in the index. Else bearish trade can be initiated below 56650 levels.
Watch for the price action near the price levels before entering the trade.

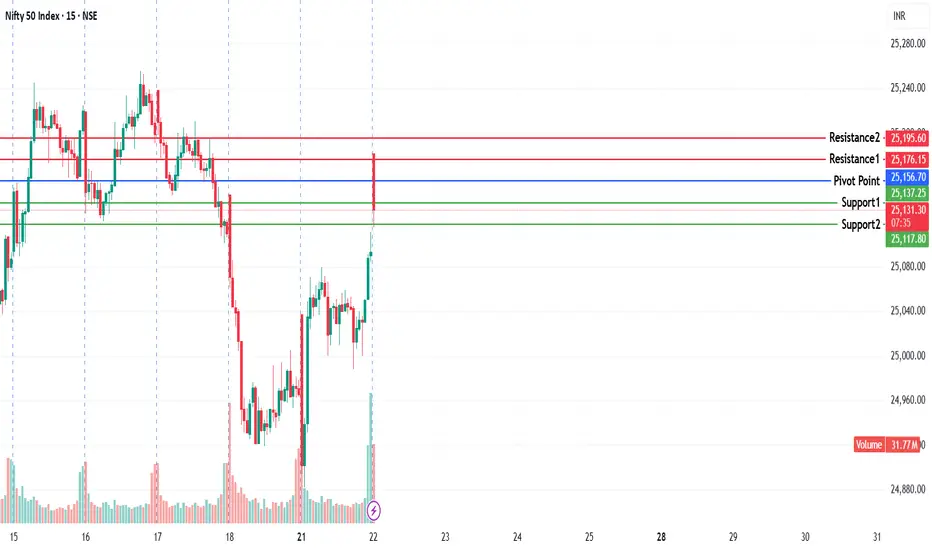
NIFTY KEY LEVELS FOR 22.07.2025NIFTY KEY LEVELS FOR 22.07.2025
If the candle stays above the pivot point, it is considered a bullish bias; if it remains below, it indicates a bearish bias. Price may reverse near Resistance 1 or Support 1. If it moves further, the next potential reversal zone is near Resistance 2 or Support 2. If these levels are also broken, we can expect the trend.
If the range is narrow, the market may become volatile or trend strongly. If the range is wide, the market is more likely to remain sideways
📢 Disclaimer
I am not a SEBI-registered financial adviser.
The information, views, and ideas shared here are purely for educational and informational purposes only. They are not intended as investment advice or a recommendation to buy, sell, or hold any financial instruments.
Please consult with your SEBI-registered financial advisor before making any trading or investment decisions.
Trading and investing in the stock market involves risk, and you should do your own research and analysis. You are solely responsible for any decisions made based on this research.
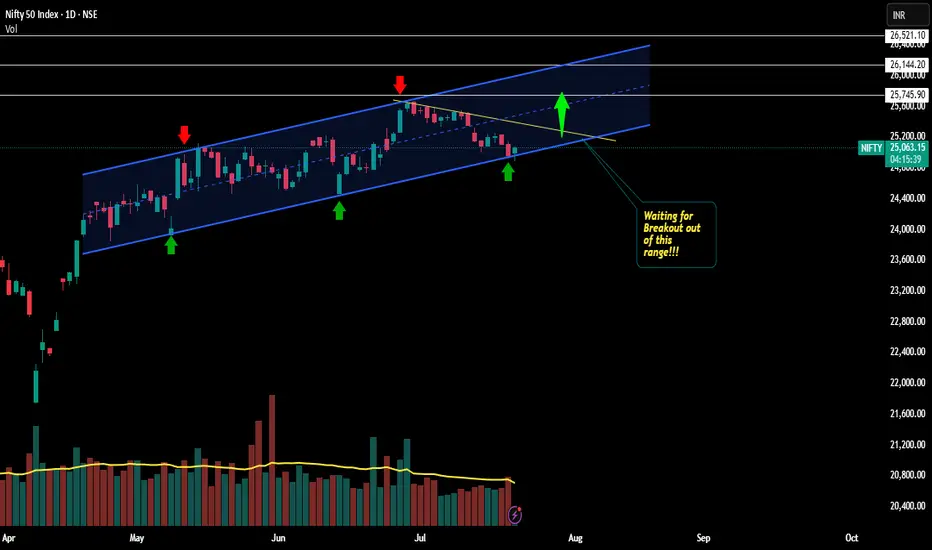
Nifty inside a Parallel channel !!!Yesssss!!!
Chart patterns depict me to go with the above titled view
Nothing much to explain here... .Nifty has been travelling in a parallel channel making higher highs and higher lows
Right now, its is at the bottom support of the parallel channel getting ready for the next leg of upmove...
If this holds good, it may break ATH!!!
Let's wait and watch!!!!
Target levels mentioned as white lines ,Day candle closing out of the channel welcomes bears into play.
We can wait for the 2 HR/DAILY breakout out of the yellow trendline and make our entry and setting SL at the low of the Breakout candle....
will update once it breaks out!!!
This is just my view...not a tip nor advice!!!
Thank you!!!
NIFTY KEY LEVELS FOR 21.07.2025NIFTY KEY LEVELS FOR 21.07.2025
If the candle stays above the pivot point, it is considered a bullish bias; if it remains below, it indicates a bearish bias. Price may reverse near Resistance 1 or Support 1. If it moves further, the next potential reversal zone is near Resistance 2 or Support 2. If these levels are also broken, we can expect the trend.
If the range is narrow, the market may become volatile or trend strongly. If the range is wide, the market is more likely to remain sideways
📢 Disclaimer
I am not a SEBI-registered financial adviser.
The information, views, and ideas shared here are purely for educational and informational purposes only. They are not intended as investment advice or a recommendation to buy, sell, or hold any financial instruments.
Please consult with your SEBI-registered financial advisor before making any trading or investment decisions.
Trading and investing in the stock market involves risk, and you should do your own research and analysis. You are solely responsible for any decisions made based on this research.

Rise of Algorithmic & Momentum-Based Strategy Innovation🧠 Introduction
The world of trading has changed drastically in recent years. Gone are the days when investors made decisions based on gut feeling, tips from friends, or simply following news headlines. Today, technology and data dominate the markets. A big part of this transformation is due to two fast-evolving areas of strategy:
Algorithmic Trading (Algo Trading)
Momentum-Based Trading Strategies
Together, these innovations are not just making trading faster—they're making it smarter, more scalable, and, in some cases, more profitable. Let’s explore this rise of strategy-driven trading in simple, relatable terms.
⚙️ What Is Algorithmic Trading?
Algorithmic trading (or "algo trading") refers to using pre-programmed computer code to buy and sell stocks or other financial assets. These programs follow specific sets of rules and conditions like:
Price movements
Volume changes
Timing of the trade
Technical indicators
News sentiment (in advanced models)
Instead of a human watching charts all day, the algorithm scans multiple assets simultaneously and executes trades at lightning speed when conditions are met.
🔍 Why Is It Popular?
Speed: Algos react in milliseconds.
Accuracy: Reduces human errors.
Discipline: Emotions like fear or greed don’t interfere.
Scalability: Can track hundreds of instruments at once.
⚡ What Is Momentum-Based Trading?
Momentum trading is based on a simple principle:
"What is going up will likely keep going up (at least for a while), and what is going down will keep going down."
Momentum traders try to ride these price trends. They don’t care much about why something is moving—they care that it is moving.
A momentum-based strategy focuses on:
Relative Strength Index (RSI)
Moving Averages
Breakouts above previous highs
Volume surges
In today’s digital world, most momentum strategies are now executed through algorithms, bringing us to the heart of this innovation wave.
💡 Why Is Strategy Innovation Booming in 2025?
1. Availability of Real-Time Data
In the past, getting real-time stock prices or volume data was expensive or difficult. Today, thanks to modern brokers and APIs, anyone can access tick-by-tick data in real time. This has democratized trading innovation.
2. Cloud Computing & Machine Learning
Cloud platforms like AWS, GCP, and Azure now allow even small traders to run complex models. Add machine learning to the mix, and you can build:
Predictive price models
Auto-optimizing strategies
Real-time anomaly detectors
This tech stack is fueling rapid innovation in custom algos and momentum-based systems.
3. Rise of API Brokers
Brokers like Zerodha (via Kite Connect), Upstox, and Dhan offer APIs that allow traders to:
Place trades programmatically
Access order books
Monitor positions via code
This has opened the doors for retail coders and quant enthusiasts to create strategies from their bedrooms—something only institutions could do a decade ago.
4. Market Volatility & Liquidity
Modern markets, especially post-COVID and now with geopolitical unrest, are fast-moving and noisy. Traditional long-term investing sometimes feels too slow. This has created fertile ground for short-term strategies like intraday momentum and algo scalping.
🧬 Types of Momentum-Based Algo Strategies Gaining Popularity
1. Breakout Algos
Entry: When price breaks above a resistance level or 52-week high.
Exit: After achieving target return or on breakdown.
2. Mean Reversion Momentum
Belief: Stocks that over-extend eventually revert back to mean.
Algo buys on dips and sells on peaks, based on Bollinger Bands or Moving Average deviations.
3. Relative Momentum Rotation
Focus: Switch between sectors/stocks showing strongest momentum.
Example: If Auto sector shows higher returns than Pharma over 4 weeks, the algo reallocates capital into Auto.
4. High-Frequency Momentum
Based on volume spikes, price speed, and Level-2 data.
Needs co-location or ultra-low latency to profit from small tick movements.
📊 Real-World Examples (2025 Trends)
Nifty and Bank Nifty Momentum Bots
Retail algo traders now use trend-following strategies on Nifty weekly options, taking intraday calls when the index crosses VWAP + 2%.
SME IPO Listing Day Momentum Plays
Some traders have built algos that scan listing price action and jump in when a stock breaks opening highs with volume.
AI-Augmented Algos
AI-powered bots use NLP (Natural Language Processing) to analyze earnings calls, company announcements, and even tweets. If sentiment is strongly positive, they take long positions.
🧠 Benefits of These Innovations
✅ For Retail Traders:
Better access to tools once exclusive to hedge funds.
Ability to automate their edge.
Save time watching screens all day.
✅ For Institutions:
Lower execution costs.
Scalable strategies across global markets.
Statistical models reduce dependence on human traders.
🧱 Challenges and Limitations
❌ Overfitting in Backtests
Just because a strategy worked in the past doesn't guarantee future success. Many algos “look perfect” in backtests but fail in live trading.
❌ API Latency and Downtime
Retail infrastructure is not as reliable as institutional setups. Brokers may experience order delays or API failures.
❌ Regulation Risk
SEBI and global regulators are watching algo trading closely. Flash crashes or manipulative algos can bring scrutiny and even bans.
❌ Emotional Disengagement
Too much automation can make traders disconnected from market context. Sometimes, manual intervention is needed.
🧭 What’s the Future of These Strategies?
🔮 1. AI + Algo = Self-Learning Bots
The next wave of bots may not follow fixed rules. They may adapt automatically by learning from market behavior—almost like an evolving trader.
🔮 2. Regulation Around Algo Trading
Expect more regulation in 2025–2026 to ensure fairness and stability. SEBI may require audits or sandbox testing before public deployment.
🔮 3. Community-Based Innovation
Open-source algo trading platforms (like Blueshift, QuantConnect, etc.) are becoming collaborative hubs where traders share and upgrade each other's strategies.
🔄 How Can a Retail Trader Start?
✅ Step 1: Learn Python or Use No-Code Platforms
Python is the language of algo trading. If you can’t code, use platforms like AlgoTest, Tradetron, or Streak.
✅ Step 2: Start Small
Begin with paper trading or small capital. Don’t go all-in until you have confidence and historical data.
✅ Step 3: Choose a Clean Strategy
Start with something simple—like RSI + Moving Average crossover, and backtest on Nifty.
✅ Step 4: Track Metrics
Measure win ratio, drawdown, average profit per trade. Good algo traders analyze more than they trade.
✍️ Final Words
The rise of algorithmic and momentum-based strategy innovation is reshaping India’s trading landscape. It’s making the game smarter, faster, and more competitive. But like every tool, it depends on how you use it. These strategies aren’t magic bullets—they're systems that require patience, research, and constant optimization.
For traders willing to invest in knowledge and tools, the opportunities are exciting. For those hoping to “copy-paste” quick riches, the market may prove costly.
In 2025 and beyond, the best traders may not be those with the sharpest eyes—but those with the smartest code.
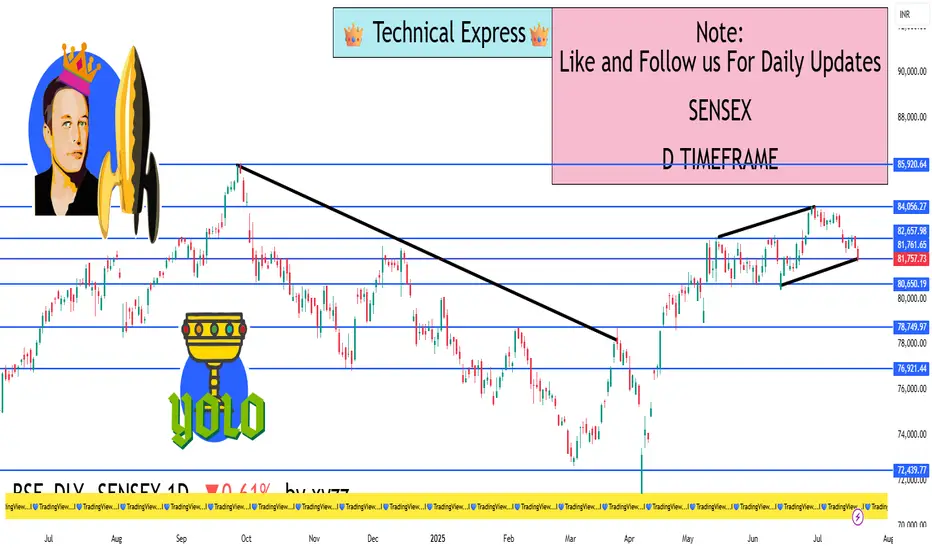
Sensex 1D Timeframe✅ Current Market Status:
Closing Price: ₹82,452.00
Change: –148.32 points
Percentage Change: –0.18%
Day’s Range: ₹82,300.70 – ₹82,892.30
52-Week Range: ₹65,302.20 – ₹83,822.00
🔍 Key Technical Levels:
📌 Support Zones:
Support 1: ₹82,200 – minor trendline support
Support 2: ₹81,800 – recent bounce zone
Support 3: ₹81,000 – strong institutional buying level
📌 Resistance Zones:
Resistance 1: ₹82,900 – intraday high rejected
Resistance 2: ₹83,400 – multi-session top
Resistance 3: ₹83,800 – all-time high zone
🕯️ Candlestick Pattern:
Candle Type: Bearish body with upper wick
Formation: Reversal candle after a small bounce
Implication: Supply seen near highs; indicates hesitation in buying
📈 Indicator Status (1D Timeframe):
Indicator Value & Signal
RSI (14) ~45 – Neutral but slipping downward
MACD Bearish crossover – sellers gaining control
20 EMA ~₹82,780 – Price below this level (short-term bearish)
50 EMA ~₹82,000 – May act as dynamic support soon
📊 Price Structure Summary:
Sensex is in a tight range between ₹81,800 and ₹83,400.
The price rejected from ₹82,900, showing sellers are active.
If ₹82,200 breaks, we might see movement toward ₹81,800 and ₹81,000.
A bullish breakout will only occur above ₹83,400 with strong volume.
🧠 Market Sentiment & Institutional View:
Volatility: Moderate — no extreme panic or euphoria
Volume: Average — no big accumulation seen
Smart Money Activity: Likely waiting near breakout levels or lower discount zones (₹81,000)
🔚 Summary:
🔴 Short-Term Bias: Slightly Bearish
🟡 Key Range: ₹81,800 – ₹83,400
✅ Buyers' Entry Point: Above ₹83,400
⚠️ Sellers' Trigger: Below ₹82,200 or ₹81,800 for more downside
Learn Institutional Trading Part-9🎯 Why Learn Advanced Option Trading?
Advanced option trading lets you:
✅ Profit in bullish, bearish, or sideways markets
✅ Use time decay to your advantage
✅ Limit risk while maximizing potential reward
✅ Create non-directional trades
✅ Build hedged and balanced positions
✅ Use data, not emotion for decision making
It shifts you from being a trader who hopes for direction to one who profits from market behavior — movement, volatility, time decay, and imbalance.
🧠 Core Concepts in Advanced Option Trading
1. Option Greeks
Understanding the Greeks is essential for advanced strategies.
Delta: Measures price sensitivity to the underlying (helps with directional trades).
Theta: Measures time decay. Option sellers use Theta to earn premium.
Vega: Measures sensitivity to implied volatility (IV).
Gamma: Measures how Delta changes — useful for adjustments and hedging.
Rho: Interest rate sensitivity (used in long-term options).
Greeks help you balance risk and reward and fine-tune your strategies based on volatility and time.
2. Implied Volatility (IV) & IV Rank
IV shows the market’s expectation of future volatility.
High IV = high premium; low IV = cheap premium.
IV Rank compares current IV to its past 52-week range — essential for deciding whether to buy or sell options.
💡 Advanced rule:
High IV + High IV Rank = Favor selling options
Low IV + Low IV Rank = Favor buying options
3. Multi-Leg Strategies
Multi-leg trades involve using more than one option to hedge, balance, or amplify your position.
Here are the most popular advanced option strategies:
🔼 Bullish Strategies
🔹 Bull Call Spread
Buy one lower strike Call, sell a higher strike Call
Profits if the market rises within a defined range
Lower cost than buying a single Call
🔹 Synthetic Long
Buy a Call and Sell a Put of the same strike
Replicates owning the underlying, but with options
🔽 Bearish Strategies
🔹 Bear Put Spread
Buy a higher strike Put, sell a lower strike Put
Profits if market falls within a defined range
🔹 Ratio Put Spread
Buy one Put, sell two lower-strike Puts
Low-cost or credit strategy with higher reward if price falls moderately
🔁 Neutral or Range-Bound Strategies
🔹 Iron Condor
Sell one Call spread and one Put spread
Profits if market stays between both spreads
Ideal in low volatility, sideways markets
🔹 Iron Butterfly
Sell ATM Call and Put, buy OTM wings
Profits from time decay and stable price
High Theta, limited risk and reward
🔹 Straddle (Buy/Sell)
Buy/Sell ATM Call and Put
Used when expecting high volatility (Buy) or low volatility (Sell)
🔹 Strangle
Buy/Sell OTM Call and Put
Lower cost than Straddle, wider profit zone
🛡️ Hedging Strategies
🔹 Protective Put
Hold underlying asset, buy a Put to limit downside
Like insurance for your long position
🔹 Covered Call
Hold stock, sell a Call to generate income
Profitable if the stock stays flat or rises slightly
🔹 Collar Strategy
Hold stock, buy Put and sell Call
Risk defined, reward capped — good for conservative investors
📊 Open Interest & Option Chain Analysis
Open Interest (OI) shows where the majority of contracts are built.
High OI + Price Rejection = Institutional Resistance/Support.
Watching Call/Put buildup gives clues about range, breakout zones, and expiry-day moves.
💡 PCR (Put Call Ratio): A sentiment indicator.
PCR > 1: More Puts → Bearish
PCR < 1: More Calls → Bullish
⏱️ Time Decay & Expiry Trades
Advanced traders use weekly options to capitalize on Theta decay. Weekly expiry strategies include:
Short Straddles/Strangles
Iron Condors
Calendar Spreads
These strategies make use of:
Fast premium decay on Thursday/Friday
Stable market periods
Defined risk setups
🧠 Advanced Psychology & Risk Control
Professional option traders don’t overtrade or overleverage. They:
Follow the 1–2% risk per trade rule
Avoid trading during event-based spikes (e.g., budget, Fed speeches)
Take non-directional trades in consolidating markets
Focus on probability over prediction
Maintain a trading journal and review setups
🎓 Pro Tips to Master Advanced Option Trading
✅ Understand the Greeks — especially Theta & Vega
✅ Use multi-leg strategies to reduce risk and cost
✅ Follow IV Rank — don’t buy expensive options
✅ Use high reward-to-risk setups
✅ Track OI build-up and option chain flow
✅ Avoid gambling — options are tools, not lottery tickets
✅ Always use hedged positions, especially when selling options
🧘 Final Words: Become the Strategist, Not the Speculator
Advanced Option Trading is not about guessing where the market will go — it’s about constructing trades that win in multiple scenarios.
It empowers you to:
Manage risk like a professional
Generate regular income from time decay
Adjust and defend trades when things go wrong
Trade with confidence, not emotion
If you’re ready to move beyond basic buying and start mastering the real edge in options, advanced strategies are your next level. This is how institutions trade. This is how real consistency is built.

Learn Institutional Trading Part-6🧠 Who Are the Institutions?
Institutions include:
Hedge Funds
Mutual Funds
Investment Banks
Insurance Companies
Proprietary Trading Firms
They control billions in capital and cannot enter or exit the market like a small trader. Instead, they engineer price movements through smart accumulation, fakeouts, and liquidity manipulation to fill their orders efficiently.
Their goals are not to chase price, but to control it.
🔍 How Do Institutions Trade?
Institutions follow a logical and systematic approach:
Accumulate positions slowly in sideways or quiet markets.
Manipulate price to trap retail traders.
Trigger Liquidity Events (stop-loss hunting, fake breakouts).
Expand price in the true direction.
Distribute their position near highs/lows.
Reverse or Hedge their position when the market shifts.
Let’s go deeper into how to mirror these actions.
📊 Key Concepts to Trade Like Institutions
1. Market Structure Mastery
Institutions move in phases:
Accumulation: Range-bound movement where they quietly build long/short positions.
Manipulation (Fake Moves): Price breaks out and reverses — trapping retail traders.
Expansion: The real move begins after stop-losses are triggered.
Distribution: Institutions slowly exit positions while retail traders enter.
When you trade like institutions, you identify where the market is in these phases and act accordingly.
2. Liquidity Zones
Institutions need liquidity to execute big orders — they look for areas where lots of retail traders place stop-losses or entries.
They often target:
Swing highs/lows
Trendline breaks
Support/resistance levels
Breakout zones
You’ll notice price spikes into these zones, hits stops, and then reverses — this is smart money at work.
🔑 Tip: Don’t trade breakouts blindly — ask “who’s being trapped here?”
3. Order Blocks & Imbalances
An Order Block is the last bullish or bearish candle before a sharp move — representing institutional entry.
Price often returns to these zones to:
Fill remaining orders
Test liquidity
Offer re-entry for institutions
Similarly, Imbalances (Fair Value Gaps) are areas where price moved too quickly, creating a “gap” in buying/selling. These are likely targets for future reversals or pullbacks.
These zones give high probability entries when used with structure and confirmation.
4. Inducement & Manipulation
Before a big move, institutions often induce retail traders into taking the wrong position.
Examples:
False breakout above resistance (induces longs)
Sharp move below support (induces shorts)
Spike in volume, fake news-driven moves
These actions create liquidity that institutions need to enter their real positions. As a smart trader, your job is to recognize the trap and take the opposite side.
5. Risk Management Like a Pro
Institutions never bet the house. Their risk practices include:
Fixed percentage risk per trade (e.g., 0.5%–2%)
Diversified entries
Portfolio hedging (e.g., buying puts, selling covered calls)
Sticking to the strategy, not emotions
To trade like institutions:
Always calculate your risk-reward
Avoid overleveraging
Accept that not every trade wins, but your edge wins over time
6. Use of Data, Not Indicators
Institutions don’t trade off MACD or RSI. They use:
Price Action
Volume
Order Flow
Open Interest
Economic News & Macro Flow
This doesn’t mean you can’t use indicators — but use them as confirmation, not decision-makers. Price is the main truth.
