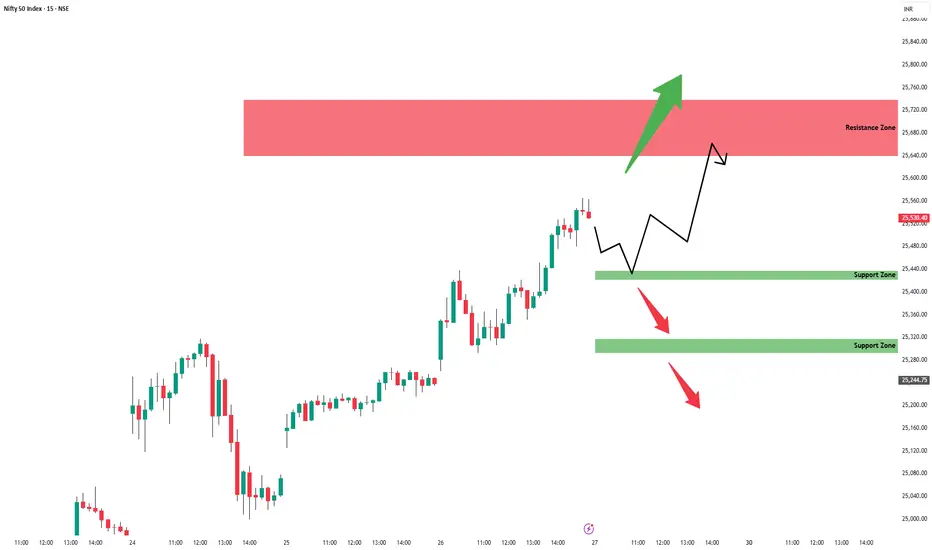
Nifty - Intraday levels & Prediction for - 01 Jul 2025Nifty Prediction for Tomorrow:
Trend : Sideways to Moderately BEARISH upto 25300 - 25400
Sentiment : Positive
Expectation : Nifty will test 15m 200 EMA before takes the reversal towards uptrend.
Look for Buy/Sell at Demand and Supply zone for profitable trades.
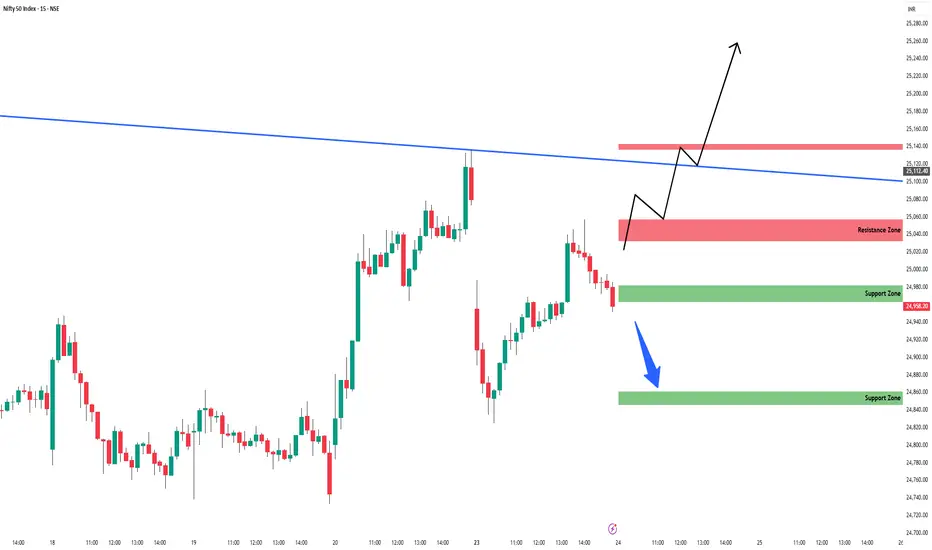
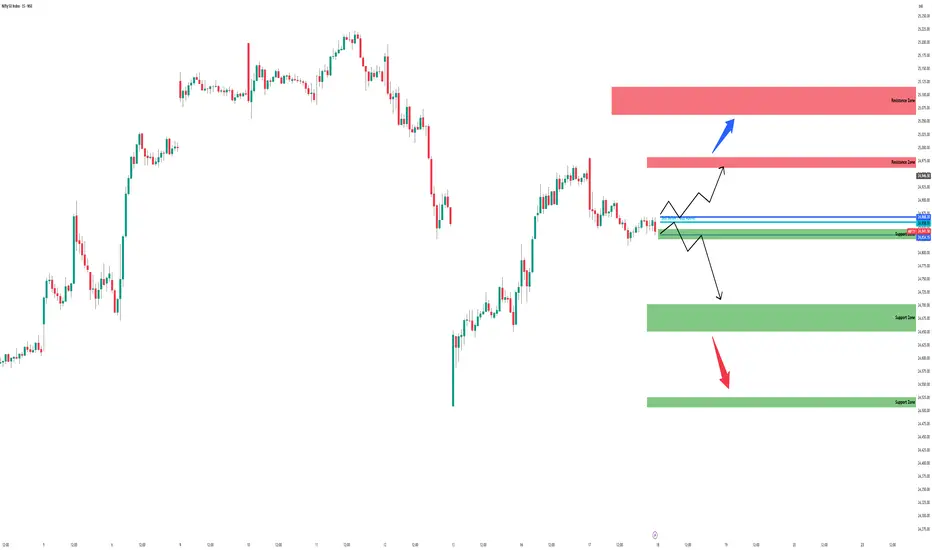
Demand and Supply Zones - When price breaks the zone, Demand zone will become Resistance and Supply zone will become Support. If Nifty Sustains above 24900 tomorrow we can see good rally upto 25080 Resistance. Any breakout above 25100 and next resistance 25200
Refer the chart for detailed Intraday Support and Resistance levels.
Nifty50
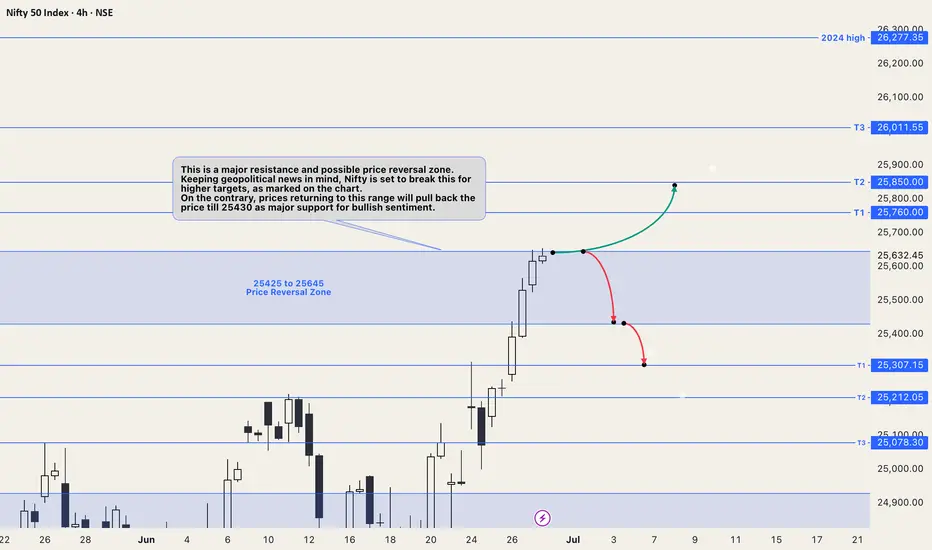
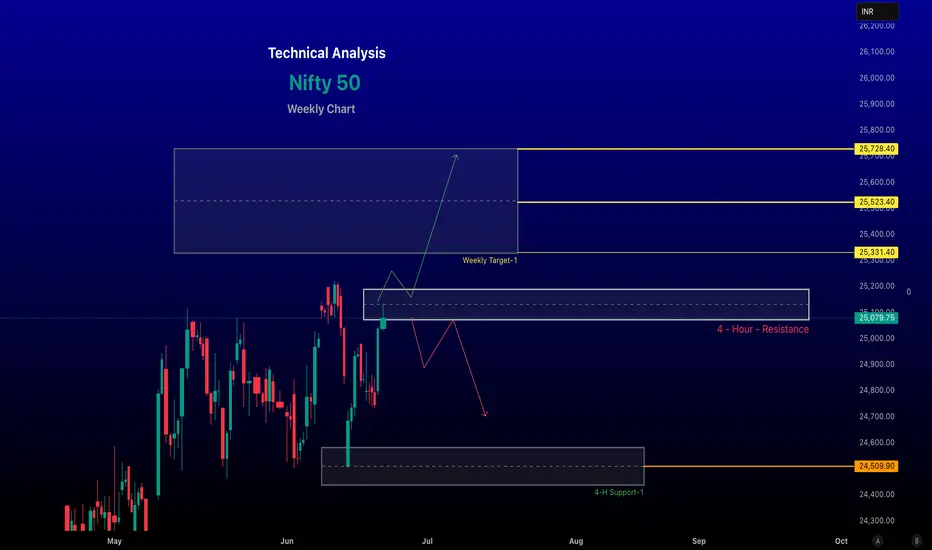
Nifty chart updates for this coming weekThis is a major resistance and possible price reversal zone. Keeping geopolitical news in mind, Nifty is set to break this for higher targets, as marked on the chart.
On the contrary, prices returning to this range will pull back the price to 25430 as major support for bullish sentiment.
All major levels for targets on both sides are mentioned on the chart. The Price trading in the blue colored range is a no-trade zone, which means it will be range-bound until it gives a breakout on either side.
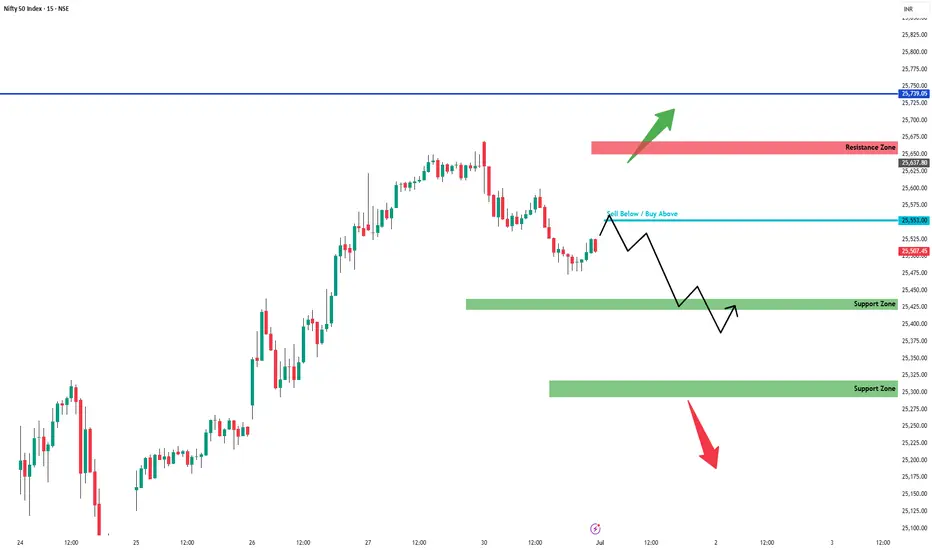
NIFTY INTRADAY LEVELS ( EDUCATIONAL PURPOSE ) 30/06/2025🔷 Nifty Intraday Trade Plan – 30 June
📊 Analysis: 15-min TF | Execution: 1-min TF
🔹 GAP-UP Opening (Above 25,700)
📍 Plan: Avoid chasing longs. Wait for rejection or reversal
🔁 Entry: Sell on breakdown below 5-min low
🛑 SL: 15–20 pts above high
🎯 Target: 25,500–25,540
🔹 GAP-DOWN Opening (Below 25,500)
📍 Plan: Avoid panic selling. Look for reversal candle
🔁 Entry: Buy if price reclaims 5-min opening high
🛑 SL: 15–20 pts below swing low
🎯 Target: 25,650–25,700
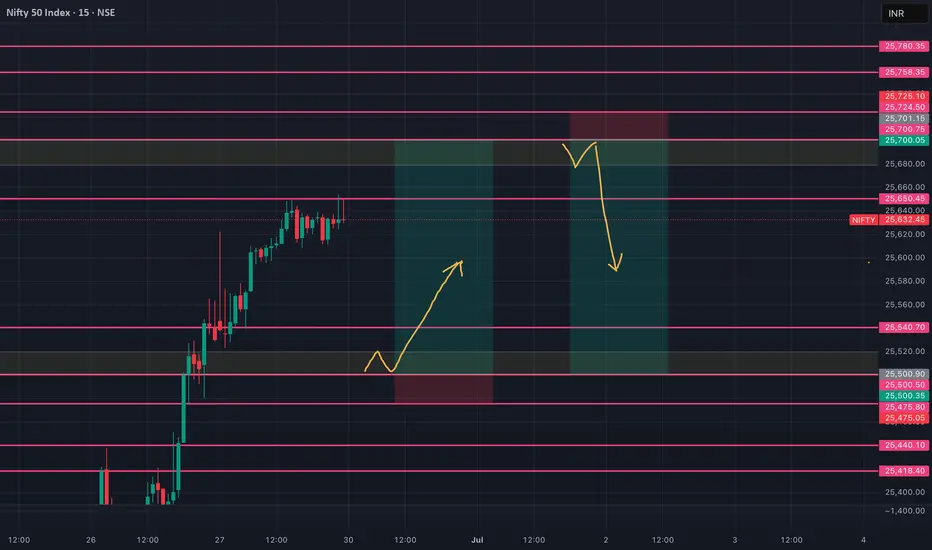
🔹 NORMAL OPEN (Between 25,500–25,700)
🔁 Range Play Setup
📍 Sell near 25,680–700 (resistance zone)
📍 Buy near 25,500–520 (support zone)
🛑 SL: 15–20 pts beyond trigger level
🎯 Target: 30–40 pts
🔺 Breakout Trade Setup
🔁 Entry: Above 25,700 breakout candle
🛑 SL: Below breakout bar
🎯 Target: 25,760–780
🔻 Breakdown Trade Setup
🔁 Entry: Below 25,500 breakdown
🛑 SL: Above breakdown bar
🎯 Target: 25,440–420
💡 KEY INTRADAY TIPS
✔ Avoid overtrading in opening 5 min
✔ Focus on clean 1-min structure
✔ Size small until confirmation
✔ Follow strict SL & trail profits
Nifty Continued to Rise, Bank Nifty Stands Tall at New Highs◉ Nifty Analysis NSE:NIFTY
Indian equity markets broke out of a five-week consolidation last week, powered by easing geopolitical tensions, which helped boost investor sentiment.
A Pole & Flag breakout on the charts signals a continuation of the uptrend, with strong bullish momentum building up.
Open Interest (OI) Snapshot
● 25,000 – Strong Base: Heavy put writing indicates strong support; bulls defending this level aggressively.
● 25,500 – Immediate Support: A secondary cushion with notable put buildup—short-term buyers watching this zone.
● 26,000 – Immediate Resistance Zone: Call writers active here; a breakout above this level could trigger a fresh leg up.
Outlook: The index looks set to maintain a bullish tone, with a possible move toward 26,000 in the coming sessions.
◉ Bank Nifty Analysis NSE:BANKNIFTY
The banking sector continues to lead the market’s strength, acting as a major driver behind the recent rally.
Fundamentally, optimism is being driven by lower funding costs, supported by banks cutting fixed deposit rates and the RBI’s recent cut in the Cash Reserve Ratio (CRR)—both of which have boosted liquidity and improved the outlook for lenders.
The index has confirmed a breakout from a Pole & Flag formation, aligning with Nifty’s bullish setup and further validating strength in the banking space.
Open Interest (OI) Snapshot
● 56,000 – Strong Support Zone: Significant put writing shows strong bullish conviction around this level.
● 57,000 – Immediate Support: Fresh positions being built; dip-buyers may step in here.
● 58,000 – Key Resistance Ahead: Call writers are holding the line—watch for breakout signals.
Outlook: As long as Bank Nifty holds above 57,000, the bullish momentum is expected to continue, with possible testing of 58,000 in the near term.

Nifty 50 weekly Analysis for June 28, - 04, July 2025
~~ Nifty 50 Analysis for June 28, 2025 ~~
As of June 28, 2025, the Nifty 50 index continues to exhibit a bullish bias with cautious undertones, driven by global market sentiment, domestic buying, and technical patterns. Below is a comprehensive analysis based on the latest available data and market insights.
# Market Performance Overview
Previous Close (June 27, 2025): The Nifty 50 closed at 25,637.80, up 88.80 points (+0.35%), reflecting a positive session driven by select sectors.
Market Context: The index has been on a four-day gaining streak, supported by positive global cues, including easing geopolitical tensions (e.g., ceasefire between Israel and Iran), falling crude oil prices, and dovish signals from the U.S. Federal Reserve, which have boosted risk appetite.
##Technical Analysis
Trend and Momentum:
The Nifty 50 is trading within an ascending channel on the daily timeframe, indicating a bullish structure. On the weekly timeframe, it is forming an Ascending Triangle Pattern, a bullish setup that could lead to a breakout if the index sustains above 25,300.
The index is above key Exponential Moving Averages (EMAs) (20-day, 50-day, 100-day, and 200-day), reinforcing the bullish trend. The weekly chart shows alignment above the 20-week, 50-week, and 200-week EMAs, with an Inside Bar pattern indicating buying interest on dips.
Relative Strength Index (RSI): The RSI is at 49.90–64.58, reflecting neutral momentum. It is neither overbought nor oversold, suggesting room for movement in either direction depending on fresh triggers.
MACD: The MACD for the broader index is indecisive, with some constituents (e.g., HCL Technologies) showing bullish signals, while others (e.g., Hero MotoCorp) are bearish.
Support and Resistance Levels:
Support: Immediate support is at 25,130–25,060, with stronger support at 24,800–24,650. A break below 24,500 could lead to a deeper correction toward 24,300–24,400.
Resistance: The index faces resistance at 25,600–25,700, with a breakout above this zone potentially targeting 26,100, close to the all-time high of 26,277.35 (Sep 27, 2024).
A sustained move above 25,300 could confirm bullish continuation, while failure to break 25,700 may lead to profit booking.
Next Weekly Target 26,800 - 27,000 Chart posted for your reference only
-- Disclaimer --
This analysis is based on recent technical data and market sentiment from web sources. It is for informational purposes only and not financial advice. Trading involves high risks, and past performance does not guarantee future results. Always conduct your own research or consult a SEBI-registered advisor before trading.
#Boost and comment will be highly appreciated

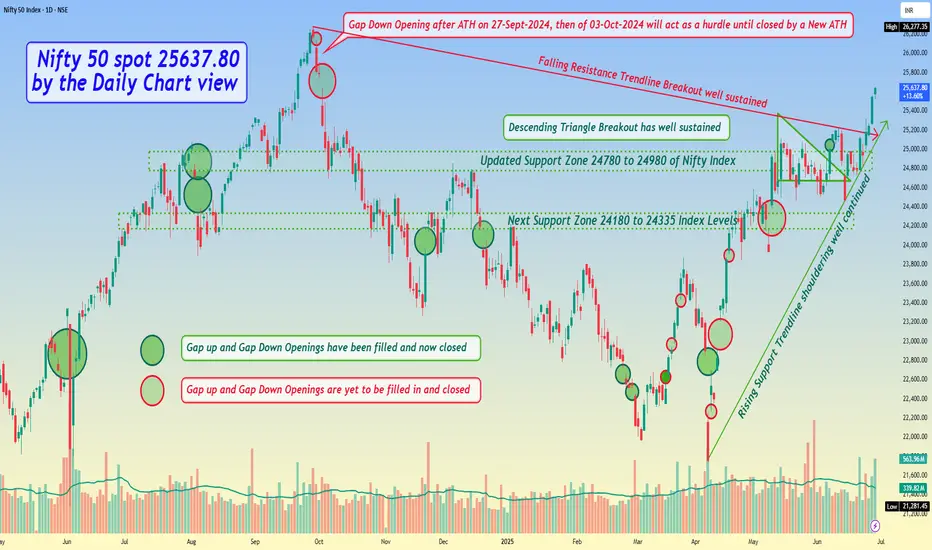
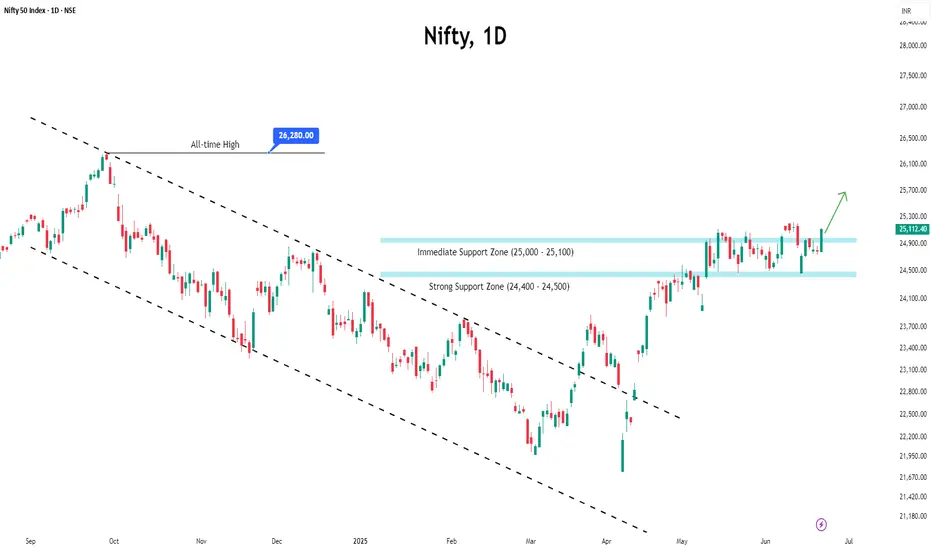
Nifty 50 spot 25637.80 by the Daily Chart view - Weekly update*Nifty 50 spot 25637.80 by the Daily Chart view - Weekly update*
- Descending Triangle Breakout has well sustained
- Immediate Support Zone 25125 to 25335 of Nifty Index
- Next updated Support Zone 24780 to 24980 of Nifty Index
- And then next Support Zone 24180 to 24335 of Nifty Index Levels
- Resistance Zone seen at 25860 to 26035 and then ATH 26277.35 of Nifty 50 Index levels
- Rising Support Trendline shouldering well continued and Falling Resistance Trendline Breakout well sustained
- *Gap Down Opening after ATH on 27-Sept-2024, then of 03-Oct-2024 will act as a hurdle until closed by a New ATH*
Nifty - Elliot Wave - Update - Stay long till proven otherwise!Our view that at least one more leg up was pending has held out well.
View shared here:
Now, Since it took longer in consolidation, I am open to considering that we did a sideways 2 and are heading up in 3.
Crossing 25700 will invalidate LD and hence increase probability that 3 up has started.
P.S.: If we are actually in 3, then 28k - 30k possible in this year. So, hold on :)

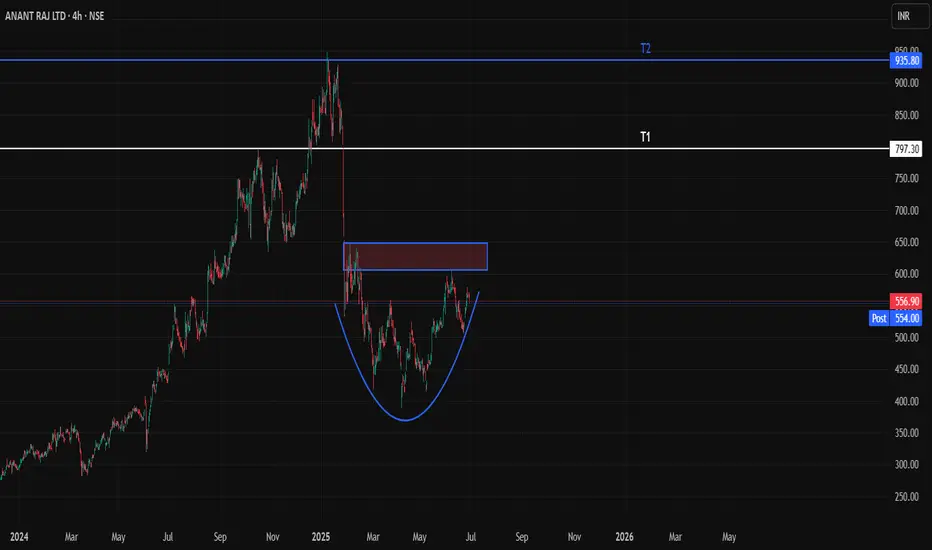
AnantRaj - About to wake up from deep slumber Hello folks! Here is the 4H time frame chart of anantraj which shows a rounding bottom consolidation pattern forming after a steep news driven downtrend. Volumes have nicely picked up in the accumulation phase.
We need to wait for dry volumes now followed by a breakout above the marked supply zone in the chart and we will see T1 and T2 succesfully post breakout!
With the data centre theme gaining back some of the lost traction in the past quarter we can expect a good upside in this counter within the next 2 months itself
Nifty - Intraday levels & Prediction for - 27 Jun 2025Nifty Prediction for Tomorrow:
Trend : Sideways to Moderately BULLISH
Sentiment : Positive
Expectation : Nifty will fill 25640 - 25740 Gap tomorrow after some consolidation.
Look for Buy/Sell at Demand and Supply zone for profitable trades.
Demand and Supply Zones - When price breaks the zone, Demand zone will become Resistance and Supply zone will become Support. If Nifty Sustains above 24900 tomorrow we can see good rally upto 25080 Resistance. Any breakout above 25100 and next resistance 25200
Refer the chart for detailed Intraday Support and Resistance levels.
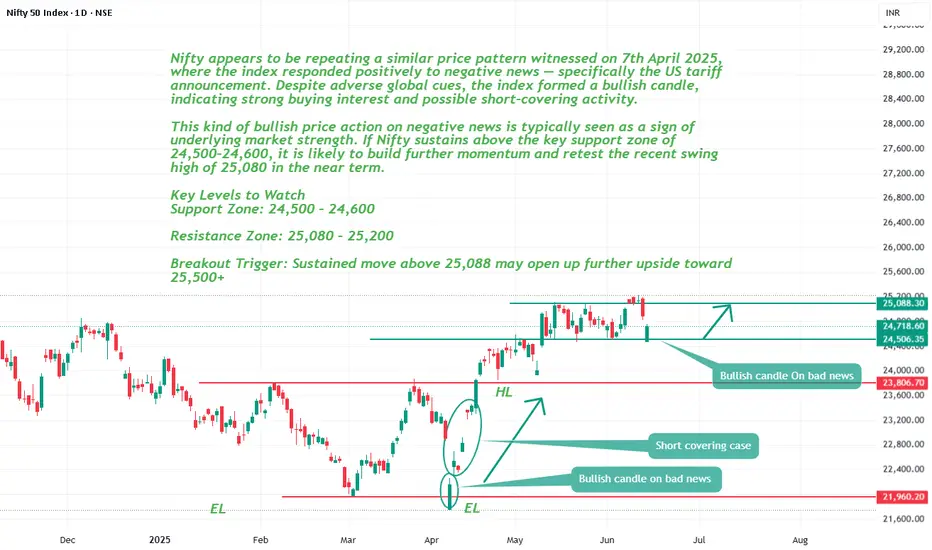
Nifty appears to be repeating price pattern of 7th April.Nifty appears to be repeating a similar price pattern witnessed on 7th April 2025, where the index responded positively to negative news — specifically the US tariff announcement. Despite adverse global cues, the index formed a bullish candle, indicating strong buying interest and possible short-covering activity.
This kind of bullish price action on negative news is typically seen as a sign of underlying market strength. If Nifty sustains above the key support zone of 24,500–24,600, it is likely to build further momentum and retest the recent swing high of 25,080 in the near term.
Key Levels to Watch
Support Zone: 24,500 – 24,600
Resistance Zone: 25,080 – 25,200
Breakout Trigger: Sustained move above 25,088 may open up further upside toward 25,500+
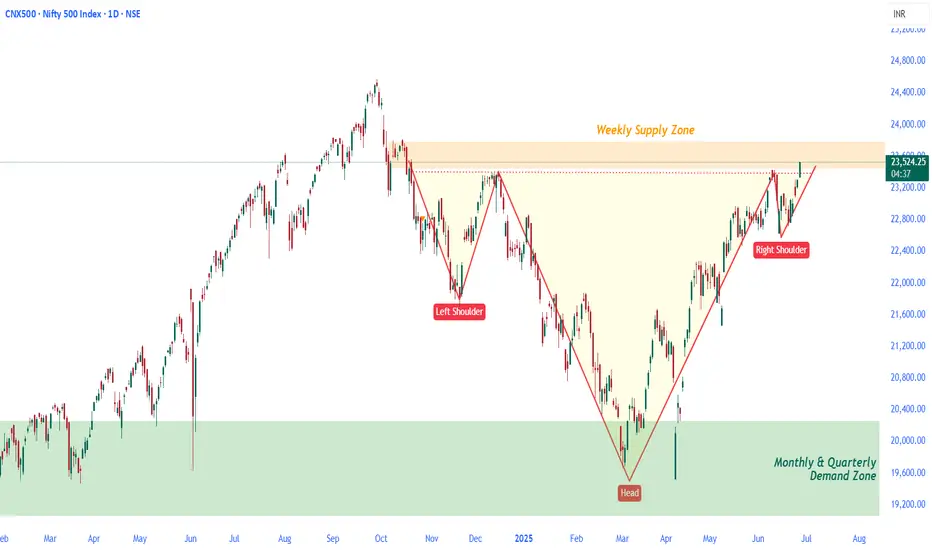
Nifty 500 – Price Action Update | Big Move Ahead?This chart, in my view, is a masterclass in how institutional money operates, flowing with incredible precision between high-timeframe demand and supply zones. Let’s break down the key moves we’re seeing right now.
🔎 A Deeper Look at the Price Action
The Initial Drop & Rejection: The price action began to form what looks like the left shoulder of an inverse Head & Shoulders pattern. During that period, we saw a sharp drop that created a fresh Weekly Supply Zone. The first time price reached this zone, it was rejected decisively, leading to a significant decline.
Finding the 'Head' in the Right Place: Here’s what I find most interesting. The real support to form the 'Head' of the pattern wasn't random at all. If you look closely, the price found a rock-solid floor right inside a Monthly + Quarterly Demand Zone. This isn’t just a
bounce; it's a high-timeframe decision point. The aggressive rally that followed is a clear and unmistakable sign of institutional activity.
🛡️ The Weekly Supply Zone: A Weakening Barrier
As the market rallied from the 'Head,' it once again faced rejection from that same Weekly Supply Zone, leading to the formation of the 'Right Shoulder.'
That zone was fresh and powerful on its first test. But now, it’s a different story.
Here’s the key takeaway: a tested zone loses strength, and this one has been tested multiple times now. We’re seeing a classic power shift here. The market is consistently drawing strength from the deep, high-timeframe Monthly and Quarterly demand, while the supply—once dominant—is now struggling to push the price down. It's a clear signal that the sellers are losing their grip.
🚀 Neckline Breakout: Is This a Bullish Trap?
Now, let's talk about the big move : the price has broken above the neckline of the Inverse Head & Shoulders. While this is a textbook bullish signal, a casual observer might hesitate. Why? Because this breakout is happening right inside that old Weekly Supply Zone.
So, is this a bullish trap? I wouldn’t jump to conclusions just yet. Smart traders will notice a few critical things:
The supply has been tested multiple times. Its integrity is compromised.
No fresh, higher-timeframe supply has formed above this level.
Demand is still originating from the strongest zones on the chart (the Monthly and Quarterly).
This confluence of factors significantly increases the probability that this supply zone is finally on its last legs and a breakout is imminent.
🎯 Final analysis
📈 Stay sharp, trade clean, and respect the zones.
This analysis is for educational purposes only. I’m not a SEBI-registered advisor and this is not a trading or investment recommendation.
The institutional footprint is undeniable—big players have been accumulating near that Quarterly Demand.
The price has been absorbing the Weekly supply slowly but surely, like a sponge soaking up water, and now it looks ready to explode.
As long as the price holds above the neckline and key demand zones, bullish momentum is very likely to continue.
If we see a solid candle close , I’d expect an impulsive rally that could take us toward the 24,000+ level.
the momentum is clearly in favor of the bulls. So what do you think? Is this the start of a major move?
Learn Institutional Trading Part-10What is Divergence?
Divergence occurs when the price of a stock and an indicator (like RSI, MACD, or momentum indicators) move in opposite directions. It is often considered a warning that the current trend may be losing strength.
Types of Divergence
Regular Divergence:
Indicates potential trend reversal.
Example: Price makes a new high, but RSI makes a lower high.
Hidden Divergence:
Indicates trend continuation.
Example: Price makes a higher low, but RSI makes a lower low.
How to Use Divergence
Combine with support and resistance levels.
Confirm with volume and candlestick patte

Learn Institutional TradingInvesting
Investing means putting your money into assets (like stocks, real estate, gold, or mutual funds) to grow your wealth over time.
It’s usually long-term, focused on building value and achieving goals like retirement or buying a house.
Divergence Trading
Divergence trading is when you compare the price of a stock with an indicator (like RSI or MACD).
If the stock is going up, but the indicator is going down (or vice versa), it shows divergence—a possible signal that the price might reverse soon.

Nifty 50 Weekly Technical Analysis for June 23 – June 27 , 2025# Here's a concise technical analysis of the NIFTY 50 Index based on the latest available data as of June 20, 2025:
-- Current Market Snapshot --
Closing Price: The NIFTY 50 closed at approximately 25,100, with a significant daily gain of over 1,046 points for the Sensex, indicating strong bullish momentum.
Recent Trend: The index has been trading within a tight consolidation range (24,350–25,250) since mid-May 2025, forming a rectangular pattern. A breakout above 25,100 could signal further upside.
Daily Movement: On June 18, the NIFTY rebounded strongly from an intraday low below 24,800, reclaiming 24,900, supported by broad-based buying across sectors like auto, financial services, FMCG, pharma, and realty.
Key Technical Levels
Resistance:
Immediate: 25,114–25,215 (crucial for bullish momentum). A sustained break above 25,215 could target 25,340–25,700.
Major: 25,484–25,600, where profit booking may occur.
Support:
Immediate: 24,400–24,600 (key to maintaining bullish bias).
Stronger: 24,600 (break below could attract short sellers) and 24,374 (major demand zone).
Historical Context: The index reached its all-time high of 26,277.35 on September 27, 2024, and is currently ~4.5% below that level
-- Disclaimer --
This analysis is based on recent technical data and market sentiment from web sources. It is for informational purposes only and not financial advice. Trading involves high risks, and past performance does not guarantee future results. Always conduct your own research or consult a SEBI-registered advisor before trading.
#Boost and comment will be highly appreciated
Nifty - Intraday levels & Prediction for - 24 Jun 2025Nifty Prediction for Tomorrow:
Trend : BULLISH
Sentiment : Positive
Expectation : Nifty made Bullish Harami candle today, with strong Buying momentum. So Nifty likely to open Gap up tomorrow and rally continuation. If Nifty Sustains above 25080 for 15m we can see Stron uptrend upto 25300 / 25500 levels..
Look for Buy/Sell at Demand and Supply zone for profitable trades.
Demand and Supply Zones - When price breaks the zone, Demand zone will become Resistance and Supply zone will become Support. If Nifty Sustains above 24900 tomorrow we can see good rally upto 25080 Resistance. Any breakout above 25100 and next resistance 25200
Refer the chart for detailed Intraday Support and Resistance levels.
Nifty Eyes Upside as Bulls Take Charge Ahead of Expiry WeekThe Nifty closed around 25,112 on Friday, marking a 1.29% gain for the week and signalling strong bullish momentum. The rally was driven by broad-based buying, particularly in financial heavyweights like HDFC Bank, ICICI Bank, and Reliance Industries.
Despite lingering global uncertainties, market sentiment remained stable, with the India VIX closing at 13.67—reflecting subdued volatility and cautious optimism among participants.
In the derivatives space, the highest concentration of put writing at the 25,000 strike highlights strong immediate support, while the 25,500 level is emerging as a key resistance zone due to significant call writing activity.
Heading into the upcoming expiry week, the bullish trend is likely to continue, provided no major geopolitical shocks disrupt market sentiment.
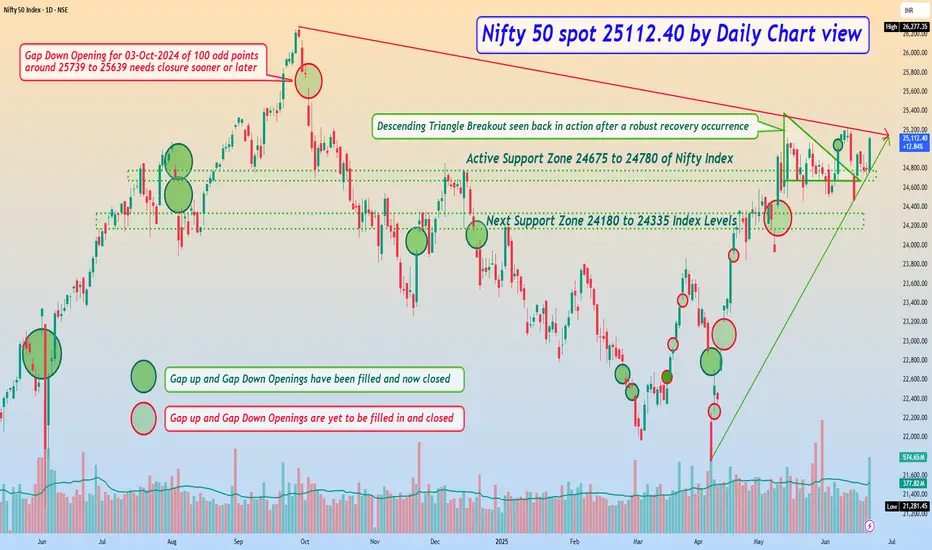
Nifty 50 spot 25112.40 by Daily Chart view - Weekly update*Nifty 50 spot 25112.40 by Daily Chart view - Weekly update*
- Active Support Zone 24675 to 24780 of Nifty Index
- Next Support Zone 24180 to 24335 of Nifty Index Levels
- Resistance Zone seen at 25200 to 25335 of Nifty 50 Index Levels
- Descending Triangle Breakout seen back in action after a robust recovery occurrence
- *Rising Support Trendline seems to have come into active mode but yet needs a stronghold*
Nifty 50 spot 24112.40 by Daily Chart view - Weekly update**Nifty 50 spot 24112.40 by Daily Chart view - Weekly update*
- Active Support Zone 24675 to 24780 of Nifty Index
- Next Support Zone 24180 to 24335 of Nifty Index Levels
- Resistance Zone seen at 25200 to 25335 of Nifty 50 Index Levels
- Descending Triangle Breakout seen back in action after a robust recovery occurrence
- *Rising Support Trendline seems to have come into active mode but yet needs a stronghold*

Nifty Thought Process and Analysis (Multi-Timeframe Breakdown)🔹 4H Timeframe (Intraday to Short-Term Swing)
Current Price: ~24,807
Price is consolidating inside a liquidity pocket just below a Fair Value Gap (FVG) zone.
Sell-side liquidity has already been swept; signs of accumulation are visible.
Three internal FVGs identified—market is respecting these inefficiencies.
Volume imbalance + EQ (Equal Lows) and previous OB (Order Block) show that price may be building a base.
Market Structure: Minor BOS (Break of Structure) observed, but no new HH yet — compression inside a range.
✅ Bullish Bias IF price breaks above the FVG range and mitigates the supply.
📌 Long Setup Idea:
Entry: Above 24,900
Stop Loss: Below EQ/FVG (~24,650)
Target: 25,200–25,400 (Buy-side liquidity/weak high zone)
📛 Invalidation: Clean break below EQ zone + OB → indicates bearish continuation.
🔹 Daily Timeframe (Swing View)
Price respected the sell-side liquidity grab and is now consolidating within a bearish FVG range.
Minor BOS confirms short-term bullish correction, but macro context is mixed.
PWL (Previous Week Low) has been swept, giving confluence to bullish short-term reversal.
Upper FVG near 25,100–25,200 remains unmitigated.
🧠 Key Observation: Smart money often reverses price after sweeping liquidity → the VI (Volume Imbalance) zone may act as a launchpad.
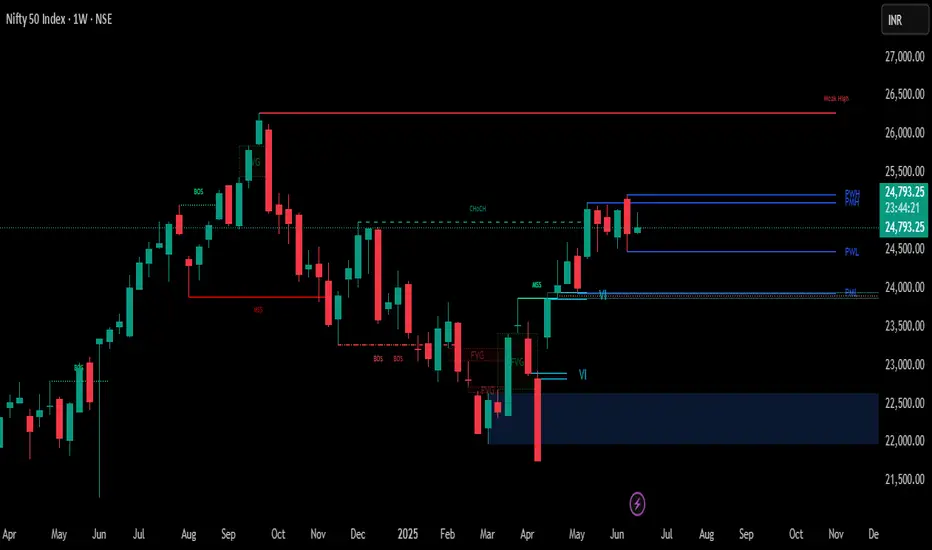
🔹 Weekly Timeframe (Macro Structure)
Structure remains bullish with strong upside momentum since the March-April reversal.
Change of Character (ChoCH) in April is confirmed with multiple BOS candles.
Current price is holding above the weekly FVG + VI.
A large bullish OB sits between 22,400–22,800, indicating massive institutional accumulation.
📈 Weekly Bias: As long as price stays above 24,400, bullish targets of 25,600 are possible in coming weeks.
🧩 Conclusion & Trade Idea Summary (ICT-based)
Bias: Bullish (Short-term accumulation, preparing for expansion)
Entry: Break and close above 24,900 on 4H or Daily
Stop Loss: 24,640 (Below EQ zone/FVG boundary)
TP1: 25,200 (Buy-side liquidity)
TP2: 25,400–25,600 (Weekly premium zone/weak high)
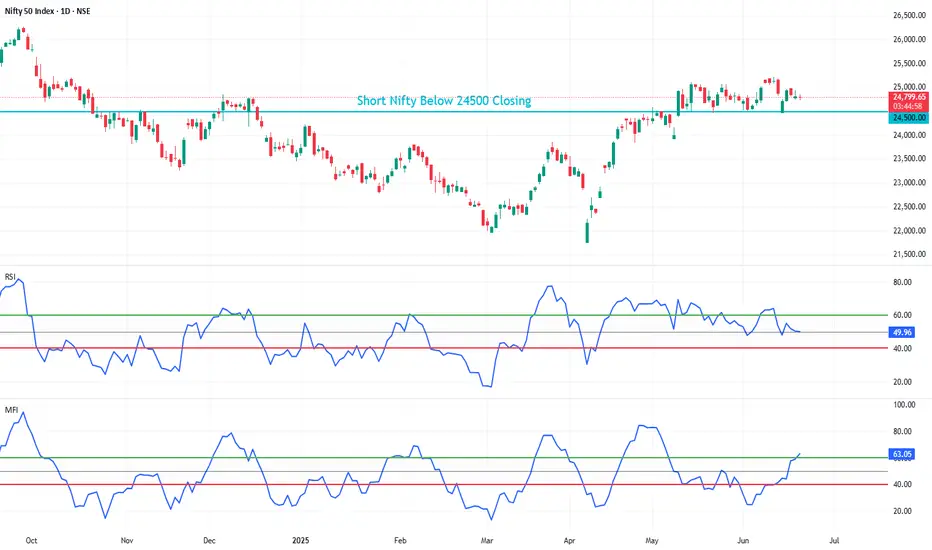
NIFTY (OVERALL MARKET) SETUP FOR SHORTING Please don't look for longs if nifty breaks below 24500, if it is above 24500 then you can see signs of recovery and re-asses your trades but untill then please wait for nifty to fall below 24500₹ levels to short
If nifty breaks then overall markets fall, for better optimization look for stocks now which you think are overvalued now
and then when nifty breaks 24500 then sell or buy PE (any ways you want to) that overvalued stock because that will usually have a larger fall if markets fall.
Please be prepared apart from your daily trading !!
May you all be happy, May you all be profitable :)
Nifty - Intraday levels & Prediction for - 18 Jun 2025Nifty Prediction for Tomorrow:
Trend : BEARISH Breakout
Sentiment : Negative
Expectation : Nifty closed below 24900, expecting BEARISH breakout tomorrow. Any close above 2510 only its Bullish trend, and price will move to test 25200.
Look for Buy/Sell at Demand and Supply zone for profitable trades.
Demand and Supply Zones - When price breaks the zone, Demand zone will become Resistance and Supply zone will become Support. If Nifty Sustains above 24900 tomorrow we can see good rally upto 25080 Resistance. Any breakout above 25100 and next resistance 25200
Refer the chart for detailed Intraday Support and Resistance levels.
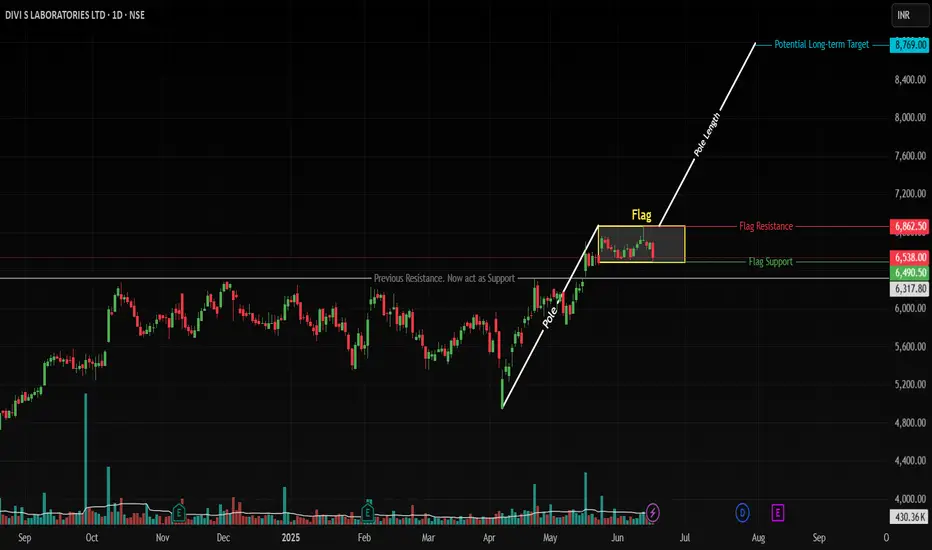
DIVISLAB: Flag & Pole Breakout Setup Targets New ATHsNSE: DIVISLAB | Pharmaceuticals | Large Cap | Updated: June 17, 2025
📊 Technical Structure
Pole Formation: Rally from 4,955 → 6,862 (1,907 points) on high volume
Flag Consolidation: Tight range between 6,490 (support) and 6,800 (resistance)
Key Breakout Trigger: Daily close above 6,862 (ATH)
Pattern Target: 8,769 (6,862 + 1,907 pole length)
Critical Support: 6,300 (confirmed swing low)
🎯 Price Targets & Roadmap
Immediate Target: 7,200 (2024 swing high)
Strong Resistance Zone: 7,600-7,750 (analysts ceiling)
Pattern Target: 8,769 (100% pole extension)
Confirmation Required for 8,769:
• Breakout volume >650K (20% above 20D avg)
• Pharma sector PE >42 (currently 39.2)
⚡ Trade Strategy
Scenario 1: ATH Breakout (Preferred)
Entry: Daily close above 6,862 (6,880-6,900 zone)
Targets:
• 7,200 (book 30% profits)
• 7,600 (book 50% profits)
• 8,769 (full exit)
Stop Loss: 6,700
Scenario 2: Flag Breakdown
Entry: 6,300-6,160 (50-DMA confluence)
Target: 6,800 flag retest → 7,200
Stop Loss: 6,050
Risk Management Essentials: Max 2% capital per trade
⚖️ Fundamental Drivers
Strengths:
• 15.4% ROE (vs sector 12.1%)
• 17% EPS growth (FY26E)
• FII holdings ↑2.1% YoY to 18.01%
Risks:
• High PE 79.2 (sector 39.2)
• Overbought risk above 7,600
⚠️ Critical Risks
Valuation Risk: Profit-booking likely near 7,600
Sector Risk: Pharma index seasonality (+4.91% avg June)
📉 Real-Time Levels
Current Price: ₹6,538 (-2.24% today)
Support: 6,490 (flag base) → 6,300 (swing flip)
Resistance: 6,800 (flag top) → 6,862 (ATH)
Volume Alert: Breakout requires >650K shares
✅ Conclusion
DIVISLAB offers a high-reward setup with defined risk parameters. The flag breakout above 6862 is the preferred play, backed by sector leadership and earnings growth. Always hedge with stops—overvaluation remains a concern.
📜 Disclaimer
This analysis represents my personal market view and not investment advice. Trading carries significant risk of capital loss. Past performance doesn't guarantee future results. Always:
Conduct your own due diligence
Consider your risk tolerance
Consult a SEBI-certified advisor
Verify real-time data before acting
Never risk more than you can afford to lose.
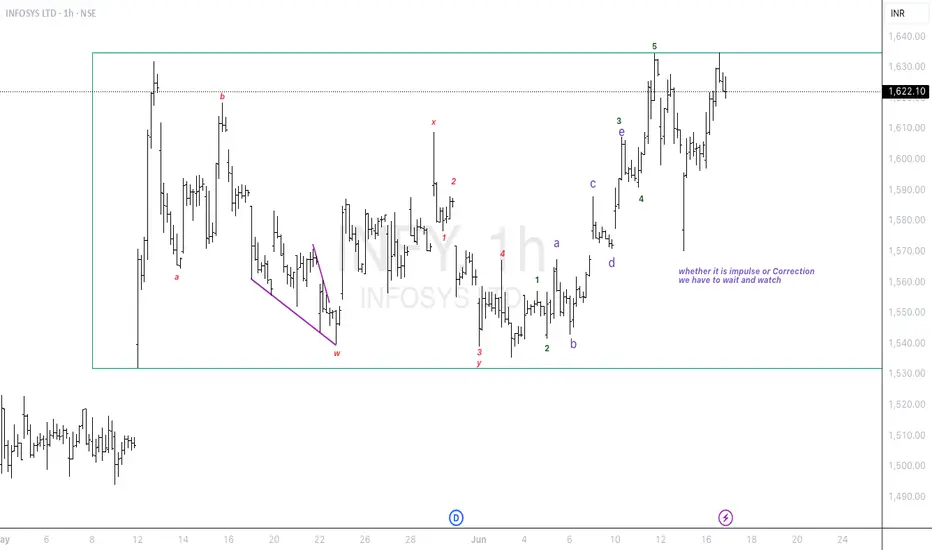
Infosys impulse or correction continuation.....
Elliott Wave Analysis:-
Possibility no.1:-
A corretion has been completed. Now an impulse wave has beed arised.
Possibility no.2:-
After the correction of WXY wave there may be a correction continuation which may form WXYXZ. We have to wait and watch the structure formation.
I am not a SEBI registered advisor. Before taking a trade do your own analysis or consult a financial advisor. I share chart for education purpose only. I share my trade setup.