Nifty weekly analysis - Detailed Last week Nifty had strong downfall of ~3% because of various factors including global events and selling of FIIs. Week closed with a strong bearish candle with heavy volume showing further downside pressure targeting near draw on liquidity of ~24600. This level has highest volume, which will act as magnet for price.
Order flow is also downside creating lower highs.
Currently price is inside weekly price imbalance zone and at a psychological number of 25000. So, we can expect a pause at this level for few days. So next week may go in range bound mode to bearish.
Over all sentiments are bearish until there is a big positive change appears in global politics.
Critical points ……………….
• Support zone: 24,580–25,050
• Resistance zone: 25,550–25,600
• Bias: Range-bound to mildly bearish for the coming week.
1. If breakout support with volume we may see 24600 levels soon.
Note – if you liked this analysis, please boost the idea so that other can also get benefit of it.
Also follow me for notification for incoming ideas.
Also Feel free to comment if you have any input to share.
Disclaimer: This analysis is for educational purposes only and does not constitute investment advice. Please do your own research (DYOR) and check with your financial advisor before making any trading decisions.
Niftyanalysis

Lets Talk about Nifty, Midcaps, Smallcaps and Banknifty A very general talk on the charts and where they are - more of a awareness sort of video- to exactly know where we are trading in terms of index . I make educational content videos for trading

NIFTY – Bearish Structure Playing Out as AnticipatedIn my previous posts, I had clearly highlighted the possibility of a trend shift and warned that the ongoing price action could resolve to the downside. Over the last few sessions, price has started to play out exactly along those lines.
1. Bearish crossover (mini death cross)
A bearish crossover between the short-term and medium-term moving averages has now occurred. This was already anticipated and mentioned in earlier posts, and it marks a loss of bullish momentum after the ATH zone.
2. Clean breakdown below key support
Price has decisively broken below an important support and trendline structure. This confirms the bearish bias and strengthens the view that the broader market is under distribution rather than accumulation.
3. Next immediate support zone
The marked zone below acts as the next immediate support, where we may expect temporary consolidation or a technical bounce. However, unless there is strong follow-through buying, this should be treated cautiously.
4. Caution on bullish moves
Any signs of bullishness from here are likely to be temporary retracements, which may eventually trigger further sell-offs.
➡️ Avoid fresh swing longs until overall market sentiment turns favorable.
➡️ Existing positions should be managed with strict stop-losses and disciplined risk management.
The market is behaving in line with what was discussed earlier. Until structure changes and strength is proven, the risk remains on the downside. Patience and capital protection are more important than chasing trades in such phases.
📢📢📢
If my perspective changes or if I gather additional fundamental data that influences my views, I will provide updates accordingly.
Thank you for following along with this journey, and I remain committed to sharing insights and updates as my trading strategy evolves. As always, please feel free to reach out with any questions or comments.
Other posts related to this particular position and scrip, if any, will be attached underneath. Do check those out too.
Disclaimer : The analysis shared here is for informational purposes only and should not be considered as financial advice. Trading in all markets carries inherent risks, and past performance is not indicative of future results. It’s essential to conduct your own research and assess your risk tolerance before making any investment decisions. The views expressed in this analysis are solely mine. It’s important to note that I am not a SEBI registered analyst, so the analysis provided does not constitute formal investment advice under SEBI regulations.

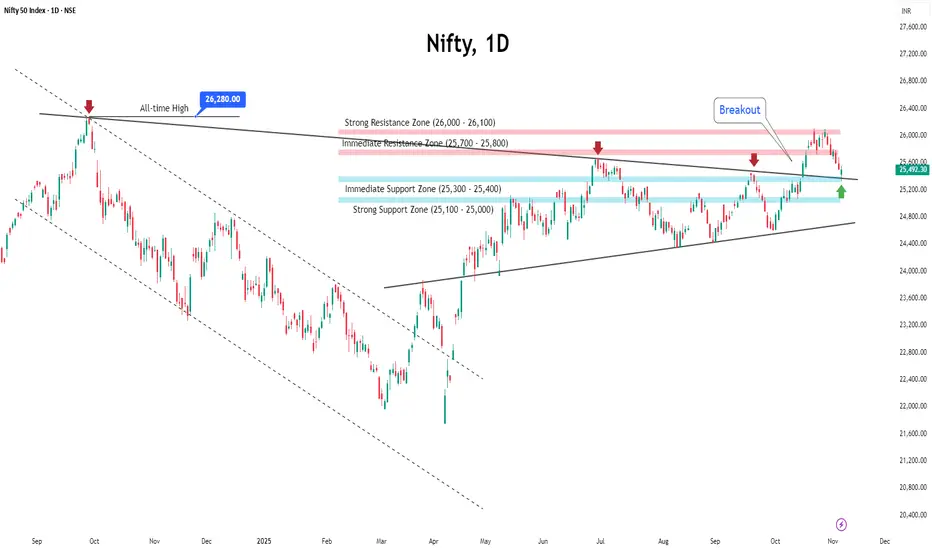
Indian Markets on Hold: Nifty Awaits the Next Big TriggerIndian markets remained range-bound last week, with the Nifty ending on a flat note. Participants stayed cautious as volatility showed early signs of revival, with India VIX inching up to 11.37.
◉ Technical Setup
From a technical standpoint, the index briefly slipped below the rising wedge support, but the move failed to attract strong selling pressure. Nifty continues to consolidate in a narrow band, suggesting indecision rather than a trend reversal.
This phase of consolidation is likely to extend into the coming week unless key levels are breached.
◉ Key Levels to Watch
The broader structure remains unchanged from last week.
Resistance: 26,000–26,100
Strong call writing in this zone makes it a tough hurdle.
Support: 25,500–25,400
A solid put base is visible here, offering near-term support.
A decisive break below 25,400 could open the door for a sharp downside move, pulling the index closer to 25,000.
◉ Key Triggers for the Week
Q3 Earnings Season – Results from large and mid-cap companies across sectors will guide stock-specific action and influence overall market sentiment.
India–US Trade Deal – Comments or policy moves around trade negotiations, especially related to agricultural tariffs, could impact sentiment and sectoral stocks.
◉ Weekly Outlook
The near-term outlook remains neutral, with Nifty expected to trade within a defined range until a decisive breakout or breakdown occurs.
◉ Trader’s Insight
Until Nifty decisively holds above 26,000, aggressive long positions across the board should be avoided. A selective, stock-specific approach, backed by strict risk management, is better suited to the current market environment.

NIFTY : Bearish Territory - Caution AdvisedA potential bearish crossover between the 20-day and 50-day EMAs signals weakness. If this crossover confirms, deeper downside levels cannot be ruled out.
The market is currently about to test an important support zone. A decisive breakdown below this level could open the door for further selling pressure.
Any short-term bullish move should be approached with caution. These may not be true reversals but retracements within a broader downtrend, potentially leading to renewed sell-offs.
A sustainable bullish move can only be confirmed if:
The 20-day EMA moves above the 50-day EMA, and
Price breaks and closes above both EMAs with strong momentum
Until these conditions are met, it’s prudent to avoid fresh swing positions.
🔒 Risk Management First
For existing positions, maintain strict stop losses and manage risk proactively. Capital protection should remain the priority in such volatile conditions.
📌 Market is offering clarity — patience and discipline will be rewarded.
📢📢📢
If my perspective changes or if I gather additional fundamental data that influences my views, I will provide updates accordingly.
Thank you for following along with this journey, and I remain committed to sharing insights and updates as my trading strategy evolves. As always, please feel free to reach out with any questions or comments.
Other posts related to this particular position and scrip, if any, will be attached underneath. Do check those out too.
Disclaimer : The analysis shared here is for informational purposes only and should not be considered as financial advice. Trading in all markets carries inherent risks, and past performance is not indicative of future results. It’s essential to conduct your own research and assess your risk tolerance before making any investment decisions. The views expressed in this analysis are solely mine. It’s important to note that I am not a SEBI registered analyst, so the analysis provided does not constitute formal investment advice under SEBI regulations.

Nifty Hits a New Peak: Is the Next Leg Up Around the Corner?Indian equities kicked off the New Year with confidence, gaining nearly 1% and finally breaking out of a five-week consolidation phase. After a slow and mixed start, a strong rebound in the latter half of the week pushed the Nifty to a fresh all-time high of 26,329.
Volatility ticked up slightly, with India VIX rising 3.28% to 9.45, but it continues to remain at comfortable, historically low levels.
◉ Technical Outlook
As highlighted earlier, the Cup & Handle pattern has now taken a clearer shape. A decisive breakout and sustained move above the neckline could trigger the next leg of the rally.
◉ Key Levels to Watch
● Resistance: 26,500 – 26,600 (heavy call writing zone)
● Immediate Support: 26,100 – 26,200
● Strong Support: 25,900 – 26,000 (heavy put writing zone)
◉ Near-Term View
Nifty is likely to consolidate within a 300-point range, broadly between 26,200 and 26,500, as the market digests recent gains.
◉ Key Trigger to Watch
Global cues remain important. Markets will closely monitor developments after reports of US military strikes on Venezuela, which could influence sentiment in the coming sessions.
◉ Trading Strategy
Expect mild profit-taking at higher levels. Avoid aggressive fresh buying, protect existing gains, and stay selective by focusing on stocks showing relative strength.

Nifty50 and Overall Market analysisIn this video, we discuss Nifty50 and Overall Market analysis
Current market scenario
Long term vs Short term chart analysis
Major sector index analysis and my views on them
Long term vs Short term Investment approach

NIFTY Intraday Trade Setup For 30 Dec 2025NIFTY Intraday Trade Setup For 30 Dec 2025
Bullish-Above 26050
Invalid-Below 26000
T- 26260
Bearish-Below 25900
Invalid-Above 25950
T- 25650
We discussed that index may test 25900 below 26110, triggered and reached. Last week a shooting star candle has been formed in weekly TF. Now below 25900 index may extend the move till 25650. Bullish move can be seen if index sustains above 26050. 50 EMA in daily TF can be a confluence zone, break of which will trigger a short term bearishness in overall market. Plan the view on 15 Min candle close.
I am Not SEBI Registered
This is my personal analysis for my personal trading. Kindly consult your financial advisor before taking any actions based on this.

NIFTY Set to Sign Off 2025 Quietly—Could 2026 Bring a Rally?As we enter the last week of 2025 and approach the first week of 2026, Nifty is doing something familiar—consolidating in a tight range.
Everything looks calm at first glance: volatility is very low (India VIX at 9.15), trading volumes are light, and price changes are small. But history shows that such calm often comes before a big move.
◉ What it means actually?
● Nifty near lifetime highs, but breadth remains weak
● Low volatility → calm market, but risk of sudden moves
● Traders aren’t chasing the market, they’re waiting for a trigger rather than pushing prices higher.
◉ Technical View
● From a technical standpoint, Nifty continues to trade within a rising wedge pattern, which carries bearish implications in the short term.
● Looking at the broader structure, a cup-and-handle pattern is forming, typically pointing to a potential upside move once the neckline is decisively breached.
◉ Important Levels to Watch
● Immediate Resistance: 26,100 - 26,200
● Immediate Support: 25,900 - 26,000
Strong breakout or breakdown from here will decide the next big leg.
◉ Looking Ahead
As 2026 begins, markets will closely track:
● FOMC minutes, which could influence global rate expectations.
● Rupee movement and FII flows, key drivers of short-term sentiment.
◉ Strategy Insight
Until fresh catalysts emerge, markets may stay range-bound as they digest year-end positioning. With volatility compressed, stock-specific strategies and relative-strength setups may offer better opportunities than broad index trades.

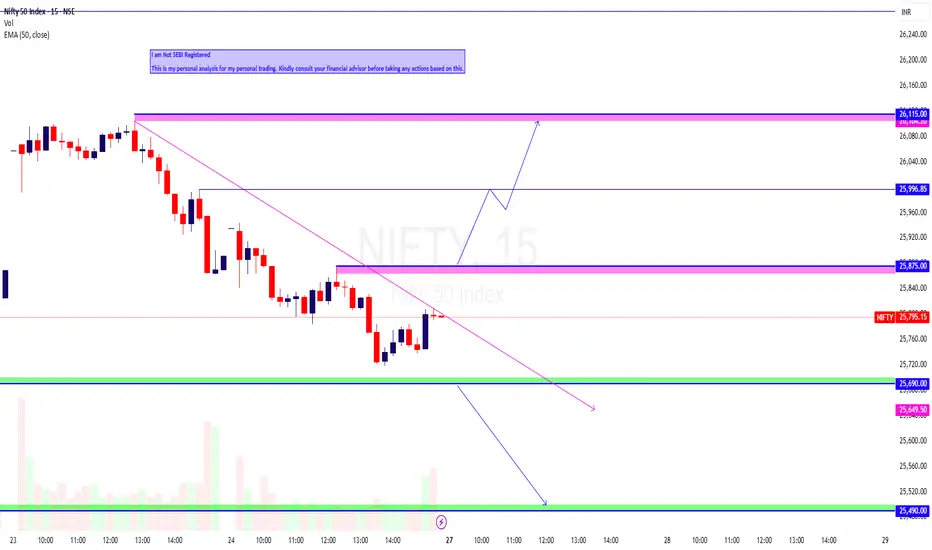
NIFTY Intraday Trade Setup For 26 Dec 2025NIFTY Intraday Trade Setup For 26 Dec 2025
Bullish- Above 26250
Invalid-Below 26200
T- 26370-450
Bearish-Below 26110
Invalid-Above 26160
T- 25935
NIFTY has closed on a slight bearish note last day, ending near day low. Below 26110 there is a chance of gap filling towards 25930 zone, strong support placed at 25900. On flat opening short below 26110 on a 15 Min candle close. In case index surprises bears above 26350, then index will shot up towards 26450 zone. Buy above 26350 on a 15 Min candle close. Intraday support lies near 25930-25950 and resistance at 26450. Index is in bulls grip overall.
I am Not SEBI Registered
This is my personal analysis for my personal trading. Kindly consult your financial advisor before taking any actions based on this.

NIFTY: Calm Before the Next Big Move?After a choppy end to last week, Nifty closed marginally lower, firmly stuck in a tight range of 25,700 – 26,100. Volatility has dipped sharply (India VIX near multi-year lows), which usually means calm before the next directional move.
◉ Technical Snapshot
Nifty continues to trade within a rising wedge pattern and has bounced back from its trendline support, suggesting buyers are still active at lower levels — but conviction is missing.
◉ Key Levels
● Immediate Support: 25,700 – 25,800
Strong put writing in this zone indicates solid downside support.
● Immediate Resistance: 26,000 – 26,100
Heavy call writing here signals supply and hesitation near the top.
◉ Short-Term outlook
● Bullish bias above 26,100: Could fast-track rally to new short-term highs.
● Stuck inside range: Expect sideways, choppy action with stock-specific moves.
● Break below 25,700: Risk of sharper correction increases.
◉ Trader’s Edge
This week is all about range resolution. Until Nifty delivers a clean breakout or breakdown, the smartest approach is to trade the range, keep tight stop-losses, and book profits without getting greedy.

NIFTY at a Pause: Consolidation Shapes the Near-Term TrendIndian equity markets ended the week on a slightly softer note, with the benchmark NIFTY slipping 0.53% on a weekly basis. While a supportive rate cut by the US Federal Reserve helped improve global sentiment and led to two consecutive sessions of gains, the broader trend remains mixed.
Adding to this, India VIX dropped 2.01% to 10.11, suggesting calm market conditions.
◉ Technical Setup: Key Pattern in Focus
On the daily chart, NIFTY is forming a rising wedge pattern and has recently bounced from its trendline support.
● Typically, a rising wedge reflects bearish undertones, especially near maturity.
● However, if the index manages to break above the upper resistance line and sustain, it could invalidate the bearish setup and shift sentiment positively.
● On the flip side, a decisive breakdown below support may open the door for a meaningful correction in the coming sessions.
◉ Important Levels to Watch
Based on open interest data, two critical zones are emerging as key for the current monthly expiry:
● Strong Support: 25,900 – 26,000
● Strong Resistance: 26,400 – 26,500
With no major triggers visible in the near term, NIFTY is likely to remain range-bound, consolidating between these levels.
◉ Strategy: Trade Smart, Stay Selective
Traders should maintain a moderately cautious stance in the current setup.
● Book or protect profits near higher levels.
● Avoid aggressive long positions until a clear breakout above 26,400–26,500 is confirmed.
● Prefer a stock-specific approach, focusing on names showing relative strength, while keeping risk management front and center.

Weekly analysis of Nifty...Here is weekly analysis of Nifty...
Please do follow me if you liked the idea💡...
Disclaimer ⚠️: This analysis is for educational purposes only and does not constitute investment advice. Please do your own research (DYOR) and check with your financial advisor before making any trading decisions ⚠️⚠️.

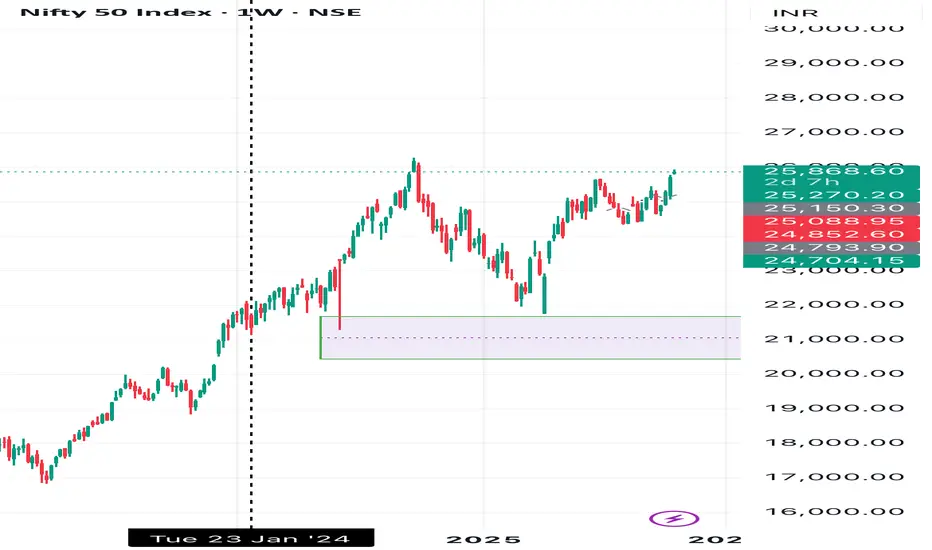
Nifty Holds Support — Is a Fresh Momentum Wave Ahead?The Nifty ended last week almost flat, up 0.6% at 26,186. The index started weak due to profit-booking, FII outflows, and a record-low rupee, but sentiment improved after the RBI cut the repo rate by 25 bps to 5.25%.
Adding to the positive tone, India VIX dropped over 11% to 10.315, highlighting a sharp cooling in volatility and a more stable trading environment.
◉ Technical Setup
Nifty has once again respected its strong support zone between 25,900 and 26,000, bouncing firmly from this level. This zone is expected to remain a key cushion for the coming week as well.
On the upside, the index faces a strong resistance around 26,400–26,500, which will be crucial to watch. A breakout above this could unlock further strength.
For now, the market is likely to trade within this range, oscillating between support and resistance until a clear signal emerges.
◉ Key Trigger This Week
US Fed Meeting (Dec 9–10)
Markets expect a 25 bps rate cut, but mixed signals from Fed officials keep uncertainty high.
A hawkish tone could weigh on global sentiment.
A dovish stance would likely support global markets, especially India.
◉ Suggested Strategy
Investors should adopt a balanced and selective approach:
Favour large caps and sectors that stand to benefit from the RBI rate cut, such as financials and autos,
Export and IT stocks may continue to draw support from the weaker rupee.
For traders, buy-on-dips remains the preferred strategy near strong support levels. Focus on stock-specific setups, maintain moderate position sizes, and stay flexible ahead of the crucial FOMC outcome.
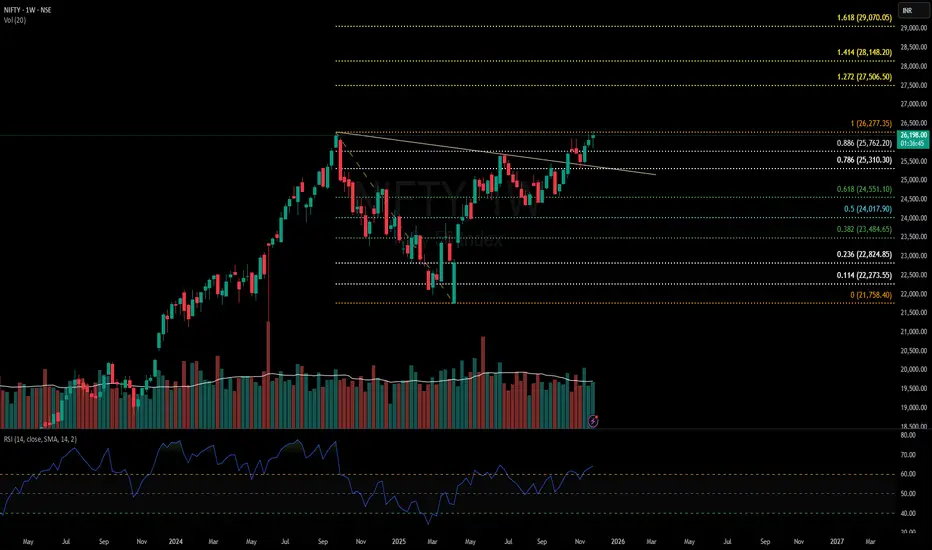
NIfty50 Analysis: Is it start of new bull run or a bull trap?Nifty50 Has given a cup& handle breakout and has already retested this breakout.
Currently, it is hovering near ATH and already looks ready for a breakout.
If this breakout sustains, we might see a good rally coming till budget(Feb'26) and levels to watch according to fib are 27500, 28150 & 29000.
However, December is a favourite season for FIIs to offload money and a correction is historically seen during Christmas season. So, there is a high probability of a bull trap formation as well.
25300 will be a crucial support for Nifty. a breakdown of this level will be confirmation of bull trap and we might see a sharp fall towards 24000 level.
I will suggest to keep a watch on Nifty price action if you have any swing trades open.
Nifty Breaks Key Support at 25920 — Bears Take the Wheel!Nifty has decisively broken below the crucial support zone at 25920, and price is currently holding under this level—an early sign that bearish momentum may continue. As long as 25975 remains unbroken on the upside, the short-term bias stays negative.
A potential short opportunity may emerge on retests or continued rejection below 25920, with price targets at:
TP1: 25850
TP2: 25800
This setup remains valid unless Nifty reclaims and sustains above 25975.
📌 Disclaimer:
This analysis is for educational purposes only and is not financial advice. Always manage risk and follow your trading plan.
Your feedback drives our content and keeps everyone trading smarter. Let’s make those pips together! 🚀
Happy Trading,
– The InvestPro Team

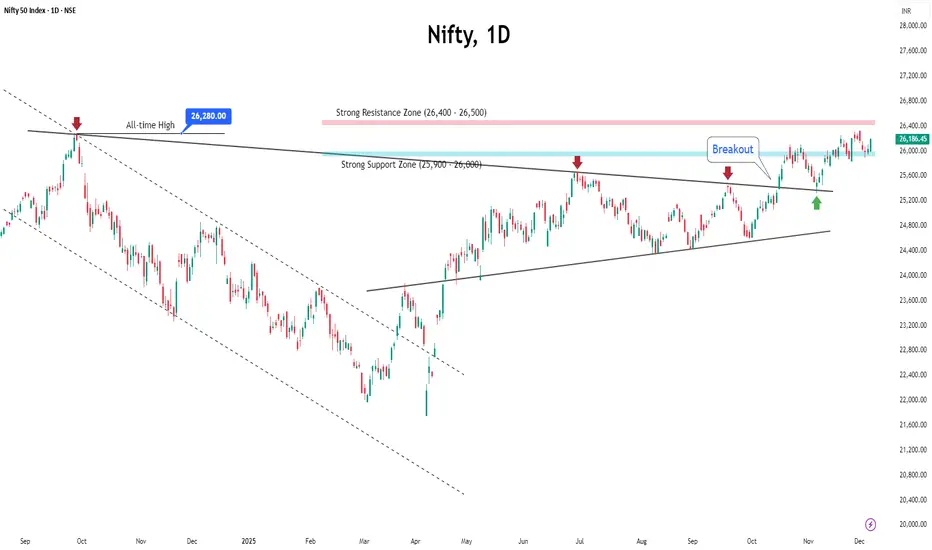
Nifty Builds Momentum, Breakout Looks Within ReachThe Indian market ended last week on a positive note, supported by the stronger-than-expected performance of the National Democratic Alliance (NDA) in the 2025 Bihar elections.
Nifty jumped over 1.5% to close at 25,910, just below the key resistance level of 26,000. Volatility also eased, with the India VIX falling over 5% on a weekly basis to settle at 11.93.
Open interest data suggests that the 25,700–25,800 zone will now act as immediate support, while 25,500 remains a strong support level.
Recent price action indicates that Nifty may attempt to break above the 26,000 resistance in the coming sessions.
In the week ahead, the overall sentiment is expected to stay positive due to strong domestic cues. Globally, market direction will depend on key U.S. economic releases, including the minutes of the latest FOMC meeting.
Investors should stick to a stock-specific approach, focusing on sectors supported by domestic demand. For traders, a buy-on-dips strategy remains favourable as long as Nifty holds above its key support zones.
Nifty Slips for 2nd Week: Consolidation Ahead amid Rising VIXIndian markets ended lower for the second straight week, weighed down by persistent foreign fund outflows, mixed corporate earnings, and cautious global cues.
Nifty slipped nearly 0.8% to close at 25,490, while India VIX rose over 3% to 12.55, reflecting a slight uptick in market volatility.
Key Levels to Watch
Nifty is currently retesting the apex of its ascending triangle breakout, around the 25,300–25,400 zone. This area is supported by significant put writing, as reflected in recent open interest data, making it an important near-term support.
Below this, the next strong support lies near 25,000.
On the upside, the 25,700–25,800 zone could act as an immediate resistance due to heavy call writing, while 26,000 remains a major resistance level to watch.
Outlook
Given the current setup, markets are likely to trade within a neutral range in the coming week. Volatility may stay elevated as global uncertainties, FII outflows, and a busy flow of economic and earnings data continue to influence sentiment.
While near-term sentiment remains cautious, strong domestic macro fundamentals and steady corporate performance are expected to provide underlying support to the broader trend.
Traders are advised to stay stock-specific, focusing on banking and financials—particularly PSU banks—which continue to display relative strength.
NIFTY Intraday Trade Setup For 30 Oct 2025NIFTY Intraday Trade Setup For 30 Oct 2025
Bullish-Above 26110
Invalid-Below 26060
T- 26350
Bearish-Below 25920
Invalid-Above 25970
T- 25690
NIFTY has closed on a bullish note with 0.45% gain today. Index has been consolidating below 26100 since few days. Above 26110 index is all set for a fresh ATH. On a 15 Min candle close above 26110, plan a long for the target of 26345. 25900 zone can be a confluence zone. Plan a short below 25920 on 15 Min candle close, 25690 will be target.
In case of a big gap up/down, wait till 10 o'clock and mark the high and low of the trading range (5MIN). Trade on this range breakout.
==========
I am Not SEBI Registered
This is my personal analysis for my personal trading. Kindly consult your financial advisor before taking any actions based on this.

NIFTY - Triple Demand Zone Rebound with Strong Volume📈 NIFTY 50 – Powerful Reversal from Triple Intraday Demand Zones 💪
Date: 28th Oct 2025
Spot Price: ₹25,936.20
🔹 Resistances: 26,048 / 26,160 / 26,280
🔹 Supports: 25,816 / 25,697 / 25,585
🔹 Intraday Demand Zones:
1️⃣ 25,868 – 25,814
2️⃣ 25,809 – 25,790
3️⃣ 25,763 – 25,737
🔑 Key Highlights
Nifty witnessed a strong reversal from a cluster of three intraday demand zones.
The 25,800 region attracted heavy buying interest with a sharp volume spike.
Volume expansion at the base confirms fresh long accumulation by strong hands.
Structure suggests short-term bottoming within a broader sideways band.
Resistance around 26,048–26,160 will be the next key test for bulls.
🎯 STWP Trade View
Nifty’s recovery from these demand zones indicates buyers regaining control near lower levels.
Keep a close watch on any dips back into the demand zones — such retracements often provide high-probability opportunities for short-term traders.
As long as price sustains above 25,800, the bias stays bullish toward 26,160–26,280.
💡 Learning Note
When multiple intraday demand zones align together, they create a layered liquidity base — an area where institutions quietly accumulate positions.
Volume confirmation near such zones gives early signs of strength beneath the surface.
Final Outlook:
Momentum: Bullish recovery in progress | Trend: Range-bound but firm bias upward | Risk: | Neutral above 25,800 | Volume: Expanding — confirming active participation
________________________________________
________________________________________
⚠️ Disclosure & Disclaimer – Please Read Carefully
The information shared here is meant purely for learning and awareness. It is not a buy or sell recommendation and should not be taken as investment advice. I am not a SEBI-registered investment adviser, and all views expressed are based on personal study, chart patterns, and publicly available market data.
Trading—whether in stocks or options—carries risk. Markets can move unexpectedly, and losses can sometimes exceed the money you have invested. Past performance or past setups do not guarantee future results.
If you are a beginner, treat this as a guide to understand how the market works and practice on paper trades before risking real money. If you are experienced, always assess your own risk, position sizing, and strategy suitability before entering trades.
Consult a SEBI-registered financial adviser before making any real trading decision. By engaging with this content, you acknowledge full responsibility for your trades and investments.
Position Status: No active position in NIFTY at the time of analysis.
Data Source: TradingView & NSE India (Past Chart Reference) (Historical levels)
💬 Found this useful?
🔼 Give this post a Boost to help more traders discover clean, structured learning.
✍️ Drop your thoughts, questions, or setups in the comments — let’s grow together!
🔁 Share with fellow traders and beginners to spread awareness.
👉 “If you liked this breakdown, follow for more clean, structured setups with discipline at the core.”
🚀 Stay Calm. Stay Clean. Trade With Patience.
Trade Smart | Learn Zones | Be Self-Reliant 📊

NIFTY Intraday Trade Setup For 27 Oct 2025NIFTY Intraday Trade Setup For 27 Oct 2025
Bullish-Above 25900
Invalid-Below 25850
T- 26115
Bearish- Below 25690
Invalid-Above 25740
T- 25490
NIFTY has closed with a slight bearish sentiment last week, a shooting star formed near ATH zone. 25500 will be a strong support zone for next week as its 0.382% of the recent leg of rally. In 15 Min TF it has been simple bearish structure. On Monday above 25900 in 15 Min TF trend may change to bullish again, it will be best if followed by a rejection at first attempt. On flat opening below 25690 in 15 Min TF, index will test 25490.
In case of a big gap up/down, wait till 10 o'clock and mark the high and low of the trading range (5MIN). Trade on this range breakout.
==========
I am Not SEBI Registered
This is my personal analysis for my personal trading. Kindly consult your financial advisor before taking any actions based on this.
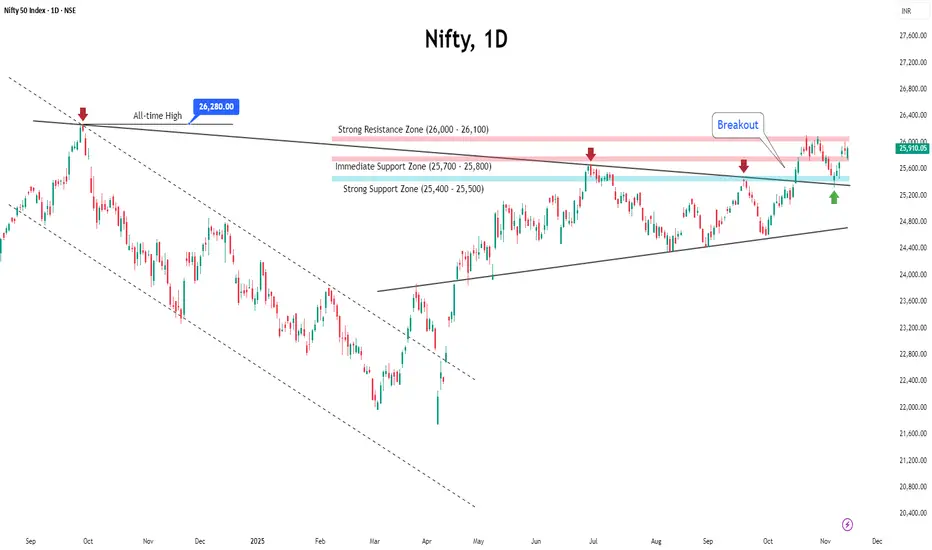
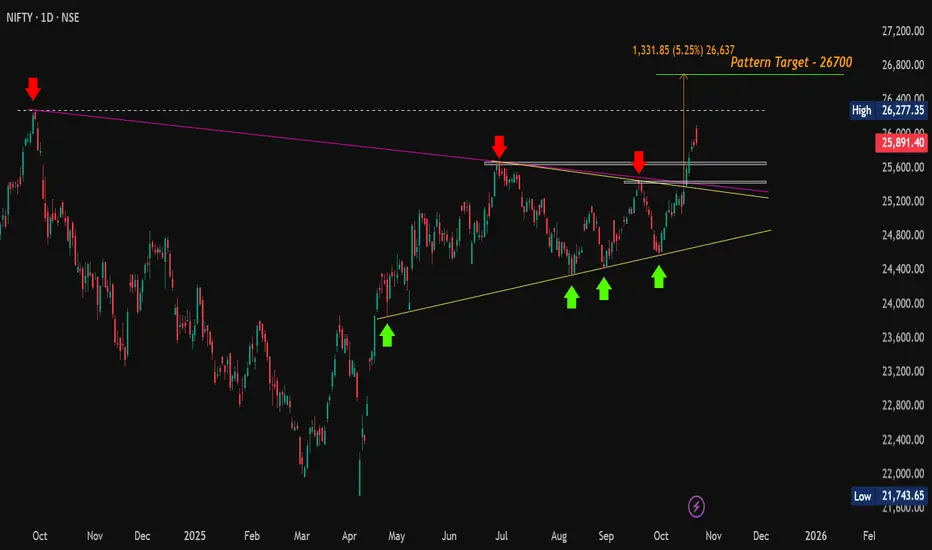
#Nifty | Breakout Confirmed, Now Eyes on Support for Next Move#Nifty Update (Daily):
CMP: 25,891.40
Following our previous update at 25,285, Nifty has decisively broken out above the Symmetrical Triangle pattern and surged to a high of 26,104 today. Price action formed a bearish candle but managed to close positively on the daily chart.
🔄 What to expect next?
A potential retest of breakout levels is likely as profit booking is expected after a strong rally of over 1,500 points from the swing low. Watch the key support zones closely for a possible bounce.
🔽 Support Zones to watch :
25,669 - 25,638
25,449 - 25,424
⚡️ If Nifty holds these levels and reverses, it could set the stage for a renewed upmove aimed at surpassing the all-time high (ATH) at 26,277.
🔼 Resistance Zones to watch :
26,104 (recent high)
26,216 - 26,277 (ATH)
📈 A sustained break above the ATH will confirm continuation toward the symmetrical triangle’s ultimate target near 26,700 .
#Nifty | #Nifty50 | #BreakOutRetest | #SymmetricalTriangle | #ChartPatterns | #SwingTrading | #PriceAction
📌 Disclaimer: This analysis is shared for educational purposes only. It is not a buy/sell recommendation. Please do your own research before making any trading decisions.
Nifty Testing Major Fibonacci Confluence Zone – Possible ShakeouNifty has recently retested a key Fibonacci retracement level, which coincides with a well-defined supply zone on the higher timeframe. The price action suggests strong resistance absorption in this area, followed by a period of sideways consolidation — often a precursor to a decisive move.
Unlike previous market cycles, the Indian indices are showing relative strength and reduced correlation with US markets, indicating a potential domestic-driven breakout scenario.
A short-term shakeout or liquidity hunt cannot be ruled out before the index establishes a clear direction. If the current structure holds, we could see a one-sided rally towards the 32,488 zone in the upcoming sessions.
📊 This is my personal technical view, not financial advice.
⚠️ I am not a SEBI-registered analyst. Please do your own research and risk assessment before taking any trades.