#NIFTY Intraday Support and Resistance Levels -06/08/2024Nifty will be gap up opening in today's session. After opening nifty sustain above 24300 level and then possible upside rally up to 24420 level in today's session. in case nifty trades below 24250 level then the downside target can go up to the 24130 level.
Niftychartpattern

#NIFTY Intraday Support and Resistance Levels -05/08/2024Nifty will be gap down opening in today's session. After opening nifty start trading Below 24450 level and then possible downside rally up to 24330 in today's session. in case nifty trades Above 24500 level then the upside target can go up to the 24620 level.

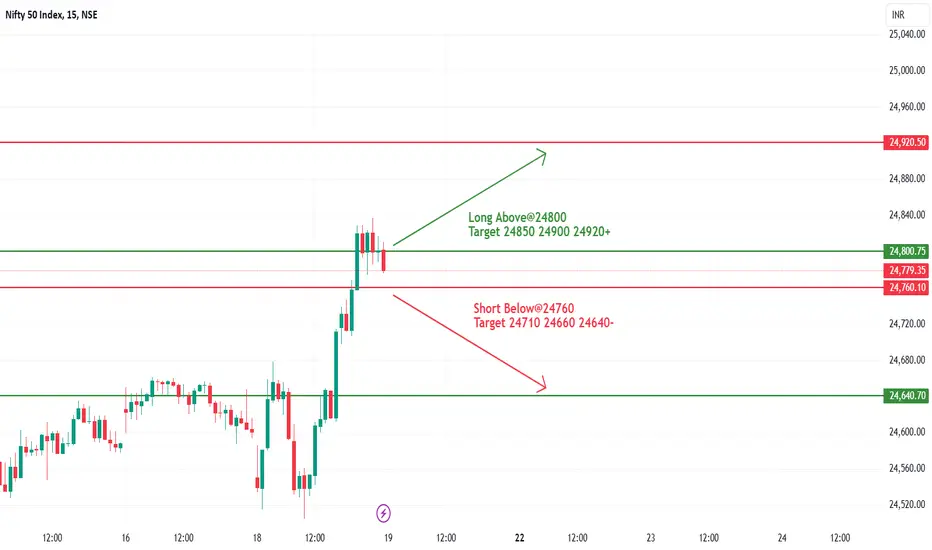
#NIFTY Intraday Support and Resistance Levels -19/07/2024Nifty will be gap up opening in today's session. After opening nifty sustain above 24800 level and then possible upside rally up to 24920 level in today's session. in case nifty trades below 24760 level then the downside target can go up to the 24640 level.
#NIFTY Intraday Support and Resistance Levels -05/07/2024Nifty will be gap up opening in today's session. After opening nifty sustain above 24320 level and then possible upside rally up to 24440 level in today's session. in case nifty trades below 24280 level then the downside target can go up to the 24160 level.

#Nifty Trading Important levelsOn 1 Day Timeframe, NIFTY trading important levels. Time to wait for either breakout or Breakdown (reversal) for the Nifty.
Breakdown Move
- Confirmation for breakdown will be if Nifty starts trading and sustain below 23030 level
- Downside rally nearly 800 points expected in case of breakdown
- Intermediate support expected near 22475- level
- Short Trader can place there stop loss if Nifty starts trading above 23182 level
Breakout move
- Long side movement expected in case Nifty starts trading and sustain above 23182 level
- Above this level Nifty can go upto the 24220+ level.
- Intermediate resistance expected near 23850 level
- Long trader can place there stop loss if Nifty starts trading below 23030 level.

#NIFTY Intraday Support and Resistance Levels -31/05/2024Nifty will be gap up opening in today's session. After opening nifty sustain above 22570 level and then possible upside rally up to 22690 level in today's session. in case nifty trades below 22520 level then the downside target can go up to the 22400 level.

#NIFTY Intraday Support and Resistance Levels -27/05/2024Nifty will be gap up opening in today's session. After opening nifty sustain above 22990 level and then possible upside rally up to 23110 level in today's session. in case nifty trades below 22930 level then the downside target can go up to the 22810 level.

#NIFTY Intraday Support and Resistance Levels -06/05/2024Nifty will be gap up opening in today's session. After opening nifty sustain above 22480 level and then possible upside rally up to 22600 level in today's session. in case nifty trades below 22440 level then the downside target can go up to the 22320 level.

#NIFTY Intraday Support and Resistance Levels -26/04/2024Nifty will be gap up opening in today's session. After opening nifty sustain above 22580 level and then possible upside rally up to 22700 level in today's session. in case nifty trades below 22530 level then the downside target can go up to the 22410 level.

#NIFTY Intraday Support and Resistance Levels -25/04/2024Nifty will be gap down opening in today's session. After opening nifty start trading Below 22380 level and then possible downside rally up to 22260 in today's session. in case nifty trades Above 22440 level then the upside target can go up to the 22560 level.

NIFTY Channel - Will it break out or down ?Interesting channel in Nifty 1 hour timeframe.
I think one can take take a position on the break-out or break down! Let me know your thoughts.

NIFTY CHART ANALYSISNifty form Symmetrical Chart Pattern and Breaking Up Either side we can see such big move in Upcoming Session
KEEP AN EYE ON IT

NIFTY 50 TECHNICAL ANALYSIS ( ELLIOT WAVE ) 14/11/2022nifty currently forming converging triangle
we can short nifty with stoploss above the upper trend line
we can expect a target of 18000 or the bottom trend line
This analysis is just for Educational purposes
Our team is not responsible for any kind of Profits or Losses made

NIFTY 50 - SUPPORT & RESISTANCE - 01.09.2022 - BAHAVAN CAPITALNIFTY 50 as per 15 min chart analysis below follows my observation.
Above 17650 Resistance at 17673 / 17698 / 17729
Below 17598 Support at 17562 / 17520 / 17498
Posted Today at 9.58am for the Above mentioned Resistance and Support where respected in the Nifty Chart
Happy Profitable Trading to all...

NIFTY 50 - 15 MIN CHART - BAHAVAN CAPITAL - 30.08.2022NIFTY 50 as per 15 min chart analysis below follows my observations
If Nifty opens Above 17382 then Resistance at 17411 / 17428 / 17456 / 17480 / 17528 / 17551 / 17583.
If Nifty opens Below 17300 then Support at 17283 / 17250 / 17241 / 17228 / 17202 / 17167.
Today FII Net selling was at 561.22 Crores and DII Net buying was at 144.08 Crores.
If there was no Gap up Opening and if PDH is not broken then it might end up Range Bound.
Nifty for tomorrow will continue to be in Range. Since there had been not much selling or buying by Institutional Investors.
Happy Profitable Trading to All.....

NIFTY 50 - 15 MIN CHART - BAHAVAN CAPITAL - 29.08.2022NIFTY 50 as per my previous post for 26.08.2022 mentioned that there had been no aggressive buy or sell by both FII and DII.
Similarly today was an highly volatile day where from 12.15 to 3.30 pm there had been no big movement on the either side.
FII Net Selling was at 51.12 Crores and DII Net Buying was at 453.59 Crores.
Being mostly a sideways day on 26.08.2022 we should witness some better movement any one of the side by Monday.
Above 17606 then Resistance at 17663 / 17697 / 17728 / 17781 / 17800 / 17831 / 17881.
Below 17491 then Support at 17428 / 17411 / 17354 / 17303 / 17286 / 17228 / 17211 / 17167.
Nasdaq Composite and Dow Jones Index had a good Fall today (26.08.22) and there could be a similar impact on Nifty and Bank Nifty too.
However lets see where market opens.
Happy Weekend to All........

NIFTY 50 - 15 MIN CHART - 26.08.2022 - BAHAVAN CAPITALNIFTY 50 as per 15 Min chart Below Follows my observation
Though it was a good sell from 2.00 pm onwards from 17716 to 17487.
As far as FII Net Buying was at 369.06 Crores and DII Net Selling was at 334.31.
So there was no big buying or selling even though there was a good sell off.
Above 17528 then Resistance at 17649 / 17716 / 17754 / 17793.
Below 17495 then Support at 17421 / 17325 / 17285 / 17225.
Friday being a Profit booking day for most. Volatility may continue.
Happy Profitable Trading to All...

NIFTY 50 - Price Action - 25.08.2022 - BAHAVAN CAPITALNIFTY 50 had posted previously for 25.08.2022.
Above 17679 and Resistance at 17728 and Below 17561 support at 17495.
Today we can witness market weakness which i had mentioned too for 25.08.2022.
For 26.08.2022 will post you price action chart.
And i believe the nifty charts which iam posting had been use full for you all..

NIFTY 50 - 15 MIN CHART - 25.08.2022 - BAHAVAN CAPITALNIFTY 50 as per previous post. Today it was in sideways and formed a inside bar candle.
FII Net Buying was at 23.19 Crores and DII Net Selling was at 322.34 Crores. comparatively then Yesterday it looks more weaker.
If market opens Below 17561 then Support at 17495 / 17430 / 17347.
If market opens Above 17679 then Resistance at 17728 / 17748 / 17783 / 17882 / 17945 / 18000.
Till today market is holding up without a big fall and tomorrow hopefully will be a deciding day for the market movement to uptrend or downtrend.
Happy Profitable Trading to all...

NIFTY 15 MIN - TREND ANALYSIS - 24.08.2022 - BAHAVAN CAPITALNIFTY 50 as per 15 Min Chart below follows my observation
As Expected it was a GAP Down opening but too the surprise it was a good Bull Run from 17345 to 17625 Level.
Considering the uptrend movement i anticipated the contribution should be because of Either FII or DII or both together.
But then the stunning data was FII Net Buying was 563 Crores and DII Net Selling was 215.20 Crores.
So where does this market is headed? With weak Net Holding by FII and DII still in Selling mode. i wouldn't be surprised if the market opens with Gap up and then falls down.
However Gap up at 17650 or 17721 and Possible to move up to 17800 Before a fall or turn into Sideways for Tomorrow...
If 17820 is Broken then 17882 / 17945 / 18000 are the Resistance
Happy Trading to all...

NIFTY 50 - 15 Min Chart 23.08.2022 - BAHAVAN CAPITALNIFTY 50 if it manages to 17468 range then by 1.00pm can anticipate a good movement.
If it Breaks 17410 then support at 17359 as of for this candle
Happy Profitable Trading to all...

NIFTY 50 - 15 MIN CHART - 23.08.2022 - BAHAVAN CAPITAL NIFTY 50 as per 15 minute chart as per my observation
23.08.2022 it should start with a Gap Down opening due to much cluster above 17316
Support at 17214 / 17116 / 17031 / 16945
Finally both FII Net Selling was at 453.77 Crores and DII Net Selling was at 85.06 Crores
Until Last Friday DII was turned out be a Net Seller and FII was still a Net Buyer but today both turning into Net Seller shows a lot weakness for any uptrend movement for now.
If there was any surprises of a Gap up for tomorrow will be very interesting and if so will post fresh chart during the session in the morning.
Happy Profitable Trading to All....

NIFTY GAP DOWN - 22.08.2022 - BAHAVAN CAPITALNIFTY 50 today had a Gap Down and posted for 22.08.2022 for price action based support and resistance and how much today each of the support it had taken and closed. You can view my earlier post for comparision
Will post fresh chart for tomorrow shortly..
Happy Profitable Trading for all
