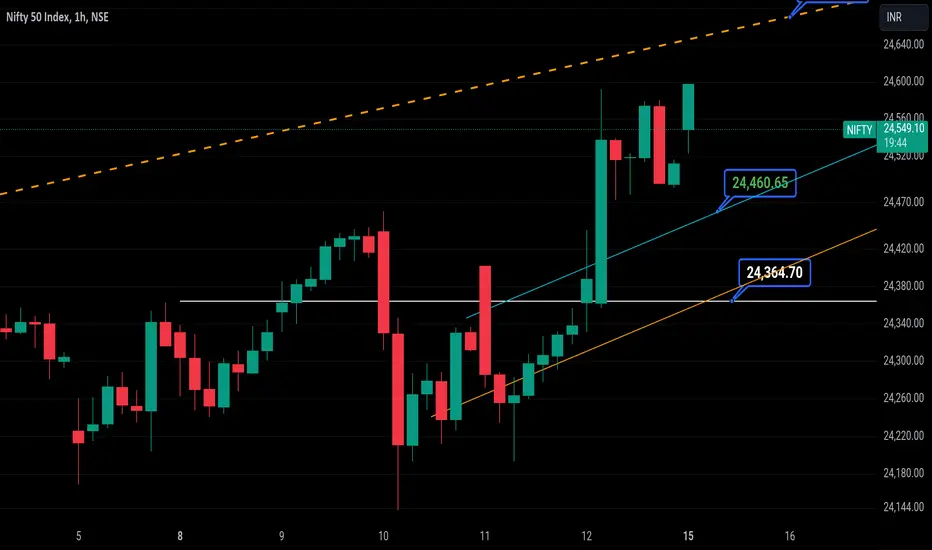
Nifty50 (15th July) 1/2Above dash line is still pending to test
Before moving upside to 24670
It could 📉 to 24460 to HUNT STOP LOSS and from there could bounce to 24670
If 24460 below hourly 🕯 closes then more 📉 fall is expected to 24364
Disclaimer:
It's a personal view not a financial advice and I assume no responsibility and liability whatever outcome arises.
Niftyintradaytradesetup
NIFTY Prediction for today 15 July 24As we discussed, NIFTY took support at 24344 and had a good bullish run, broke resistance, and sustained to the upside, showing a good bullish nature.
If we look at the chart now:
The market is trading in the uptrending parrell channel, which has HH and HL, which have a bullish structure.
Support levels: 24429, 24128, 23985
Resistance levels: 24577 and Resistance trendline.
If we look at the OI data:
PCR = 0.86 shows the market has a bullish sentiment. 24500 is Max pain. Lower levels have significantly higher PE writing than CE writing on higher levels, making a bullish market structure.
I am expecting the market to be sideways in the uptrend line channel. If the channel breaks down to the downside, a good bearish momentum can be seen till 24188.
Reason:
RSI > 60 shows the market has a bullish structure.
Price > EMA(13, 50, 200), which indicates the bullish market.
PCR = 0.86 indicates market-bullish sentiments.
Price > VWAP shows a Bullish market structure.
Verdict: Sideways or Bullish
Plan of action:
wait for 15 min candle. Wait for good price action on the 24500 levels, and make your positions accordingly.

#Nifty directions and levels for July 15th.Good morning, friends! 🌺🍬 Here are the directions for July 15th:
The global markets are showing a slightly bearish sentiment (based on the Dow Jones). Our local market is maintaining a moderately bullish trend. Today, the market may open neutral or with a gap-up start, as indicated by GiftNifty, which shows an increase of 50 points at 8:00 am.
Nifty and Bank Nifty have different structures: Nifty indicates a two-way move, while Bank Nifty indicates a range-bound market. Let's look at each one.
Nifty has closed above the all-time high after seven consecutive consolidation sessions. This suggests a solid rally ahead on a normal trading day. However, with the upcoming budget event, even if the market breaks the all-time high again, it is unlikely to go much higher due to current sentiment rather than technical factors.
> Based on this sentiment, if the gap-up sustains, we can expect a minimum of 24608 to 24644. After that, if the market rejects around the supply zone, we can expect a reversal of 38 to 78% in the Fibonacci sequence. This is our first variation. On the other hand, if the market doesn't reject there and consolidates, the rally will likely continue further.
> Alternatively, if the gap-up doesn't sustain, it may range between the previous day's high and the 4th wave demand zone. In this sentiment, there is no big correction. The correction will continue only if it breaks 24420.

Nifty Intraday Support & Resistance Levels for 15.07.2024On Friday, Nifty opened gap-up and made a new all-time high of 24,592.20 before closing at 24,502.15. The weekly trend (50 SMA) is overbought, and the daily trend (50 SMA) remains positive.
Support Levels:
Near support/demand zone (15m): 24,331 - 24,384
Far support/demand zone (5m): 24,201 - 24,235
Major support/demand zone (75m) for weekly trade: 24,056 - 24,150
Resistance Levels:
Near small supply/resistance zone (15m): 24,560 - 24,580

NIFTY Intraday Trade Setup For 15 Jul 2024NIFTY Intraday Trade Setup For 15 Jul 2024
Bullish-Above 24600
Invalid-Below 24550
T- 24780
Bearish-Below 24450
Invalid-Above 24500
T- 24275
NIFTY has closed on a slight bullish note with 0.73% gain last week. On 10 Jul it closed below PDL so as per the method we were following to ride the bullish move is now invalid. But now lets come to the 2nd validation point. Now if at all there is a bearish price action in daily TF then we will call it bearish and a confirmed reversal. Also this reversal confirmation will be updated through these trade setups. 24600 and 24450 are levels to watch out for tomorrow.
Coming to Monday's trade setup, if index opens flat and a 15 Min candle closes above 24600 then we will long for the target of 24780.
For selling we need a 15 Min candle close below 24450. T- 24275.
In case of a big gap up/down, wait till 10 o'clock and mark the high and low of the trading range (5MIN). Trade on this range breakout.
==========
I am Not SEBI Registered
This is my personal analysis for my personal trading. Kindly consult your financial advisor before taking any actions based on this.

Nifty50 (11th july) 1/3If rejects from 24272 then 📉 could test 24197
From 24197 shortcovering 📈 is expected to above target 24527
Disclaimer:
It's a personal view not a financial advice and I assume no responsibility and liability whatever outcome arises

#Nifty directions and levels for July 12th.Good morning, friends! 🌺🍬 Here are the directions for July 12th:
There are no significant changes in the global markets, which are still showing a moderately bullish trend. Our local market is also showing a moderately bullish trend. Today, the market may open with a gap-up start, as indicated by GiftNifty, which shows an increase of 60 points.
Yesterday, there was significant movement in Nifty. What about next? As per the pullback, the market may go further up with minor consolidation. GiftNifty also indicates that. If the market opens with a gap-up, we can expect minor rejection around the immediate resistance level. If this happens, it may retrace up to 23 to 38%. After that, if the market finds support at the 38% level, it may continue the rally with minor consolidation. This is our basic structure.
In this case, we have to discuss something simple and not too complicated:
> 1st one, There is no need to reject around the immediate resistance level. If it happens, we can expect a minor retracement.
that menas If the market consolidates or breaks it with a solid candle structure, the rally will likely continue further(around the immediate resistance).
> 2nd one, Is there any correction possible? Yes, correction is also possible. If the retracement breaks the 38% Fib level, it may continue to range.
> This sentiment is also applicable for an initial market decline. This means that if the gap-up doesn't sustain or if the market declines sharply initially, we can follow the same sentiment.

Nifty Intraday Support & Resistance Levels for 12.07.2024On Thursday, Nifty opened a gap-up inside the 15m supply zone mentioned in the last post and fell below 24,200 before recovering at the end. The weekly and daily trends (50 SMA) remain positive.
Support Levels:
Near support/demand zone (5m): 24,201 - 24,235
Major support/demand zone (75m) for weekly trade: 24,056 - 24,150
There is no major supply/resistance zone on the chart as of now.

NIFTY prediction for tomorrow 12 July 24As we discussed, NIFTY fell nicely and took support at 24188, and then it recovered nicely to 24315.
If we look at the chart now:
The market is trading in a resistance zone. Today, the market has had a huge fall from this point. Price action on this level will decide the upcoming momentum in nifty. If it breaks to the upside, it can touch the resistance trendline; otherwise, it will be sideways in the range of 24128-24344.
Support levels: 24188, 200-EMA (15-min)
Resistance levels: 24344, Resistance trendline.
If we look at the OI data:
PCR = 0.76 shows the market has a NEUTRAL sentiment. 24300 is Max pain. Both side levels have good PE and CE writing. The option chain data are indecisive.
Price Action on the 24315 will decide the direction for tomorrow.
Reason:
RSI = 40-60; shows the market is going to be sideways bullish.
Price > EMA(13, 50, 200), which indicates the bullish market.
PCR = 0.76 indicates market-neutral sentiments.
price > VWAP shows a Bullish market structure.
Verdict: Neutral
Plan of action:
wait for 15 min candle. Wait for good price action on the 24315 levels, and make your positions accordingly.

NIFTY prediction for today 11 July 24As we discussed, NIFTY took resistance at the provided dotted resistance trendline and gave a good fall.
If we look at the chart now:
The market gave good bearish momentum yesterday with heavy volatility. I also took support at the price action level of 24188 and came back. That shows bulls are active near 24000.
Support levels: 24188, 200-EMA (15-min)
Resistance levels: 24312, Resistance trendline.
If we look at the OI data:
PCR = 0.74 shows the market has a NEUTRAL sentiment. 24400, 24500, and 24600 have significantly higher CE writing than the lover levels PE writing. The market has big support at 24000.
I am expecting the market to be volatile, sideways, bullish.
Reason:
RSI = 40-60; shows the market is going to be sideways.
Price > EMA(13, 50, 200), which indicates the bullish market.
PCR = 0.74 indicates market bullish sentiments.
price > VWAP shows a Bullish market structure.
Verdict: Sideways or Bullish
Plan of action:
wait for 15 min candle. wait for the market to make a direction and make the position accordingly.

Nifty Intraday Support & Resistance Levels for 11.07.2024On Wednesday, Nifty made a new all-time high of 24,461.05 before falling 300 points to an intraday low of 24,141. It found support at the 75m Demand Zone mentioned in the last post and bounced back nearly 200 points, closing at 24,324. The weekly and daily trends (50 SMA) remain positive.
Support Levels:
Near Support/Demand Zone (5m): 24,246 - 24,265
Major Support/Demand Zone (75m) for weekly trade: 24,056 - 24,150 (tested yesterday)
Resistance Levels:
Small Supply/Resistance Zone (15m): 24,398 - 24,419

Nifty50 (10th July) 1/3If hourly candle 🕯 closes below 24464 then could test below price marked 📉 📉 24163
Disclaimer:
It's a personal view not a financial advice and I assume no responsibility and liability whatever outcome arises.

Nifty50 (9th July)1/2Could test 24464 and from there rejection is expected 📉 will post the downside levels in next chart
Disclaimer:
It's a personal view not a financial advice and I assume no responsibility and liability whatever outcome arises .

Nifty50 (9th July) 2/2If closing sustains above this white dotted line then could test 24464
24464 is a imp resistance
Could reject from there 📉 📉
Disclaimer:
It's a personal view not a financial advice and I assume no responsibility and liability whatever outcome arises

#Nifty directions and levels for July 10th.Good morning, friends! 🌺🍬 Here are the directions for July 10th:
There are no significant changes in the global and local markets, both of which are showing a moderately bullish trend. However, today the market may open with a neutral to slightly gap-down start, as indicated by GiftNifty, which shows a decrease of 10 points (as of 8:00 AM).
Nifty has broken its all-time high once again in the previous session. Structurally, if the market breaks the previous high, then the rally will likely continue. However, breakout structures are important. In the last session, the market moved in a grinding manner, so if the market continues with that same grinding momentum, we can't expect much of a rally. If the market rejects at either 24464 or 24495, it may fall by a minimum of 38 to 61%. On the other hand, if it breaks the previous high with a solid candle structure or consolidates around the immediate resistance level, we can expect a solid rally further. This is our first variation.
The alternate variation suggests that if the initial market declines, we can expect a 38 to 61% minor retracement. After that, if it finds support there, we can expect a range market. If it breaks the 61% Fibonacci level, then the correction may continue further.

#NIFTY Intraday Support and Resistance Levels -10/07/2024Nifty will be gap up opening in today's session. After opening nifty sustain above 24440 level and then possible upside rally up to 24560 level in today's session. in case nifty trades below 24400 level then the downside target can go up to the 24280 level.

NIFTY prediction for today 10 July 24As we discussed, NIFTY opened sideways and ended up sideways bullish.
If we look at the chart now:
The market is trading in an uptrending channel. The market is experiencing minor resistance in the middle of the channel. As the market is trading at an all-time high, if it breaks the middle resistance to the upside, it can give a bullish momentum. There are no horizontal levels as per price action. Please monitor the trendlines drawn on the chart.
Support levels: 24350-24400 range-support-zone, support trendline
Resistance levels: dotted resistaance trendline, main resistance trendline.
If we look at the OI data:
PCR = 1.13 shows the market has a bullish sentiment. 24400 will be max pain. On the lower side, have good PE writing at 24300, 24200, and 24000, which will be a nice support point. On the upside, we have good CE writing, but CE writing is significantly lower than CE writing.
I am expecting the market to be sideways bullish until it breaks the channel on either side.
Reason:
RSI = 57 shows a mild bullish signal, but as the market is showing bearish divergence, it might correct itself soon.
Price > EMA(13, 50, 200), which indicates the bullish market.
PCR = 1.13 indicates market bullish sentiments.
price > VWAP shows a Bullish market structure.
Verdict: Sideways or Bullish
Plan of action:
wait for 15 min candle. wait for the market to make a direction and make the position accordingly,
Note: Don't go for option buying unless the market gives the breakout on either side of the channel.

Nifty Intraday Support & Resistance Levels for 10.07.2024On Tuesday, Nifty broke through the small resistance zone and made a new all-time high of 24,443.60, closing above 24,400 for the first time. The weekly trend (50 SMA) is now overbought, and the daily trend (50 SMA) remains positive.
Support Levels:
Near Support/Demand Zone (5m): 24,382 - 24,400
Far Support/Demand Zone (5m): 24,204.20 - 24,222.65
Support/Demand Zone (75m) for Weekly Trade: 24,056 - 24,150
As of now, there is no resistance zone seen on the chart.

NIFTY Intraday Trade Setup For 10 Jul 2024NIFTY Intraday Trade Setup For 10 Jul 2024
Bullish-Above 24450
Invalid- Below 24400
T- 24555
Bearish-Below 24350
Invalid-Above 24400
T- 24230
NIFTY has closed on a bullish note with 0.46% gain today. Last day we discussed that it formed a Pinbar candle in daily TF and expectation was for a bullish move above 24350. We almost gat 90 points move in favor. Tomorrow in case there is a gap down and day ends near day low then bears will take charge in short term. However I have been updating that bullish sentiment will change when it closes below PDL.
Coming to Wednesday's trade setup, if index opens flat and a 15 Min candle closes above 24450 then we will long for the target of 24555.
For selling we need a 15 Min candle close below 24350. T- 24230.
In case of a big gap up/down, wait till 10 o'clock and mark the high and low of the trading range (5MIN). Trade on this range breakout.
==========
I am Not SEBI Registered
This is my personal analysis for my personal trading. Kindly consult your financial advisor before taking any actions based on this.

Nifty Short Swing Trade 1:3.5 Risk-Reward RatioIchimoku TS KS broke in 15 mins and once it breaks the cloud and price structure, we will get the confirmation.
We have shared our higher time frame view earlier today - please check:
Entry : 24280 (in case of gap down opening below this level, wait for a small pullback near TS in 5 mins)
Stop Loss : 24417
Target : 23770
Disclaimer: We are not SEBI registered. The content presented here is based on our personal opinions. Please conduct your own research and consult with a qualified financial advisor before making any investment decisions.

NIFTY Prediction for tomorrow 8 Jul 24NIFTY did open gap-down, and then after taking support at support, it gave a nice bullish momentum to the upside.
If we look at the chart now:
The market is trading in an uptrending channel. It has taken support multiple times and also has taken resistance multiple times. I expect it to break soon. If the market shows bullish momentum to the upside, it will be taking resistance at the resistance trendline, which might then initiate a bearish momentum after that.
Support levels: 24182, 23952, and 200-EMA
Resistance levels: Red Zone, Resistance trendline.
If we look at the OI data:
PCR = 1.01 shows the market has a bullish sentiment. 24300 will be max pain. On the lower side, 24200 and 24000 have good PE writing, which will be a nice support point. However, 24400 and 24500 have good CE writing, which is going to provide good resistance.
I am expecting the market to give a breakout soon out of this channel.
Reason:
RSI > 50 shows a mild bullish signal.
Price > EMA(13, 50, 200), which indicates the bullish market.
PCR = 1.01 indicates market bullish sentiments.
price > VWAP shows a Bullish market structure.
Verdict: Sideways or Bullish
Plan of action:
Wait for 15 min candle. wait for the market to make a direction and make the position accordingly,
Note: Don't go for option buying unless the market gives the breakout.

Nifty Intraday Support & Resistance Levels for 09.07.2024On Monday, Nifty took support at the 15m demand zone (24,204 - 24,244) mentioned in the last post and bounced back to a day high of 24,344.60. The weekly and daily trends (50 SMA) remain positive.
Support Levels:
Near Support/Demand Zone (5m): 24,204.20 - 24,222.65
Far Support/Demand Zone (30m) in the Gap Level: 24,110 - 24,148
Support/Demand Zone (75m) for Weekly Trade: 24,056 - 24,150
Major Support/Demand Zone (Daily): 23,350 - 23,667
In the coming days, the 24,000 - 24,200 range will be the major support in the short term.
Resistance Levels:
Near Small Supply/Resistance Zone (30m): 24,372 - 24,401

#Nifty directions and levels for July 9th.Good morning, friends! 🌺🍬 Here are the directions for July 9th:
There are no significant changes in the global and local markets, both of which are showing a moderately bullish trend. However, today the market may open with a neutral to slightly gap-up start, as indicated by GiftNifty, which shows an increase of 10 points (as of 8:00 AM).
Nifty and Banknifty both have a range-bound structure, so today may continue in this manner. Let's check them one by one.
For Nifty, there were no big changes in the previous session, and it is still within the range. Today, GiftNifty is showing a neutral start, so if the market declines initially, we can expect it to reach a minimum of 24243 to 24210, both minor support levels. If the market finds support there, we can expect the range to continue. On the other hand, if it breaks below these levels, it may fall further to 24168, which is a 78% retracement. This is our first variation.
Alternatively, if the market initially pulls back, we can expect it to reach 24401, 24431, and 24464 with minor consolidation.
