NIFTY Intraday Trade Setup For 17 May 2024NIFTY Intraday Trade Setup For 17 May 2024
Bullish-Above 22450
Invalid-Below 22400
T- 22675 N-ATH
Bearish- Below 22240
Invalid-Above 22290
T- 22050 21800
NIFTY has closed on a bold bullish note with 0.92% gain today. It was moving randomly but last leg move established and closed on a bold bullish note. Index has formed a long wick rejection candle like 13 May. So will simply trade the current trend and sentiment in power. Above today's high on a flat opening we will get get the best trade. Look like Index is all set for a fresh ATH. 22240 will act as a support zone but below this will short.
Coming to Friday's trade setup, if index opens flat and a 15 Min candle closes above 22450 then we will long for the target of 22675.
For selling we need a 15 Min candle close below 22240. T- 22050.
In case of a big gap up/down, wait till 10 o'clock and mark the high and low of the trading range (5MIN). Trade on this range breakout.
==========
I am Not SEBI Registered
This is my personal analysis for my personal trading. Kindly consult your financial advisor before taking any actions based on this.
Niftyintradaytradesetup

Nifty50 (16th May) 3/3Next hourly closing above 22164 then shortcovering could be possible 📈 📈 to above levels marked on the chart
If hourly closing below 22164 then 📉 📉 ( 22093 pending level )
22093 imp support below that any hourly closing will be 🥶 📉 📉
Disclaimers:
Its a personal view not a financial advise and I assume no responsibility and liability whatever outcome arises.

NIFTY Prediction for today 16 May 24Nifty has already given the breakout. right now it's in the consolidation phase of WAVE 1.
If we look at the chart now:
Market is in sideways zone in range: 22098-22293
Important Levels:
Support zones: 21811 , 21944, 22098
Resistance: 22544, 22763
If we look at OI data:
PCR = 0.73, shows neutral structure. as it's expiry market is highly probable to end sideways in the provided range. if we got the momentum it is likely to be bullish. 22200 is going to provide maxPain.
If we look the FII and DII data it is more of indecisive.
Verdict:
Sideways in range
Bullish if breaks the range 22293 to upside.

#Nifty directions and levels for May 16th.Good morning, friends! 🌺🍬 Here are the directions for May 16th:
The global market is indicating a bullish sentiment based on the Dow Jones, while our local market sentiment suggests a moderately bullish trend. It might open with a gap-up start, as suggested by GiftNifty, showing an increase of +120 points.
Nifty minorly retraced after the gap-up start in the previous trading session. Structurally, we have two options. The first one is the GiftNifty indication of a gap-up start, so if the gap-up sustains and breaks the level of 22337, we can expect further rally continuation. In this scenario, if it forms a solid green candle structure, then we can expect a sharp rally followed by a range breakout. Otherwise, it may go into a diagonal pattern structure (consolidation pattern).
Alternatively, if the market rejects around the immediate resistance level, initially we can expect a 23 to 38% minor retracement. If it finds support there, it may undergo some consolidation for rally continuation. This means if it doesn’t break the minor Fibonacci level of 38%, then the market will maintain the bullish bias.
on the other hand if it breaks the minor Fibonacci level of 38%. then we can expect a minimum correction of 78% to the next level of 1.27%. Structurally, it could be in a flat variation. After that correction, if the market finds support at the 1.27 extension level, then it may turn into a bullish bias.

15 May 2024–Nifty gets a mild rejection at 22295, stance neutralNifty Analysis - Stance Neutral ➡️
Recap from yesterday: "I am hard-guessing it should be a short covering. The moment we get past 22295, we will be forced to go long."
The open was good and we started climbing quickly but at 22295 levels we got our first rejection. Four strong red candles between 09.51 and 10.27 brought N50 down by almost 143 points. If 22295 was breached, we would have changed our stance from neutral to bullish.
The good thing for the bulls was the fall ended at 10.27, for the remainder of the day we went into a small range bound trade. The final close was flat at -0.08%.
On the higher timeframe, we need to take out the resistance pretty quickly otherwise this pullback will start forming a lower high. A lower low, lower high formation is a bearish pattern and that would also mean the next leg of the down move will be more aggressive. At present we prefer to stay neutral till we get more clarity.
The algos made a profit of 15750 INR, MTM was into a loss earlier on, but after 11am things started improving.

Nifty for 16/05/2024Nifty is in uptrend channel from last few sessions, now Nifty is taking support of the channel and forming symmetrical triangle pattern too, Nifty was moving in range of 22233-22164 in last session, if tommorow Nifty breaks this range either upside or downside, then we can expect big move. Here are some levels for your information.
I am not SEBI registered analyst, this is my personal view only for educational purpose, I am not responsible for any profit or loss.

NIFTY Intraday Trade Setup For 16 May 2024NIFTY Intraday Trade Setup For 16 May 2024
Bullish-Above 22300
Invalid-Below 22250
T- 22478 22675
Bearish-Below 22150
Invalid-Above 22200
T- 21965 21800
NIFTY has closed on an absolute flat note today. Since last two days index was strongly bullish. And as per simple market phases, index turns sideways after a parabolic move so has happened today. Index traded in a tight range. 22300 and 22150 is the range for tomorrow, we will simply trade this range breakout. Best trade will be on opening inside this range. Both side momentum will be good so will have neutral view.
Coming to Thursday's trade setup, if index opens flat and a 15 Min candle closes above 22300 then we will long for the target of 22478 and 22674.
For selling we need a 15 Min candle close below 22150. T- 21965 and 21800.
In case of a big gap up/down, wait till 10 o'clock and mark the high and low of the trading range (5MIN). Trade on this range breakout.
==========
I am Not SEBI Registered
This is my personal analysis for my personal trading. Kindly consult your financial advisor before taking any actions based on this.

Nifty50 (15th May) 1/222296 --- 22241 ( No Trade Zone )
Closing below 22241 in hourly could trigger a downward momentum 📉 📉 📉 to 22136
Any hourly closing above 22296 then 📈 📈 to 22449
Disclaimer:
Its a personal view not a financial advise and I assume no responsibility and liability whatever outcome arises.

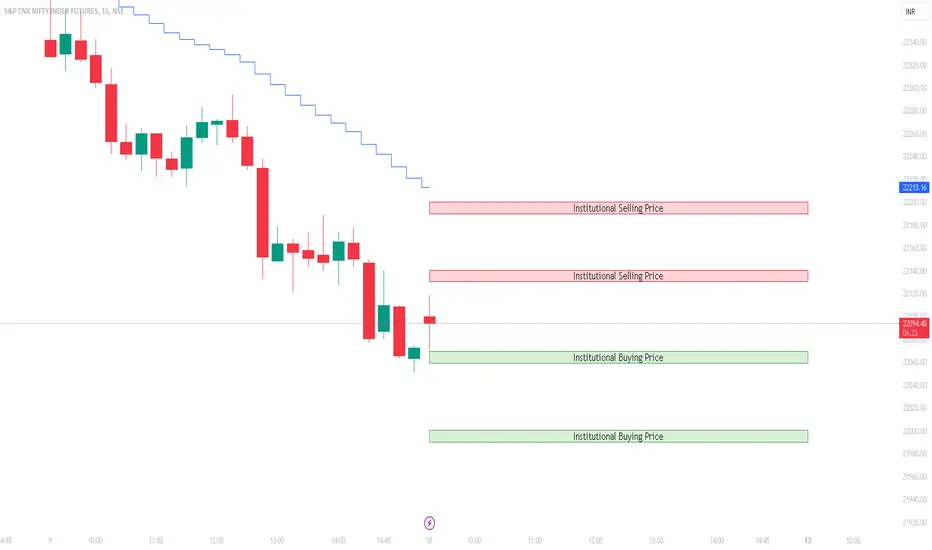
Nifty Institutional levels | Intraday 15-May-2024
Disclaimer:-
The information provided by our advisory service is for educational and informational purposes only. We do not provide investment, financial, or legal advice. Trading and investing involve risks, and past performance is not indicative of future results. Any decision to engage in trading or investment activities is at the sole discretion and risk of the individual. We strongly recommend consulting with a qualified financial advisor or professional before making any investment decisions. We do not guarantee the accuracy, completeness, or reliability of any information provided, and we disclaim any liability for any loss or damage arising from reliance on the information provided. Users are solely responsible for their own investment decisions and actions and off course we are not SEBI registered.

#Nifty directions and levels for May 15th.Good morning, friends! 🌺🍬 Here are the directions for May 15th:
There have been no changes in the global and our local markets. The global market still maintains a moderately bullish sentiment (based on the Dow Jones), while our local market sentiment also indicates a moderately bullish trend. It might open with a neutral to slightly gap-up start, as suggested by GiftNifty, showing an increase of +50.
Nifty continued its rally in the previous session and broke a Fibonacci level of 38%. Even if it breaks this 38% level, the structure has a diagonal formation indicating a distribution pattern. Therefore, if the gap-up doesn’t sustain and there is a sharp decline, the market may retrace a minimum of 38% to 61%. after that If it consolidates around the support level of 61%, the correction will continue if it breaks the previous low. On the other hand, if it finds support around the 61% Fibonacci level, we can expect a bounce back that may reach the day’s opening price level.
An alternate scenario suggests that if the gap-up sustains and breaks the 50% Fibonacci level, it may continue the pullback in a diagonal structure. However, if the opening market has a solid structure, we can expect a sharp rally.

14 May 2024–Nifty gets steam, is it short covering or fresh longNifty Analysis - Stance Neutral ➡️
Recap from yesterday: "The recovery was more than fast and furious, it even took out the 22051 resistance level. This nudged me to change the stance from bearish to neutral just for tomorrow."
Nifty started the day inline and then started climbing almost steadily. There were no visible drops, pullbacks, or attempts by the Bears to push down the prices. The decision to change the stance from bearish to neutral yesterday paid off.
At this point, I am not quite sure if it's the short covering or build-up of new long positions that is taking the markets higher. I am hard-guessing it should be a short covering. The moment we get past 22295, we will be forced to go long.
On the higher time frame, N50 has held on to the 21913 pretty strongly reinforcing the IH&S pattern (earlier). This could be read along with the new double bottom (W pattern) that is forming which shows the strength of the support level.
Nifty Algos ended the day with gains of 5625 INR

NIFTY Intraday Trade Setup For 15 May 2024NIFTY Intraday Trade Setup For 15 May 2024
Bullish-Above 22280
Invalid-Below 22230
T- 22500
Bearish-Below 22080
Invalid-Above 22130
T- 21800
NIFTY has closed on a bullish note with 0.51% gain today. Unlike BANKNIFTY it was trendy after 11 o'clock. Buy triggered as per trade setup above 22150 and gave a move till 22270, however target was not achieved. On a flat opening there can be another good trendy day above 22270. 22370 looks as an confluence zone in case of a gap up. Currently bulls have overpowered so will maintain a bullish view.
Coming to Wednesday's trade setup, if index opens flat and a 15 Min candle closes above 22280 then we will long for the target of 22500.
For selling we need a 15 Min candle close below 22080. T- 21800.
In case of a big gap up/down, wait till 10 o'clock and mark the high and low of the trading range (5MIN). Trade on this range breakout.
==========
I am Not SEBI Registered
This is my personal analysis for my personal trading. Kindly consult your financial advisor before taking any actions based on this.

#nifty directions and levels for May 14th.Good morning, friends! 🌺🍬 Here are the directions for May 13th:
The global market still maintains a moderately bullish sentiment (based on the Dow Jones), while our local market sentiment also indicates a moderately bullish trend. It might open with a neutral to slightly gap-up start, as suggested by GiftNifty, showing an increase of +50.
Nifty had a sharp pullback after the initial decline in the pervious session, and GiftNifty is also indicating a positive start. However, on the upside, there is a Fibonacci level of 38% resistance, which is a key rejection level. If the market rejects there, then it could retrace a minimum of 38% to 61% with a three-wave structure.
Alternatively, if the market sustains or breaks the 38% level, then the pullback will likely continue and it may reach a minimum of 22,251 to the Fibonacci level of 50%.

13 May 2024– 310pts intraday bounce, stance changed to neutralNifty Analysis - Stance Neutral ➡️
Recap from yesterday: "On the 63mts TF, the bearishness continues. The next target of 21913 is still in our watchlist and if we fall below that - the real action begins."
The day took me by surprise, not with the inline opening and a 248pts ~ 1.12% downward fall, but the reversal of 310pts ~ 1.42%. The downside was in the cards, if you had read the previous day's post mortem report - you would have subscribed to those views.
And once again we broke the 21913 support, but gave it away real quick. The recovery was more than fast and furious, it even took out the 22051 resistance level. This nudged me to change the stance from bearish to neutral just for tomorrow.
On the higher time frame, I still cannot believe the reversal came from a technical perspective. Most likely the source seems like a news/event, did not find time to scan it as was busy with my Bday plans.
The Algos shows a profit of 10327 INR, but the actual results were negative, I guess it had to do with some wild swings that we had in between & due to slippage in bid/ask spread.

NIFTY Intraday Trade Setup For 14 May 2024NIFTY Intraday Trade Setup For 14 May 2024
Bullish-Above 22150
Invalid-Below 22100
T- 22430
Bearish-Below 21820
Invalid-Above 21870
T- 21600
NIFTY has closed on a positive note with 0.22% gain today. Index respected the lower trendline of the channel being followed in daily TF. Index has formed a Pinbar candle which indicates a potential reversal in the short term. Tomorrow above 22140 there can good upside move and 61.8% retracement will be initiated. Important resistance lies near 22425-50.Bears will take a grip below 21930.
Coming to Tuesday's trade setup, if index opens flat and a 15 Min candle closes above 22150 then we will long for the target of 22425-50.
For selling we need a 15 Min candle close below 21800. T- 21600.
In case of a big gap up/down, wait till 10 o'clock and mark the high and low of the trading range (5MIN). Trade on this range breakout.
==========
I am Not SEBI Registered
This is my personal analysis for my personal trading. Kindly consult your financial advisor before taking any actions based on this.

#Nifty direction and levels for May 13th.Good morning, friends! 🌺🍬 Here are the directions for May 13th:
The global market still maintains a moderately bullish sentiment (based on the Dow Jones), while our local market sentiment indicates a bearish trend. It might open with a neutral to slightly gap-down start, as suggested by GiftNifty, showing a decrease of -20.
>Nifty had consolidated after the sharp correction. GiftNifty indicates a slightly gap-down start, so it may open negatively. After that, if it takes a pullback initially, it might reach 50 to 61% in the upside fib levels. Because, as per the wave structure, a pullback has a three-wave structure, but there are only two waves formed. So, we can expect an initial pullback. However, if it finishes the three-wave structure, the major trend (correction) will continue. That means, after that pullback, if it rejects around the 50 or 61% fib level, then it may turn into a correction phase.
Note- Alternatively, if it breaks or sustains around the fib level 61%, then the pullback will continue further.
Alternate variation - if the gap-down sustains, we can expect correction continuation that will reach a minimum of the demand zone to the swing low (21777). Structurally, it could be in sub-wave 5th, so the correction may take less volume.

NIFTY Intraday Trade Setup For 13 May 2024NIFTY Intraday Trade Setup For 13 May 2024
Bullish-Above 22150
Invalid-Below 22100
T- 22235
Bearish-Below 21930
Invalid-Above 21980
T- 21680
NIFTY has closed on a bearish note last week with 1.87% cut last. Last week we discussed that there is a possibility of short term downside move below 2nd leg Shooting Star's low- 22340. Index triggered the short trade and gave one way move till 21950 without a major pullback. Also index has taken a halt at lower trendline in daily TF. Once again let me discuss the major weekly levels which are 22800 and 21700.
Coming to Monday's trade setup, if index opens flat and a 15 Min candle closes above 22150 then we will long for the target of 22350.
For selling we need a 15 Min candle close below 21930. T- 21680.
In case of a big gap up/down, wait till 10 o'clock and mark the high and low of the trading range (5MIN). Trade on this range breakout.
==========
I am Not SEBI Registered
This is my personal analysis for my personal trading. Kindly consult your financial advisor before taking any actions based on this.

10 May 2024 - Inability to take out the 22051 resistance - BEARSNifty Analysis - Stance Bearish⬇️
Recap from yesterday: "On the higher timeframe, N50 has made a massive double top, see the black dotted line. If it materializes, it could even be a real shocker to the bulls out there. Just like we discussed this week, if 21913 is getting taken out, the inverse H&S pattern will get negated."
Nifty was unable to take out the immediate resistance of 22051 conclusively although we stayed above these levels between 09.47 to 10.47 and then between 11.11 and 11.35. The inability to break out is some validation for the Bears to continue exerting the pressure.
On the 63mts TF, the bearishness continues. The next target of 21913 is still in our watchlist and if we fall below that - the real action begins.
#Nifty50 algo ended up generating Rs10912 today.

Nifty50 Support And Resistance 13-May-24
Please find below simple resistance and support:
Resistance: 22093
If crossed up then will see upward move:
TGT: 22131
Support: 21984
If crossed down then will see downward move:
TGT: 21813
This is only for education purpose. Do your own research before investing or trading.
I AM NOT SEBI REGISTERED ANALYST, SO BEFORE TAKING ANY DECISION CONSULT ANY PROFESSIONAL.
We Strictly Recommend You Not To Make Any Decisions, Financial, Investments, Trading, Or Otherwise.
Please Understand That Using This Information Would Be Totally At Your Own Risk.
****************************************************************************
𝐃𝐈𝐒𝐂𝐋𝐀𝐈𝐌𝐄𝐑: We/I are not 𝐒𝐄𝐁𝐈 ( Securities and Exchange Board of India ) Registered. The Information Provided Is For Educational & Instructive Purposes Only. Our Intention Is Not To Provide Any Financial Advice, Investment Advice, Training Advice, Or Any Other Advice. This Is General Information And Is Not Explicit To You Or Anyone Else.
Without The Consultation Of Any Professional, We Strictly Recommend You Not To Make Any Decisions, Financial, Investments, Trading, Or Otherwise. Please Understand That Using This Information Would Be Totally At Your Own Risk.
Do Not Take Any Action Unless You Are Set Up To Continue An
'All Out Misfortune " or "Total Loss".
Your Misfortune Could Incorporate Cash You Contributed Just As Commissions And Exchange Charges

Nifty Institutional levels | Intraday - 10-May-2024Soon i will give update on how to use this IT levels in Options Trading.
Disclaimer:-
The information provided by our advisory service is for educational and informational purposes only. We do not provide investment, financial, or legal advice. Trading and investing involve risks, and past performance is not indicative of future results. Any decision to engage in trading or investment activities is at the sole discretion and risk of the individual. We strongly recommend consulting with a qualified financial advisor or professional before making any investment decisions. We do not guarantee the accuracy, completeness, or reliability of any information provided, and we disclaim any liability for any loss or damage arising from reliance on the information provided. Users are solely responsible for their own investment decisions and actions and off course we are not SEBI registered.
#Nifty Directions and Levels for May 10th.Good morning, friends! 🌺🍬 Here are the directions for May 10th:
The global market maintains a moderately bullish sentiment (based on the Dow Jones), while our local market sentiment indicates a bearish trend. It might open with a neutral to slightly gap-up start, as suggested by GiftNifty, showing an increase of +40.
Nifty fell drastically yesterday too. The structure suggests the correction could continue further, but GiftNifty indicates a gap-up start. So, how can we interpret this? Simply put, the first variation is that even though the market opens with a gap-up, it won't be sustained. If it happens, then we can expect a minimum of 21882 (DZ). After that, if it takes a sharp pullback, we can expect a minimum of 38% pullback wave. On the other hand, if it doesn't find support there or consolidates, then the correction may continue further.
The alternate variation suggests that if the gap-up sustains initially, we could wait for the Fibonacci level 38% breakout. If it breaks, then it may reach the Fibonacci level 61% with minor consolidation. However, if it rejects there(38%), then it may lead to a range market to correction, as the trading market mostly respects the Fibonacci level 38%.

Nifty Intraday Prediction Levels for 10 May 2024The chart indicates 15 min time frame. These Levels act as Support and Resistance according to position of price. These are strictly for Intraday Trading only. Execution only after break out and close above the Resistance zone or break down and close below the Support zone.
These levels act as support and resistance. You have to trade according to level breakout or breakdown.
To buy or sell you can follow Buy/Sell Indication given by indicator or you can follow cloud also.
If you are a new trader then just watch (No Trade) these levels for some days.
Happy trading.
Disclaimer:
I am not a SEBI Registered Analyst. Anything posted here is my own analysis and views. This is created for educational purposes only. Always consult with your Financial Advisor before taking any decision or trade.

09 May 2024 - The decision to stay Bearish paid off handsomely🐻Nifty Analysis - Stance Bearish⬇️
Recap from yesterday: "On a closing basis, N50 finished the day above 22295 at 22302. Ideally, I should change the stance from bearish to neutral, but let me give the benefit of the doubt to the Bears for one more day."
If you look at the horizontal lines, it may appear like I drew them today after the Nifty's move. Thankfully many of my readers know pretty well that these lines were drawn way back and somehow the support/resistance levels look magically working.
Nifty opened below the 22295 level, closed the gap, and then started falling. The first candle gave the impression that N50 would stay neutral today, but after the 3rd candle, things were looking quite resourceful for the Bears. Even then, I never thought we would fall 345 points today, the max target I had in my mind was to retest the 22051 levels and then settle there.
22051 SR zone is shown in the 2nd blue highlight. From 12.51 to 14.31, N50 spent its time there before breaking down. The next major support was at 21913, but we did not go there thankfully.
On the higher timeframe, N50 has made a massive double top, see the black dotted line. If it materializes, it could even be a real shocker to the bulls out there. Just like we discussed this week, if 21913 is getting taken out, the inverse H&S pattern will get negated.
I am not really sure how my algos are minting money. The strategy I have is straddles and ideally in trending markets, I should be losing - maybe it has something to do with the unusually high VIX.
