NIFTY KEY LEVELS FOR 29.01.2026NIFTY KEY LEVELS FOR 29.01.2026
Timeframe: 3 Minutes
If the candle stays above the pivot point, it is considered a bullish bias; if it remains below, it indicates a bearish bias. Price may reverse near Resistance 1 or Support 1. If it moves further, the next potential reversal zone is near Resistance 2 or Support 2. If these levels are also broken, we can expect the trend.
When a support or resistance level is broken, it often reverses its role; a broken resistance becomes the new support, and a broken support becomes the new resistance.
If the range(R2-S2) is narrow, the market may become volatile or trend strongly. If the range is wide, the market is more likely to remain sideways
please like and share my idea if you find it helpful
📢 Disclaimer
I am not a SEBI-registered financial adviser.
The information, views, and ideas shared here are purely for educational and informational purposes only. They are not intended as investment advice or a recommendation to buy, sell, or hold any financial instruments.
Please consult with your SEBI-registered financial advisor before making any trading or investment decisions.
Trading and investing in the stock market involves risk, and you should do your own research and analysis. You are solely responsible for any decisions made based on this research.
Niftylevels

#NIFTY Intraday Support and Resistance Levels - 29/01/2026Nifty is expected to open on a flat to mildly positive note, indicating stability after the recent recovery from lower levels. The index is currently trading around the 25340–25350 zone, which is an important intraday pivot. A flat opening near this level suggests that the market is waiting for fresh cues before committing to a directional move. Volatility may remain moderate in the initial phase, with price action largely driven by how Nifty behaves around key support and resistance zones.
From a technical structure point of view, Nifty has shown a decent pullback from the 25000 support area, where strong buying interest was seen earlier. This bounce indicates that buyers are still active at lower levels. However, the upside is capped near the 25450–25500 resistance zone, which has repeatedly acted as a supply area. Until this zone is decisively broken, the index may continue to trade in a defined range, offering selective intraday opportunities rather than trending moves.
On the bullish side, if Nifty manages to sustain above 25250 on a 15-minute closing basis, it would indicate strength and continuation of the short-term upmove. In this scenario, long positions can be considered above 25250 with an initial target of 25350. If momentum builds further, the index can move toward 25400 and then 25450+, where partial profit booking is advisable due to expected selling pressure. A strong close above 25450 would further improve the bullish outlook for the coming sessions.
On the downside, failure to hold above 25200 would weaken the immediate structure. If Nifty breaks and sustains below 25200, it may trigger a short-term correction. In such a case, downside targets of 25100 and 25050 come into play, followed by the psychological 25000 level. The 25000–25050 zone remains a crucial support area, where fresh buying or a reversal attempt can be expected. A clean breakdown below 25000 would increase bearish momentum and may lead to deeper correction, though that seems less likely without strong negative cues.
For intraday traders, the zone between 25200 and 25250 should be treated as a wait-and-watch area, as price action here can be choppy and directionless. The best trades are expected only after a clear breakout above resistance or a confirmed breakdown below support. Strict stop-loss, partial profit booking, and disciplined position sizing are essential, as the market is still in a consolidation-to-reversal phase rather than a strong trend.
Overall, Nifty is positioned at a crucial juncture. Holding above 25250 keeps the bias mildly positive, while a break below 25200 shifts the bias toward a short-term corrective move. The session is likely to reward traders who focus on levels, confirmation, and risk management rather than aggressive directional bets.

NIFTY - Trading levels and Plan for 29-Jan-2026📊 NIFTY Trading Plan for 29-Jan-2026
(Educational & Level-Based | For Index Options Traders)
Market Principle to Remember:
Price reacts at zones where maximum traders are trapped, hedged, or emotionally committed.
Our job is not prediction — it is structured reaction 🧠📈
🟢 Scenario 1: GAP UP Opening (100+ Points) 🚀
Market Psychology:
A big gap-up often comes from overnight short covering or positive global cues. Retail traders chase breakouts emotionally, while smart money waits to sell premium or buy only after acceptance.
📌 Trading Plan:
🔹 Avoid buying immediately at market open
🔹 Let the first 15–30 minutes define direction
🔹 Mark opening range high & VWAP
🔹 Bullish bias only if price sustains above VWAP
🔹 Look for pullback + hold before Call buying
🔹 Prefer Bull Call Spread if IV is elevated
🔹 If price shows rejection near resistance, expect gap-fill or consolidation
🔹 Consider Bear Call Spread near strong resistance
🔍 Educational Insight:
Gap-up buyers are usually emotional. If price fails to sustain, institutions sell into strength, leading to sharp reversals.
🟡 Scenario 2: FLAT / RANGE Opening 😐
Market Psychology:
A flat open signals indecision. Big players wait for retail participation before initiating the real move.
📌 Trading Plan:
🔹 Mark Previous Day High (PDH) & Low (PDL)
🔹 First 30 minutes define the battle zone
🔹 Breakout with volume suggests directional move
🔹 Weak breakout often turns into a false trap
🔹 Use Straddle / Strangle near range boundaries
🔹 Deploy Iron Condor if price stays range-bound
🔹 Enter directional trade only after close + retest
🔍 Educational Insight:
Markets punish impatience. Flat opens reward traders who wait for confirmation, not anticipation.
🔴 Scenario 3: GAP DOWN Opening (100+ Points) 📉
Market Psychology:
Gap-down opens trigger panic selling. Weak hands exit early, while smart money waits for selling exhaustion.
📌 Trading Plan:
🔹 Do not sell Puts immediately at open
🔹 Observe opening candle size and volume spike
🔹 Watch how price behaves near key support zones
🔹 If support holds, expect a pullback or bounce
🔹 Buy Calls only after higher-low formation
🔹 If support breaks with volume, expect trend day down
🔹 Buy Puts on pullback toward resistance
🔹 Prefer Bear Put Spread for controlled risk
🔹 Use Call Credit Spread near resistance
🔍 Educational Insight:
Most gap-down moves start with fear but continue only when institutional selling confirms.
⚠️ Risk Management Tips for Options Traders 🛡️
🔹 Risk only 1–2% of total capital per trade
🔹 Avoid revenge trading after stop-loss hits
🔹 No fresh trades after 2:30 PM
🔹 Avoid naked option selling on event-driven days
🔹 Always check IV, Theta decay, and liquidity
🔹 Maintain minimum risk–reward of 1:2
🔹 Journal every trade — process > profits
🧠 Summary & Conclusion ✨
🔹 Gap openings offer opportunity but demand discipline
🔹 Structured trading beats emotional decisions
🔹 Price acceptance matters more than candle color
🔹 Options trading is a probability game, not prediction
🔹 Consistency comes from process, patience, and risk control
Trade like a risk manager first, trader second 💼📊
📜 Disclaimer ⚠️
This trading plan is shared strictly for educational purposes only.
I am not a SEBI registered analyst.
Trading in the stock market involves risk.
Please consult a certified financial advisor before taking any trades.

NIFTY KEY LEVELS FOR 28.01.2026NIFTY KEY LEVELS FOR 28.01.2026
Timeframe: 3 Minutes
If the candle stays above the pivot point, it is considered a bullish bias; if it remains below, it indicates a bearish bias. Price may reverse near Resistance 1 or Support 1. If it moves further, the next potential reversal zone is near Resistance 2 or Support 2. If these levels are also broken, we can expect the trend.
When a support or resistance level is broken, it often reverses its role; a broken resistance becomes the new support, and a broken support becomes the new resistance.
If the range(R2-S2) is narrow, the market may become volatile or trend strongly. If the range is wide, the market is more likely to remain sideways
please like and share my idea if you find it helpful
📢 Disclaimer
I am not a SEBI-registered financial adviser.
The information, views, and ideas shared here are purely for educational and informational purposes only. They are not intended as investment advice or a recommendation to buy, sell, or hold any financial instruments.
Please consult with your SEBI-registered financial advisor before making any trading or investment decisions.
Trading and investing in the stock market involves risk, and you should do your own research and analysis. You are solely responsible for any decisions made based on this research.

NIFTY – Detailed Intraday Trading Plan | 28 JAN 2026📊
Timeframe: 15-Min
Instrument: NIFTY (Index)
Gap Considered: 100+ Points
🔍 MARKET CONTEXT & STRUCTURE
NIFTY has shown volatile price action with sharp intraday swings, indicating active participation from both buyers and sellers.
The current structure suggests the market is transitioning from panic selling to selective buying, making key levels extremely important for the next session.
This plan is reaction-based, not prediction-based — we trade how price behaves at levels, not assumptions.
📌 IMPORTANT LEVELS FOR THE DAY
Opening Support Zone: 25,177 – 25,234
Opening Resistance: 25,327
Major Resistance / Profit Booking Zone: 25,469 – 25,508
Last Intraday Support: 25,030
🔼 SCENARIO 1: GAP UP OPENING (100+ POINTS) 🚀
A gap-up open signals short-covering or global support, but sustainability is key.
🟢 Bullish Continuation Plan
Price opens above 25,327
15-min candle closes above resistance
Retest of 25,327 holds as support
Upside targets: 25,469 → 25,508
🔴 Gap-Fill / Rejection Plan
Failure to sustain above 25,327
Long upper wicks / weak follow-through
Expect pullback towards 25,234
🧠 Trading Psychology:
Gap-up moves often trap late buyers near resistance. Acceptance above resistance confirms institutional participation.
➡️ SCENARIO 2: FLAT / NEUTRAL OPENING ⚖️
A flat open usually indicates indecision, leading to range-bound price action initially.
🟢 Upside Breakout Plan
Sustained price above 25,327
Volume expansion on breakout
Targets: 25,400 → 25,469
🔴 Downside Breakdown Plan
Breakdown below 25,177
Strong bearish 15-min candle
Targets: 25,100 → 25,030
🧠 Trading Psychology:
Flat opens create fake moves. Waiting for a 15-min confirmation avoids emotional entries and whipsaws.
🔽 SCENARIO 3: GAP DOWN OPENING (100+ POINTS) 📉
A gap-down open tests buyer strength immediately.
🟢 Support Hold / Pullback Buy
Price reacts positively from 25,177 – 25,234
Long lower wicks / higher-low structure
Bounce targets: 25,300 → 25,327
🔴 Breakdown Continuation
Acceptance below 25,177
Selling pressure increases
Targets: 25,030 → 24,950
🧠 Trading Psychology:
If key demand zones fail, sellers gain confidence and momentum accelerates.
🧠 OPTIONS TRADING STRATEGY (EDUCATIONAL)
Near resistance → Prefer Bull Call Spread, avoid naked CE buying
Inside range → Iron Condor / Short Strangle (low momentum)
Breakdown confirmed → Bear Put Spread
🛡 RISK MANAGEMENT RULES 🔐
Trade only after confirmation
Risk maximum 1–2% capital per trade
Avoid overtrading inside no-trade zones
Book partial profits near key levels
One setup = one trade
🧾 SUMMARY & CONCLUSION ✍️
25,177 – 25,234 is the most critical decision zone
Above 25,327 → buyers regain control
Below 25,177 → sellers dominate
Let price confirm direction — patience is the edge
Trade what you see, not what you feel 📊
⚠️ DISCLAIMER
This analysis is for educational purposes only.
I am not a SEBI registered analyst.
Markets involve risk — trade responsibly.

NIFTY KEY LEVELS FOR 27.01.2026NIFTY KEY LEVELS FOR 27.01.2026
Timeframe: 3 Minutes
If the candle stays above the pivot point, it is considered a bullish bias; if it remains below, it indicates a bearish bias. Price may reverse near Resistance 1 or Support 1. If it moves further, the next potential reversal zone is near Resistance 2 or Support 2. If these levels are also broken, we can expect the trend.
When a support or resistance level is broken, it often reverses its role; a broken resistance becomes the new support, and a broken support becomes the new resistance.
If the range(R2-S2) is narrow, the market may become volatile or trend strongly. If the range is wide, the market is more likely to remain sideways
please like and share my idea if you find it helpful
📢 Disclaimer
I am not a SEBI-registered financial adviser.
The information, views, and ideas shared here are purely for educational and informational purposes only. They are not intended as investment advice or a recommendation to buy, sell, or hold any financial instruments.
Please consult with your SEBI-registered financial advisor before making any trading or investment decisions.
Trading and investing in the stock market involves risk, and you should do your own research and analysis. You are solely responsible for any decisions made based on this research.

NIFTY : Trading levels and Plan for 27-Jan-2026📘 NIFTY TRADING PLAN – 27 JAN 2026
⏱ Timeframe: 15-Min
📊 Gap Considered: 100+ Points
🎯 Approach: Trade only after price acceptance / rejection
🔼 GAP UP OPENING SCENARIO 🚀
If NIFTY opens with a strong gap-up, avoid emotional buying in the first few candles.
📍 Key Resistance Zone: 25,177 – 25,230
• This zone acted as supply earlier
• High probability of consolidation or rejection
🟢 Bullish Continuation Plan:
15-min candle closes above 25,230
Follow-up candle shows higher low
Targets → 25,300 → 25,347
🔴 Rejection / Pullback Plan:
Failure to sustain above 25,177
Expect retracement towards 25,081
🧠 Options Strategy:
• Bull Call Spread (ATM CE Buy + OTM CE Sell)
• Avoid naked CE buying near resistance
➡️ FLAT / RANGE OPENING SCENARIO ⚖️
Flat open indicates indecision and option decay opportunity.
🚧 NO TRADE ZONE: 25,109 – 25,177
• Whipsaw probability is high
• Directional trades only after breakout
🟢 Upside Plan:
Acceptance above 25,177
Targets → 25,230 → 25,300
🔴 Downside Plan:
Breakdown below 25,109
Drift towards 25,081
🧠 Options Strategy:
• Short Strangle / Iron Condor
• Only with strict SL on breakout
🔽 GAP DOWN OPENING SCENARIO 📉
Gap-down open tests buyer strength early.
🟢 Opening Support Zone: 25,029 – 25,081
• Buyers may attempt initial bounce
🟢 Bounce Confirmation:
Rejection wicks near support
Higher low on 15-min chart
Upside target → 25,109 → 25,177
🔴 Breakdown Scenario:
Sustained trade below 25,029
Next downside zone → 24,854 – 24,781
🧠 Options Strategy:
• Bear Put Spread if breakdown confirms
• Avoid panic selling near support
🛡 OPTIONS RISK MANAGEMENT TIPS
Never trade inside NO-TRADE ZONE
Prefer spreads over naked options
Risk max 1–2% capital per trade
Book partial profits near levels
One trade = one idea (no revenge trading)
📌 SUMMARY & CONCLUSION
• 25,109 – 25,177 is the key decision zone
• Directional move only after acceptance
• Gap days reward patience, not speed
• Let price confirm → then execute 📊
⚠️ DISCLAIMER
This analysis is for educational purposes only.
I am not a SEBI registered analyst.
Markets involve risk—trade responsibly.

NIFTY 50 – Weekly Outlook (Key Levels & Structure)
NIFTY has decisively broken below the rising trendline that was supporting the index for the past few months. This trendline had multiple confirmations, and the breakdown signals a shift from bullish to corrective / sideways-to-bearish structure in the near term.
The index is currently testing a crucial horizontal support zone around 25,000–25,050. This level will be very important for next week’s price action.
⸻
Key Levels to Watch
Support Zones:
• 25,000 – 25,050 → Immediate and psychological support
• 24,600 – 24,650 → Major demand zone (next downside support)
• 24,350 – 24,400 → Strong long-term support if selling accelerates
Resistance Zones:
• 25,350 – 25,450 → Minor pullback resistance
• 25,750 – 25,850 → Breakdown retest zone
• 26,200 – 26,350 → Strong supply / rejection zone
⸻
Market Structure View
• As long as price remains below the broken trendline, rallies may face selling pressure.
• A sustained hold above 25,450 can lead to short-term relief bounce.
• Break and hold below 25,000 may open gates for 24,600 levels in coming sessions.
• Expect volatile moves, especially around weekly expiry and global cues.
⸻
Trading Approach
• Prefer wait & watch near support levels
• Avoid aggressive trades in the middle of the range
• Let price confirm direction before taking positional bias
⸻
Disclaimer
I am not a SEBI registered analyst/advisor.
This analysis is only for educational and informational purposes.
This is NOT a buy or sell recommendation.
Trading in the stock market involves risk. Please consult your financial advisor before taking any trade.
I am not responsible for any profit or loss arising from this analysis.

NIFTY Update Last Support 24500NSE:NIFTY
previously i posted nifty analysis but that became trap
nifty is stand near to support clusters.
there are no pullback in current down trend so pullback can also possibly and that pullback become breakout rally but this is possibility. pullback also continue the down rally that also possibility.
last support is 24500
this is not a any types of advice.
this is a just chart analysis and that can be wrong.
do your own research.

Dalal Street Shaken Ahead of Monthly Expiry — What’s Next?Indian equity markets witnessed a sharp corrective move last week, with the Nifty sliding nearly 2.5% to close around 25,050. The sell-off came at a sensitive juncture—just ahead of monthly expiry.
Adding to the nervousness, India VIX jumped sharply by 24.8% to 14.19, signaling a sudden rise in uncertainty and trader caution.
A combination of geopolitical tensions, pre-Union Budget 2026 jitters, and mixed Q3 earnings weighed heavily on market sentiment, prompting profit booking across sectors.
◉ Technical Setup
Nifty is currently testing the lower end of its rising channel, a technically important area. A mild relief bounce is possible from these levels.
However, a decisive breakdown below the channel support could trigger another leg of sharp selling in the coming sessions, making this zone extremely crucial for near-term direction.
◉ Key Levels to Watch
Support Zones
25,000 – 24,900: Immediate psychological and technical support
24,500 – 24,400: Strong base with heavy put writer concentration
Resistance Zones
25,400 – 25,500: Immediate hurdle with significant call writing
26,000 – 26,100: Major supply zone and strong resistance
◉ Near-Term View
Volatility is likely to remain elevated in the coming week. While the broader structure has weakened, a short-term bounce from the 25,000 zone cannot be ruled out, given oversold conditions and strong psychological support.
That said, any recovery should be viewed with caution and may face stiff resistance at higher levels.
◉ Suggested Strategy
A cautious, stock-specific strategy is preferred for the week ahead. Short-term oversold signals may support a bounce, but the broader trend has weakened. Avoid aggressive longs and focus on protecting gains.

NIFTY Faces Pressure: Can 24,300 Hold?NIFTY has turned weak after falling around 2.5% on the weekly chart. The index has made a double top near 26,250, which usually means the market is finding it hard to move higher from that area.
On the weekly chart, the candles look bearish. NIFTY is currently holding near an important support around 25,000 (50 EMA). If this level breaks, the market may move lower towards 24,300 and even 23,900.
On the daily chart, NIFTY is trading below all major moving averages (20, 50, 100 & 200 EMA). In the past, whenever NIFTY stayed below these averages, it usually corrected further. Right now, there is no strong support before 24,600.
On the monthly chart, a double top is visible again, showing weakness at higher levels. However, there is decent support near 24,300–24,240, which is also close to the monthly 20 EMA.
Momentum is also weakening. RSI is showing bearish divergence on weekly and monthly charts, which suggests upside strength is fading.
Resistance Levels :- 25,200 – 25,300, 25,500, 26,250
Support Levels :- 24,987, 24,600, 24,300 – 24,240, 23,900
Overall View
As long as NIFTY stays below 25,500, the trend remains weak. Market direction will become clearer near the 24,300 support zone.

NIFTY – Intraday Structure | Breakout from Bullish ConsolidationOn 5m, 15m and 1H timeframes, NIFTY formed a bearish trendline breakout around 2 PM, followed by a pullback and formation of a bullish intraday consolidation channel.
Price is currently consolidating inside this bullish channel, and a decisive break on either side can define the next intraday move.
🔹 Intraday Plan
Upside Scenario:
Break above bullish channel
Targets:
T1: 25,500
T2: 25,550
T3: 25,650
Stop Loss: 25,300 – 25,280
Downside Scenario:
Break below bullish channel
Targets:
T1: 25,150
T2: 25,000
T3: 24,900 – 24,920
Stop Loss: 25,360 – 25,380
This is a pure intraday range-break setup based on post-breakout bullish consolidation.
⚠️ Disclaimer
I am not a SEBI registered advisor or trader.
This analysis is shared only for educational purposes.
Please consult a registered financial advisor before taking any trading decisions.

NIFTY KEY LEVELS FOR 23.01.2026NIFTY KEY LEVELS FOR 23.01.2026
Timeframe: 3 Minutes
If the candle stays above the pivot point, it is considered a bullish bias; if it remains below, it indicates a bearish bias. Price may reverse near Resistance 1 or Support 1. If it moves further, the next potential reversal zone is near Resistance 2 or Support 2. If these levels are also broken, we can expect the trend.
When a support or resistance level is broken, it often reverses its role; a broken resistance becomes the new support, and a broken support becomes the new resistance.
If the range(R2-S2) is narrow, the market may become volatile or trend strongly. If the range is wide, the market is more likely to remain sideways
please like and share my idea if you find it helpful
📢 Disclaimer
I am not a SEBI-registered financial adviser.
The information, views, and ideas shared here are purely for educational and informational purposes only. They are not intended as investment advice or a recommendation to buy, sell, or hold any financial instruments.
Please consult with your SEBI-registered financial advisor before making any trading or investment decisions.
Trading and investing in the stock market involves risk, and you should do your own research and analysis. You are solely responsible for any decisions made based on this research.

NIFTY : Intraday Trading levels and Plan for 23-Jan-2026📘 NIFTY Trading Plan – 23 Jan 2026
Timeframe: 15-Minute
Gap Considered: 100+ Points
Market Context: After a sharp intraday recovery from lower levels, NIFTY is now approaching a key decision-making zone. Trend is still corrective, with range expansion possible on either side.
🔼 SCENARIO 1: GAP UP OPENING (100+ points) 🚀
If NIFTY opens above 25,498, it indicates follow-through buying and short-covering.
The zone 25,498 – 25,537 will act as the first opening resistance.
Sustained 15-min close above 25,537 can trigger momentum toward:
• 25,666 – 25,718 (Last Resistance Zone)
Above 25,718, trend strength improves and fresh longs may emerge.
Failure to sustain above 25,498 = high probability of rejection and pullback.
📌 Educational Insight:
Gap-up openings near resistance often trap late buyers. Confirmation is mandatory before aggressive longs.
📌 Options View:
• Bull Call Spread preferred over naked CE
• Partial profit booking near resistance
• Avoid chasing premiums 🚀
➡️ SCENARIO 2: FLAT / RANGE OPENING ⚖️
If NIFTY opens between 25,301 – 25,378, expect range-bound and whipsaw price action.
This zone acts as a No-Trade Zone / Balance Area.
Multiple fake breakouts are likely.
Upside confirmation only above 25,498.
Downside weakness below 25,301.
Wait for a 15-min close outside the range before taking trades.
📌 Educational Insight:
Flat opens after volatile sessions usually lead to time correction, not directional moves.
📌 Options View:
• Iron Fly / Short Strangle with strict SL
• Low quantity & fast exits
• Protect capital over profits ⏳
🔽 SCENARIO 3: GAP DOWN OPENING (100+ points) 📉
If NIFTY opens below 25,301, sellers regain short-term control.
Immediate support lies near 25,177.
Break below 25,177 opens downside toward:
• 25,031 – 25,077 (Last Intraday Support)
Below 25,030, bearish momentum can accelerate.
Any pullback toward 25,301 – 25,378 should be treated as sell-on-rise.
📌 Educational Insight:
Gap-down opens demand patience — let volatility settle before initiating trades.
📌 Options View:
• Bear Put Spread preferred
• Avoid PE selling in falling markets
• Trail stop-loss aggressively 📉
🧠 Risk Management Tips for Options Traders 🛡️
Risk only 1–2% of capital per trade.
Expiry proximity = faster theta decay.
Prefer spreads over naked options.
No candle confirmation = no trade.
Avoid overtrading inside no-trade zones.
📌 Summary & Conclusion ✨
NIFTY is trading near a critical equilibrium zone.
📍 25,301 – 25,378 = decision area
📍 Strength only above 25,498 → 25,718
📍 Weakness below 25,301 → 25,177 → 25,030
Patience, discipline, and level-based execution will be key for 23 Jan.
⚠️ Disclaimer
This analysis is strictly for educational purposes only.
I am not a SEBI registered analyst.
Markets are uncertain and I may be wrong.
Please consult your financial advisor before trading.

Lets Talk about Nifty I make educational content videos on Trading - Swing Trading in Indian markets especially
In this video I am talking about Nifty in general as a index nothing else - no direction - no predication - I am a setup and data backed trader and follow my setups and not general trends or bias shared commonly .

NIFTY – Bearish Structure Playing Out as AnticipatedIn my previous posts, I had clearly highlighted the possibility of a trend shift and warned that the ongoing price action could resolve to the downside. Over the last few sessions, price has started to play out exactly along those lines.
1. Bearish crossover (mini death cross)
A bearish crossover between the short-term and medium-term moving averages has now occurred. This was already anticipated and mentioned in earlier posts, and it marks a loss of bullish momentum after the ATH zone.
2. Clean breakdown below key support
Price has decisively broken below an important support and trendline structure. This confirms the bearish bias and strengthens the view that the broader market is under distribution rather than accumulation.
3. Next immediate support zone
The marked zone below acts as the next immediate support, where we may expect temporary consolidation or a technical bounce. However, unless there is strong follow-through buying, this should be treated cautiously.
4. Caution on bullish moves
Any signs of bullishness from here are likely to be temporary retracements, which may eventually trigger further sell-offs.
➡️ Avoid fresh swing longs until overall market sentiment turns favorable.
➡️ Existing positions should be managed with strict stop-losses and disciplined risk management.
The market is behaving in line with what was discussed earlier. Until structure changes and strength is proven, the risk remains on the downside. Patience and capital protection are more important than chasing trades in such phases.
📢📢📢
If my perspective changes or if I gather additional fundamental data that influences my views, I will provide updates accordingly.
Thank you for following along with this journey, and I remain committed to sharing insights and updates as my trading strategy evolves. As always, please feel free to reach out with any questions or comments.
Other posts related to this particular position and scrip, if any, will be attached underneath. Do check those out too.
Disclaimer : The analysis shared here is for informational purposes only and should not be considered as financial advice. Trading in all markets carries inherent risks, and past performance is not indicative of future results. It’s essential to conduct your own research and assess your risk tolerance before making any investment decisions. The views expressed in this analysis are solely mine. It’s important to note that I am not a SEBI registered analyst, so the analysis provided does not constitute formal investment advice under SEBI regulations.

NIFTY KEY LEVELS FOR 22.01.2026NIFTY KEY LEVELS FOR 22.01.2026
Timeframe: 3 Minutes
Unable to post on time due to a technical glitch. Sorry for the delayed post.
If the candle stays above the pivot point, it is considered a bullish bias; if it remains below, it indicates a bearish bias. Price may reverse near Resistance 1 or Support 1. If it moves further, the next potential reversal zone is near Resistance 2 or Support 2. If these levels are also broken, we can expect the trend.
When a support or resistance level is broken, it often reverses its role; a broken resistance becomes the new support, and a broken support becomes the new resistance.
If the range(R2-S2) is narrow, the market may become volatile or trend strongly. If the range is wide, the market is more likely to remain sideways
please like and share my idea if you find it helpful
📢 Disclaimer
I am not a SEBI-registered financial adviser.
The information, views, and ideas shared here are purely for educational and informational purposes only. They are not intended as investment advice or a recommendation to buy, sell, or hold any financial instruments.
Please consult with your SEBI-registered financial advisor before making any trading or investment decisions.
Trading and investing in the stock market involves risk, and you should do your own research and analysis. You are solely responsible for any decisions made based on this research.

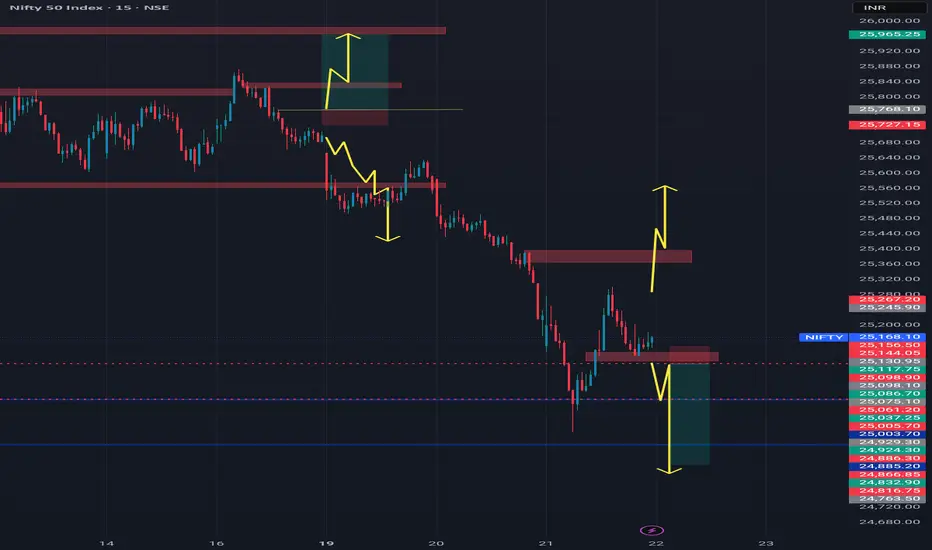
NIFTY : Trading levels and Plan for 22-Jan-2026
Timeframe: 15-minute
Gap Considered: 100+ points
Market Context: Sharp sell-off followed by a relief bounce; index is still below key resistance, indicating pullback within a broader corrective structure.
🔼 SCENARIO 1: GAP UP OPENING (100+ points) 🚀
If NIFTY opens above 25,316, it signals continuation of short-covering from lower levels.
The 25,316–25,370 zone will act as the first supply area.
Sustained 15-min close above 25,370 can open upside toward:
• 25,499 – 25,537 (Last Intraday Resistance zone)
Above 25,537, momentum extension toward 25,600+ is possible, but only with strong volume.
Failure to sustain above 25,316 = trap zone → expect pullback.
📌 Educational Note:
Gap-up markets after a fall often face supply. Prefer buy-on-dips rather than chasing green candles.
📌 Options Thought:
• Bull Call Spread (risk-defined)
• Avoid naked CE buying at resistance
• Book partial profits early 📈
➡️ SCENARIO 2: FLAT / RANGE OPENING ⚖️
If NIFTY opens inside 25,228 – 25,316, the market is likely to stay balanced and choppy initially.
This zone acts as Opening Support / Resistance + No-Trade Zone.
False breakouts are highly probable.
Upside confirmation only above 25,370.
Downside weakness resumes below 25,228.
Wait for a 15-min close outside the zone before acting.
📌 Educational Note:
Flat opens after volatile sessions usually mean time correction, not price correction.
📌 Options Thought:
• Theta strategies (Iron Fly / Short Strangle) only with SL
• Avoid aggressive directional bets
• Reduce quantity ⏳
🔽 SCENARIO 3: GAP DOWN OPENING (100+ points) 📉
If NIFTY opens below 25,228, sellers remain in control.
Immediate support lies near 25,109.
Breakdown below 25,109 exposes:
• 25,000 (Last Intraday Support – psychological level)
Below 25,000, selling pressure can accelerate.
Any bounce toward 25,228–25,316 should be treated as sell-on-rise.
📌 Educational Note:
In gap-down scenarios, capital protection is priority — trend is your friend.
📌 Options Thought:
• Bear Put Spread preferred over naked PE
• Avoid PE selling in trending markets
• Trail SL aggressively 📉
🧠 Risk Management Tips for Options Trading 🛡️
Risk only 1–2% of capital per trade.
Expiry proximity = faster premium decay.
Use spreads to manage volatility risk.
No confirmation candle = no trade.
Avoid overtrading in no-trade zones.
📌 Summary & Conclusion ✨
NIFTY is in a pullback phase within a broader corrective structure.
📍 25,228–25,316 remains the key decision zone.
📍 Strength only above 25,370 → 25,537.
📍 Weakness continues below 25,228 → 25,000.
Patience and level-based trading will be crucial today.
⚠️ Disclaimer
This analysis is for educational purposes only.
I am not a SEBI registered analyst.
Markets are uncertain and I may be wrong.
Please consult your financial advisor before trading.

NiftyNifty has attempted multiple recoveries after the fall, consistently taking support near the 25100 level. If the index opens with a gap down below 25100 and forms a strong bearish candle, a further downside move towards 24750 can be expected. A bullish move is likely only after a decisive break above 25400. Until then price action remain sideways within the 25300-25100 range.
NIFTY KEY LEVELS FOR 21.01.2026NIFTY KEY LEVELS FOR 21.01.2026
Timeframe: 3 Minutes
Unable to post on time due to a technical glitch. Sorry for the delayed post.
If the candle stays above the pivot point, it is considered a bullish bias; if it remains below, it indicates a bearish bias. Price may reverse near Resistance 1 or Support 1. If it moves further, the next potential reversal zone is near Resistance 2 or Support 2. If these levels are also broken, we can expect the trend.
When a support or resistance level is broken, it often reverses its role; a broken resistance becomes the new support, and a broken support becomes the new resistance.
If the range(R2-S2) is narrow, the market may become volatile or trend strongly. If the range is wide, the market is more likely to remain sideways
please like and share my idea if you find it helpful
📢 Disclaimer
I am not a SEBI-registered financial adviser.
The information, views, and ideas shared here are purely for educational and informational purposes only. They are not intended as investment advice or a recommendation to buy, sell, or hold any financial instruments.
Please consult with your SEBI-registered financial advisor before making any trading or investment decisions.
Trading and investing in the stock market involves risk, and you should do your own research and analysis. You are solely responsible for any decisions made based on this research.

NIFTY : Trading levels and Plan for 21-Jan-2025📘 NIFTY Trading Plan – 21 Jan 2026
Timeframe: 15-minute
Gap Considered: 100+ points
Market Context: Strong sell-off followed by base formation; market trading near a decision / no-trade zone after sharp momentum move
🔼 SCENARIO 1: GAP UP OPENING (100+ points) 🚀
If NIFTY opens above 25,316, it indicates short-covering after the recent decline.
Immediate hurdle lies at 25,388 – 25,415 (Opening / Last Intraday Resistance).
Sustained 15-min close above 25,415 is required for bullish continuation.
Upside targets to watch:
• 25,485
• 25,540+ (only if momentum expands)
Any rejection from resistance with weak candles = profit-booking zone.
Avoid aggressive long entries exactly at resistance; wait for pullback & hold.
📌 Options Thought (Gap Up):
• Prefer Bull Call Spread instead of naked CE
• Book partial profits near resistance zones
• Trail SL aggressively 📈
➡️ SCENARIO 2: FLAT / RANGE OPENING ⚖️
If NIFTY opens inside 25,227 – 25,316, market is likely to remain range-bound initially.
This entire zone acts as a NO TRADE / Balance Zone.
Expect whipsaws and false breakouts.
Upside trade triggers only above 25,415.
Downside pressure resumes below 25,227.
Patience is key — let price show intent first.
📌 Options Thought (Flat Market):
• Ideal environment for Theta-based strategies ⏳
• Short strangle / Iron Condor only with strict SL
• Avoid overtrading inside the range
🔽 SCENARIO 3: GAP DOWN OPENING (100+ points) 📉
If NIFTY opens below 25,227, bears remain in control.
First important support lies at 25,043 (Last Intraday Support).
A bounce is possible, but trend remains weak below 25,316.
Breakdown below 25,043 opens downside toward:
• 24,900 – 24,890 (Major Buyer / Trend Reversal Zone)
Avoid bottom-fishing unless strong reversal structure forms.
📌 Options Thought (Gap Down):
• Prefer Bear Put Spread or directional PE with tight SL
• Avoid selling PE in trending markets
• Focus on quick scalps & disciplined exits 📉
🧠 Risk Management Tips for Options Trading 🛡️
Risk only 1–2% capital per trade.
Avoid revenge trading after SL.
Expiry proximity = faster decay & sharper moves.
Use spreads to control volatility risk.
No confirmation = no trade.
📌 Summary & Conclusion ✨
NIFTY is currently trading near a key balance zone after a sharp fall.
📍 25,227 – 25,316 remains the critical decision area.
📍 Strength only above 25,415 with acceptance.
📍 Weakness continues below 25,227, with eyes on 25,043 → 24,900.
Trade light, respect levels, and let the market confirm direction.
⚠️ Disclaimer
This analysis is for educational purposes only.
I am not a SEBI registered analyst.
Markets are uncertain and I may be wrong.
Please consult your financial advisor before trading.

NIFTY KEY LEVELS FOR 20.01.2026NIFTY KEY LEVELS FOR 20.01.2026
Timeframe: 3 Minutes
Sorry for the Delayed post..
If the candle stays above the pivot point, it is considered a bullish bias; if it remains below, it indicates a bearish bias. Price may reverse near Resistance 1 or Support 1. If it moves further, the next potential reversal zone is near Resistance 2 or Support 2. If these levels are also broken, we can expect the trend.
When a support or resistance level is broken, it often reverses its role; a broken resistance becomes the new support, and a broken support becomes the new resistance.
If the range(R2-S2) is narrow, the market may become volatile or trend strongly. If the range is wide, the market is more likely to remain sideways
please like and share my idea if you find it helpful
📢 Disclaimer
I am not a SEBI-registered financial adviser.
The information, views, and ideas shared here are purely for educational and informational purposes only. They are not intended as investment advice or a recommendation to buy, sell, or hold any financial instruments.
Please consult with your SEBI-registered financial advisor before making any trading or investment decisions.
Trading and investing in the stock market involves risk, and you should do your own research and analysis. You are solely responsible for any decisions made based on this research.

NIFTY : Trading levels and Plan for 20-Jan📘 NIFTY Trading Plan – 20 Jan 2026
Timeframe: 15-minute
Gap Criteria Considered: 100+ points
Market Structure: Short-term corrective phase after rejection from upper range, base formation near intraday support
🔼 SCENARIO 1: GAP UP OPENING (100+ points) 🚀
If NIFTY opens above 25,667, it signals bullish intent with short-covering momentum.
Immediate resistance zone lies at 25,667 – 25,682 (Opening / Last Resistance).
Sustained price acceptance above 25,682 on a 15-min close can trigger upside continuation.
Upside targets to watch:
• 25,740
• 25,791
Expect minor pullbacks near resistance; fresh longs only on pullback + hold above broken levels.
Avoid chasing gap-up candles without retest confirmation.
📌 Options Strategy (Gap Up):
• Bull Call Spread (ATM Buy + OTM Sell)
• Avoid naked CE buying near resistance
• Trail profits aggressively as volatility expands 📈
➡️ SCENARIO 2: FLAT / RANGE OPENING ⚖️
If NIFTY opens within 25,529 – 25,568, market enters a balance / no-trade zone.
This zone acts as Opening Support Zone for flat markets.
Expect whipsaws and fake breakouts initially.
Upside trade activates only above 25,682.
Downside pressure increases below 25,529.
Best environment for patience and structure-based entries.
📌 Options Strategy (Flat Market):
• Short Strangle / Iron Condor (only for experienced traders)
• Focus on theta decay ⏳
• Keep strict SL on breakout from range
🔽 SCENARIO 3: GAP DOWN OPENING (100+ points) 📉
If NIFTY opens below 25,529, bears gain control early.
First support zone is 25,422 – 25,364 (Intraday Demand Zone).
Expect a technical bounce, but trend remains weak below resistance.
Breakdown below 25,364 can open deeper downside.
Avoid bottom fishing until strong bullish reversal candle appears.
📌 Options Strategy (Gap Down):
• Bear Put Spread preferred
• Avoid aggressive PE selling in trending markets
• Quick scalps only, book fast 📉
🧠 Risk Management Tips for Options Trading 🛡️
Risk only 1–2% of capital per trade.
Expiry week = faster premium decay & sharp moves.
Prefer spreads over naked option buying.
No revenge trading after SL hits.
Always wait for 15-min structure confirmation before entry.
📌 Summary & Conclusion ✨
NIFTY is currently trading near a short-term balance zone.
📍 25,529 – 25,568 is the key decision-making area.
📍 Sustained move above 25,682 may revive bullish momentum.
📍 Below 25,529, downside risk increases sharply toward 25,422.
Trade light, respect levels, and let price confirm direction.
⚠️ Disclaimer
This content is for educational purposes only.
I am not a SEBI registered analyst.
Markets are uncertain, and I can be wrong.
Please consult your financial advisor before trading.
