Niftylong

Live Nifty Intraday Trade setup for Today 24th June 2021Nifty may stay sideways in the range of 15800 to 15700 Being last expiry of the month volatility is expected. Follow the targets with trading rules
Immediate Support: 15800
Trade with Stoploss!
For Information & Education purpose only!
Regards
Trade Leader Institute

Nifty Important Support & Resistance Levels - 16-June-21Nifty Important Support & Resistance Levels - 16-June-21

NIFTY Detailed Forecast. [June 16: Breaking the Barriers]The Start of Bull Rally
The Game is Moving to the Bulls now.
Price Action is Gaining Enormous Momentum.
Sequence of Gap Up Openings increases the Momentum.
Diverging DI+ and DI- and ADX is at the Best Level Right Now for this Momentum.
Expecting a Gap Up Opening at +69 Points.
Fibonacci Circles are Recommending a Potential Buying Pressure.
15,799 Level will be useful if Price Action hit that.
Today there are some Institutional Investors came to the Ring. (Candlestick Analysis)
Momentum is again Balanced today.
Mostly at the Post Market Session
On June 16, 2021 NSE:NIFTY is Expected to Move 100+ and a Dip Value of 83 or 38 Points.
Expected to Hit the New Milestone of 16,000.
Thanks for using your Valuable time. Leave a like which helps me to do better. Follow me for Daily Signals,
Get updates on, FOREX, Stocks, INDICES, Crypto and CFD's (Share to your Market Friends)

NIFTY IA READY TO MAKE A NEW ALL TIME HIGHThough the news flow affected the price action a bit yesterday but didn’t affect its strength as NIFTY made 100 percent recovery which shows the strength
15830 is the level to watch as of now ! If sustains then NIFTY TO THE MOON


NIFTY Analysis for InvestorsFuturistic NIFTY
IS NIFTY RECOVERED?
NIFTY is Still in Recovery mode, and currently building up momentum in price action.
Already 75% Recovered from the Coronavirus Crash.
India's Economy could start Building Up at 15,935 Pts.
There might be a Potential Bull Run at 15,935 Pts.
But currently the Crash is Dominating the Trend till now.
Still NIFTY is Potential to Mighty blows of Bulls.
The Bear Run could over at 15,935.
Once it breaks out the 15,935 level then the Bears are Dead for 1 or 2YRS.
Expected 22,578 Pts from 15,935.
Long live the Bulls.
Thanks for using your Valuable time. Leave a like which helps me to do better. Follow me for Daily Signals,
Get updates on, FOREX, Stocks, INDICES, Crypto, #--CFD's to be expected soon. (Share to your Market Friends)
Check the Comments!!!

Nifty 50Nifty 50 (Spot)
LTP: 15301.15
Support: 15280.70
Resistance: 15431.75 (All-Time High)
The weekly charts are clearly in an uptrend and we may be heading to the all-time high sooner than we can expect and soon Nifty will become busy making new highs.
My question is that, how long are we going to sustain the highs without a correction? Do you remember how Nifty tumbled from 15431 to 14151.40 before it made a reversal? That is what I am talking about.
I don't say we might witness 14100 levels again but I am expecting a running correction.
If you are long, hold you positions with trailing stop losses
If you are waiting, please wait for the right opportunity.
If you want to go short? You can sell on rise!
NoTa (No Trade)
p.s. weekly chart gives me hints of a double top pattern which is way more scary than we'd expect.

NIFTY Analysis for MAY(27)TRICKY NIFTY
The Price Action developed some Gain in momentum.
Also, the price action is showing some tricky moves.
Super Trend is on Default Bull Run over long time.
Tomorrow is said to be a Bullish Day.
But as a Negative Structure.
Gap Up opening to be expected.
Target range of +20 or above expected.
Check the Comments below!!! .
Thanks for using your Valuable time. Leave a like which helps me to do better. Follow me for Daily Signals,
Get updates on, FOREX, Stocks, INDICES, Crypto, #--CFD's to be expected soon. (Share to your Market Friends)

Nifty 50Nifty 50
LTP: 15291.75
Support: 15171.45
Opening interest in increasing in puts over calls. Our support will be 15100 but the stop loss is below 14900. The gap is way more than it should be.
Wait for 15100 levels before going long!

Nifty 50 View For Upcoming Week.Complete analysis and all the levels are mentioned on the chart.
We may expect a small consolidation range for 1-2 days and then Nifty-50 is likely to continue it's uptrend.
Thanks
SA Financials
📊 #nifty #nifty50 broader view 🎯NSE:NIFTY
if sustain above 15190 then it might go till Above harmonic PRZ
1st Target 15298
2nd Target 15328
3rd Target 15431
Trade with trailing stop loss, do your own analysis before taking trade.
******whatever charts or levels sharing here are just for educational purpose only not a recommendation. please do your own analysis before taking any trade on them. we are not SEBI registered.

NIFTY RETESTNSE:NIFTY has broken its previous resistance and given a strong closing.
The last candle is a Doji which coincides with High RSI.
It can mean that on Monday we can see a possible retest of the levels marked in the chart.
We can also see a possible Gap Up on Monday.
PSU Banks will be strong performers in the coming weeks.

Nifty- Testing for Demand before moving up! The previous supply zone must now become a demand zone = Change of polarity. In simple words, previous resistance must now become support.
P.S: This is NOT investment advice. This chart is meant for learning purposes only and is a part of my personal journal. Invest your capital at your own risk.

Nifty Expiry SpecialNifty consolidated before expiry today
As per option chain, calls are written more than puts
Support stands at 15000
whereas resistance is 15200
Gap may act as strong support and also if price tries to break today's high with good volume candle,
then shorts may get trapped and short covering rally may be expected.

Nifty 50Good Morning
I could somehow see that the markets might correct but I couldn't find logic. So, I decided to stay away.
Now, Nifty 50 has support at 15043.70 and resistance at 15170.85 so the risk to reward ratio changes today.
15100 is a crutial level. Open Interest in 15100ce is 2938350 and 15100pe is 2517450. We will see a new upside once we cross and sustain above 15100 levels.
15000 is a strong support as 15000pe has an Open Interest of 3003600 which is quite amazing.
So yes, we buy again between 15000 and 15100 levels with a stop at 14900 and targets will be 15200 / 15300 / 15500

14/05/2021 Research Report For NIFTY FUTURE JUNEBuy @ C.M.P (Current Market Price)
Sell Target 1 :- 15000
Sell Target 2 :- 15060
Sell Target 3 :- 15120
SL (Stoploss) :- 14300
Buy June Contact

NIFTY CHART ANALYSED FOR UPCOMING TRADING SESSIONS Did exactly what we’ve analysed !!
Had been telling you guys not to short and look for long
Also check the last analysis told you guys we can see a trending day of around 200-300 points move in NIFTY in single day and it did happen 🔥🔥
SPOT ON ANALYSIS ✅
Now trading at real crucial levels
As you can see the chart tells you all, multiple rejections from the trendline , we can expect sideways market for Tomorrow unless that trendline is broken and sustained above
On the other hand if broken we can see another trending day 🔥


Nifty 50Nifty
LTP: 14823.55
Support: 14803.05
Bullish till we don't get a closing below 14700.
Buy on dips for 14952 / 15000 / 15050+

Nifty 50Nifty 50
Closing: 14942.35
Charts
Support: 14771.45 / 14697.70
Resistance: 14952
DEMA
Support: 14837 / 14747.09 / 14673.96
Open Interest
14800ce: 9,30,000 (-10,46,325) - Highest call writing here which makes it a very crutial level.
--------
15000ce: 34,08,075 - Strong resistance / 1st target
15200ce: 38,32,500 - Final target
14800pe: 28,24,575 - 1st support (crutial level)
14700pe: 26,52,300 - Can enter into long positions from this level
14500pe: 34,42,950 - Strong support / stop loss
Should open around 14800. Risk to reward ratio in this case is very good.
***Buy on dips for target of 15000 to 15200.

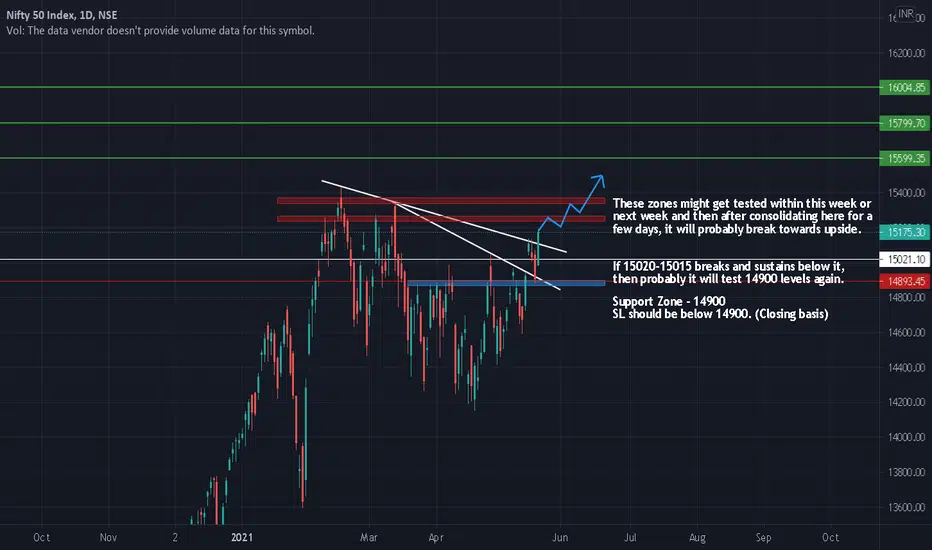
NIFTY CHART ANALYSED FOR UPCOMING TRADING SESSIONS All levels mentioned in the chart what has been tested multiple times and expected some good move if broken with proper candle close in upcoming trading sessions ✅
