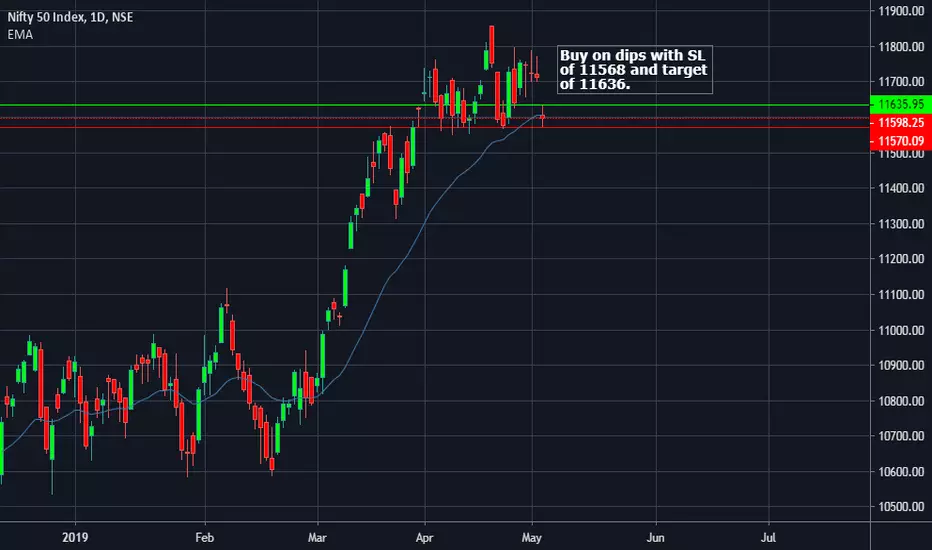
Niftylong

DAY TRADE || LONG || NIFTY || MIGHT TOUCH 11636One might want to buy Nifty on dips with SL of 11568 and target of 11636 just for today.

#Nifty #Intraday Go Long on Nifty above 11712, sustainable basis06th May 2019.
Very good setup for intraday trading in Nifty if someone gets nifty above 10712 on sustaible basis for half-one hour, Fresh longs can be initiated for the target of 11780-90.

Nifty 50 squeezed up waiting for massive explosion to upsideNifty 50 squeezed up waiting for massive explosion to upside

NIFTY 50: WEEK-TECH-SHEET->8th April 2019 to 12th April 2019ghstocktrading.webnode.com
NIFTY 50: WEEK-TECH-SHEET->8th April 2019 to 12th April 2019
Nifty 50 moves around -161.20 pips from 8th April 2019 to 12th April 2019, in which nifty 50 break last week 1st April 2019 to 5th April 2019 bottom 11559.20.
As mentioned on reference 15th March 2019 evening order
Nifty 50 attained target 1 yet to attain target 2,3 & 4
Target 2: 11777
Target 3: 11855
Target 4: 12090

NIFTY || BULLISH CANDLE POST A DOJIWe saw that Nifty did not pay heed to the Doji pattern today. Infact it took support near 11452 and bounced back and closed near the high for the day and in the process formed a bullish candle. One may buy Nifty with a SL of 11449 and targets of 11546/11565/11590.
A safer strategy would be on the options front

NIFTY TOUCH 12000 COMING SOON 1.BREAK 1983 GO LONG
2. TARGET 1100-11200
NIFTY CHANNEL AND BREAK NEW HIGH COMING SOON
THIS ALL MY IDEA.SO TRADE YOUR KNOWLEDGE
and more idea subscribe my chanel www.youtube.com


NIFTY 50: WEEK-TECH-SHEET-> 21ST January 2019 to 25th January 20NIFTY 50: WEEK-TECH-SHEET-> 21ST January 2019 to 25th January 2019
Nifty 50 moves around – 231 pips from 21ST January 2019 to 25th January 2019, in which nifty 50 break last week 14th January 2019 to 18th January 2019 top 10930.65
As mentioned on reference 19th December 2018 evening order
If it continuous to break 10985.15
Buy @t Entry: 10990
Stop Loss: 10890
Target 1: 11015
Target 2: 11023
Target 3: 11040
Target 4: 11090

Buy NIFTY- Ascending Triangle
- Symmetric Triangle Within Ascending Triangle
- 50 MA Trending Upward
- Price Rejection of Support
Do not short any stock or NIFTY at any cost unless you want to burn your capital! Such contraction on an index is exceptional

!!!! NIFTY BREAKS 10870-10920 RANGE !!!!!NIFTY BREAKS 10870-10920 RANGE
(BAR OPEN AND CLOSE RANGE)
HELD ABOVE THE RANGE FGR A WHILE
HENCE EXPECT A NEW RANGE ON THE UPSIDE
BUY NIFTY NEAR 10930
STOP@10910
TARGET@10980
PRICE LEVELS ARE PER CASH LEVELS
PLEASE ADJUST FOR FUTURE LEVELS
OPTIONS TRADE MORE VIALBE


False Breakout, Bears Trapped..! Now 11000 Coming..!! Diamond Pattern Modified. Support Line (White) drawn from the Nifty Low of 10000 made on 26th October and touching other lows that price made during contraction towards the Diamond Apex.
On 14th Jan Monday.. What we witnessed was a False Breakout on Downside. Price Broke 10700 level in Intraday but bounced back in later half to close above the support line.
Today (15th Jan) price broke out of the triangle/diamond with heavy volumes, sustained above and also closed above. Aggressive short covering was witnessed in Nifty Futures as well As Options. Fresh Longs are built. This Breakout looks true and any dip should be bought from here.
Trade Setup:-
Spot - 10886
Buy On Any Dip Till 10820
SL - 10740 on day closing basis
Targets - 10880 / 10930 / 10980 / 11030++

NIFTY 50: WEEK-TECH-SHEET-> 7th January 2019 to 11th January 201NIFTY 50: WEEK-TECH-SHEET-> 7th January 2019 to 11th January 2019
Nifty 50 moves around – 137.15 pips from 7th January 2019 to 11th January 2019, in which nifty 50 did not break last week 31st December to 4th January 2019 top nor bottom.
As mentioned on reference 19th December 2018 evening order
If it continuous to break 10985.15
Buy @t Entry: 10990
Stop Loss: 10890
Target 1: 11015
Target 2: 11023
Target 3: 11040

NIFTY [forcast] Long bias, looking at 11kI anticipate they would at-least break 11,000 before attempting to correct to the downside.


NIFTY 50 RIDE HALTED!!!nifty 50 moves around - 246.50 pip this week from 17th December to 21th December 2018 which seems to be bearish, if it should continue positive it is better to wait nifty 50 to break 10985.15
as mentioned on reference 19/12/2018 evening order
if it continuous to break 10985.15
Buy @t Entry: 10990
Stop Loss: 10890
Target 1: 11015
Target 2: 11023
Target 3: 11040
Target 4: 11090


Nifty Elliott wave analysis for 17th Dec 2018Starting from 10334 it seems currently we are in (iv) of (C or 3). wave (iv) retracement level 10740-10693 can be buying opportunity with stop loss of 10655(Not so accurate). From that buying range nifty can bounce up to 10838 and further it can also extend up to 10865-10941.

Nifty Elliott wave analysis(weekly) for 17th to 21st Dec 2018This sharp decline from 10941 to 10334 is seems like personality of wave C. And recovery towards 10941 after that sharp fall is also indicating that it might be an irregular correction pattern was completed from 10645-10440(as A), 10440-10941(as B) and 10941-10334(as C).
As per this wave count 10974-11126 is the minimum target range, even if wave started from 10004 is corrective. As of now we should not be concern whether its ABC or 123.


Nifty Elliott wave analysis for 12th Dec 2018It seems wave (A or 1) is completed at 10565 and retracement levels for wave (B or 2) are given in chart. which can be used as buying zone with stop loss of 10333 which is of almost 100 points so plan your trade by analyzing wave pattern on live chart tomorrow. Good luck.
