NIFTY INDEX SUPPORTS AND RESISTANCE (LONG)DO NOT PANIC IN SITUATION
20th Nov 2018 and 21st Nov 2018 fall in NIFTY occurred due to correction and profit booking
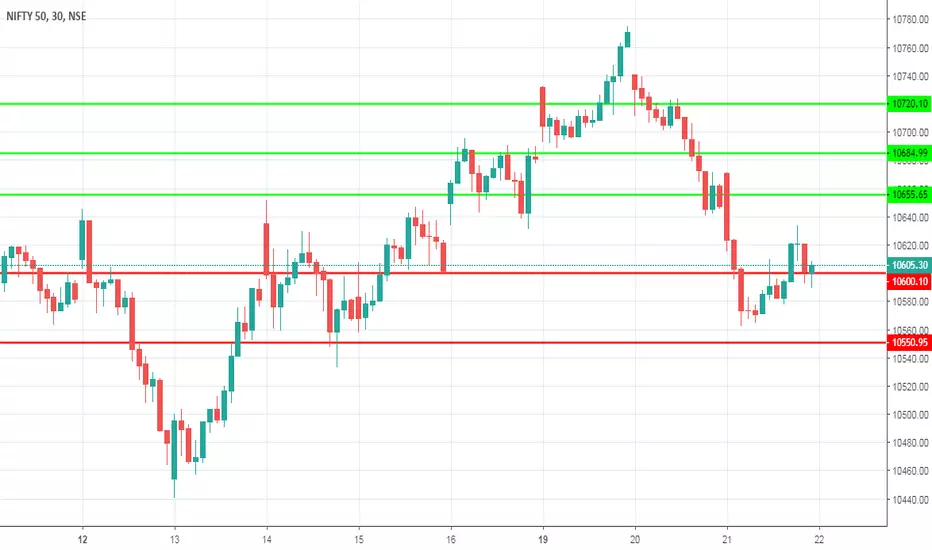
Important support around 10600 and 10550
If NIFTY holds 10620 it may move towards Resistance 10655, 10685 and then 10720 onward and also rally upto 10815
in the next week expiry NIFTY may even move towards 11350
Niftylong
Nifty Enter Fighting Zone Keep watch...Nifty Enter Fighting Zone Keep watch... and also form AB=CD
Expect zone 9950 to 10150
watch also Global Factors...
Possible to drop down
Disclaimer:
The information contained in this presentation is solely for educational purposes only.

Nifty Elliott wave analysis for 16th Nov 2018Nifty have not achieved minimum target of 10666 which can be achieved in coming sessions. Even if nifty failed to achieve 10666 and came down then 10526-10444 is support range and from this range again Nifty can bounce to 10666 and above. Down side reversal is only possible below 10444.

Dollar not so dear!!It seems dollar may slide down, thereby helping Nifty again take short bull run.
Although Politics may play its role but still signs are of appreciating rupee.
Lets see!!
It may have a minor negative impact on Indian IT Stocks.

Nifty Elliott wave analysis for 14 Nov onwardAs expected wave (iv) completed as irregular correction at 10440. Now wave 5 projection range is coming at 10666-10803 which can be achieved in coming sessions.
Tomorrow intraday buying range is coming at 10571-10555. If Nifty breaks 10596 in opening only then buying range will change according to that but if nifty enter in 10571-10555 range without breaking 10596 then buying can be done with stop loss of 10540.


Does nifty has the chance to reach 11100?Yes it is possible because most of stocks in nifty 50 has shown a reversal for retracement.
crudeoil and USDINR staring its correction in monthly time so we can expect nifties 11100 before dec end

Nifty Nov 5-9 Week ExpectationWe will have reversal by this week ....
Expected level for next week...
Will update further based on EOD data....
Recommended to Use with trailing stop loss.
Each number mentioned here one important support/resistance..If break and hold one number then only next number valid.
Buy above 10558 chance for 10578 - 10603 - 10629
If reversed near 10603/10629 then go with TSL upto 10583 - 10562 - 10537
If Breaks and stays above 10603/10629 - 10655 - 10681 - 10706
10706 - 10712 is important support
If stays above that chance to go upto 10732 - 10758 - 10784 - 10810 - 10840
If failed to hold 10712 then go with TSL 10686 - 10665 - 10640 - 10614 - 10588
If negative open on Monday
Sell Below 10531 chance for 10511.50 - 10485.88 - 10460.29 - 10434 - 10399 - 10383/10358/10332
If Reverse near 10383/10358/10332 then chance for 10404 - 10424 - 10449 - 10475 - 10501
Will update further levels after getting direction

Views on Nifty50 India According to my opinion, Nifty is at strong support and there is high probability of its reversal. In forming this opinion in falling market, following considerations have been made:
1. Nifty is trading at strong support zone which has been drawn on the chart based on past price behaviour. Hence strong support exits in range 9950-10000 (NSE -Spot)
2. Clear bullish divergence can be observed on RSI which has been marked on the chart.
3. Bullish divergence can also be seen on Bollinger band which has also been marked on the chart.
4. It is also observed that highest open interest ( put option ) in current series (November 2018) is built up at strike price of 10,000 indicating strong support.
Hence, there is possibility of upside of Nifty up to 10490 which is resistance as shown in the chart.
Happy trading !!! Kindly share your opinion and viewpoints

Nifty Broken Crucial Support of 10302Nifty Broken Crucial Support of 10302, Now the Next Support is 10,161
Last Support Is 9,950

NIFTY50 on Support Zone 10300 Points Must See This Chartif support fail then you can seee easly More Correction upto 9000 Points in NIFTY 50.
Price Retest on Support Level then very soon also a Heavy Bullish Trend upto 12500 Points.
Let c ...
Stay Tuned...........!!
Learn Here , Earn EveryWere

Dead Cat Bounce / Relief Rally..!? Nifty Outlook 8th to 12th OctLast week we witnessed some intense selling. Nifty Lost close to 800 points in just 3 trading sessions. Now what next...!? Normally after such intense selling there is a pullback or a dead cat bounce. Also some key factors in the coming week which can trigger a pullback can be Cool off in Crude Prices, USD INR and Improved Q2 earnings from heavyweights like TCS, HUL etc.
Coming to technicals, 10100-10180/200 is a demand zone (blue shaded region). Also 10200 is a support as per OI Data. Expect some pullback if these support levels/demand zone holds. Resistance Levels or Targets for Pullback are mentioned below(also marked on chart with yellow lines):-
*10400-420
*10540-560 (strong resistance)
*10600
*10750-60 (major resistance)
There can be a very short term uptrend so I wont advice anyone to add positional longs.
Note: Trading pullbacks in a falling market is risky. Market trend is Sell on Rise. Ideally shorts should be added at every resistance level.

Buy Nifty Above 10420 Target 10550 / 10750Nifty is forming a double bottom formation. Neckline at 10400.
Trade Setup (Spot Levels)
Buy Above 10420
SL 10300
Target 10550-580 / 10650 / 10750

Nifty 10450 - 10210 on Oct 9, 2018 (read on chart for details)Technically Nifty is in down trend but I have explained on the chart
Tomorrow range is 10210-10450 and
if breaks 10,190 then down further
if breaks 10,480 then up further

Nifty - Policy Push / Harmonic Push - Long Term Investors@9950Hello Friends
13:50 Hrs - 5th Oct 2018
Last Price@10410
Analysis done on spot data ( New Members)
Profile status updated@09:30Hrs – 5th Oct 2018
Careful Long Term Investors - Traders can expect a short term bounce 10500 & Above.
Short Term Trading Strategy - Bullish Harmonic Crab Pattern
Look to buy the bullish crab and expect short term bounce in next week as suggested below / over the video.
Risky Traders
You can buy if it sustains and holds in the range 10400-10425 for below mentioned targets. Do not consider this pattern below 10390-10400 zone as suggested over the video.
Safe Traders
You can buy above 10500 – Next week after taking rest over the weekend.
Targets
Target 1 - 10675-10700 zone
Target 2 - Only Above 10750 if holds then 10825 -10850
Target 3 - Above 10850 for Destiny & Demand Zone 10900-10925
Target 4 - Above 10925 for 11000 – 11035
-------------------------------------------------------------------------------------------------------------------------------
Long Term Trading Strategy - 3 months to 6 months prior heading into 2019 Lok Sabha Elections
Taking out critical zone 10500-10550 –we expect deeper corrections in coming few months & heading into early 2019.
Key Support Zone
9950-10000
Critical Support Zone
7900-8100
-----------------------------------------------------------------------------------------------------------------------------------
Excited to share all the updates at one place & how fortunate to sell all the tops in 11760 to 10500-10550 critical zone as of 5th Oct 2018.
New Followers - All previous ideas & excitement which we shared together
Catching The Top at 11760’s
Catching the Top at 11600’s
Catching the Bounce 11300 to 11475 & Taking Rest at 11500
800 Points Target Reached at 10900-10925
Market opens – Magic Starts - getting the bounce from 10900-10925 zone
Destiny or Demand Zone 10900-10925
Destiny or Demand Zone Repeats 10900-10925
Do support & motivate me to come up with more such videos.
Next we cover most important stock update – Century Ply – Expected fall from 230-240’s to 135-155 zone.

Bulls need to protect 10750-770 or else it's *GAME OVER*Nifty is resting at support of 10820-50.
Global sentiments like Rising Crude, Depreciating Rupee, Rising Bond Yields and not to forget Trump threatening to impose sanctions on India are the major reasons of such big selloff.
These negative sentiments will shift Nifty lower towards its 200 days exponential moving average(DEMA) placed at 10770. As per Options chain support lies around 10700.
3 consecutive closes below 10750-770 can trigger a start of a Bear Market ending a long 32 months of Bull Run from January 2016 to August 2018.

Nifty Hourly - Pullback Possible above 11040Positive divergence in MACD and bounce from trend line support indicates of a possible bounce back. Expect good short covering if Nifty sustains above 11040.
For detailed resistance and support levels, refer to my under linked analysis of 15 Minutes Nifty Chart (Click on the chart to open)

Nifty can move upto 11,100 or above tomorrow Oct 3,2018Nifty will open low, after an hour or so will start moving upward. And can go upto 11,100 or above.

NIFTY can move up by 100 to 150 points on 24th sepAs per my analysis NIFTY can move up by 100 to 150 points.


Where is NIFTY heading?NIFTY is now at 1st major support at around 11250-11300. Buying momentum should start from here else we may see even lower levels

Nifty - Weekly Review - 09-09-2018NSE:NIFTY
Last two days Bullish signal. So I'm Bullish this week.
Resistance at 11620, 11700, 11760
Support at 11495, 11460 & 11400
