Nifty 8th May 2023
Private sector banks are being dragged down nifty. Specifically HDFC twins.
Market can be range bound between 18045 to 180145.
Buy above 18147 (18100 CE) Target 18184,18367
Sell below 18045, (18100 PE) Target 18002,17944,17887,17858
Nifty weekly candle stick pattern indicates Head and shoulder pattern as well.
Niftylong

Nifty Weekly Prediction based on 15 Mins ChartNifty based on 15 Mins Charts looks ready for 18600 in 5-6 days time.
Risk Reward - 1:5
Downside Risk 100 points ... Upside Target 500 points.
Happy trading !!!

Bulish Nifty towards 18800NSE:NIFTY , nifty will go towards 18,800 mark which is previous resistance . but at this time it will consolidate for some time , nifty make reverse head and sholders pattern which show bullish momentum.

Nifty Analysis!Ascending Triangle Pattern in Nifty 15 Minute Timeframe
Will Nifty move as per Ascending Triangle Pattern Analysis? Let's see!!!
As per Ascending Triangle pattern analysis the projected Target will be 17907.70

Nifty View For Tomorrow 21-4-2023As Per 1 hour time frame from last 2 day price has been trading between 100 point range 17580 -17680 While 17680 Resistance For Nifty and 17580 Support For Nifty .
Fresh Buy Above 17680 For Target 17750
Sell Below only 17680 For target 17500 And 17500 is 200 EMA in 1 hour Time Frame ..
Disclaimer :- Trade With Your Risk management.

NIFTY : Levels for 25th AprilNifty traded same as per our view shared yesterday on video & tradingview. Today its stop at resistance zone and now its important to break today's high for Nifty. I cannot find any seller pressure yet on chart.
I will follow price action and levels from chart
I have given my personal view on this video for Nifty & Bank Nifty.
Like, Share, Comment for regular updates.
Disclaimer
I am not sebi registered analyst
My studies are Educational purpose only
Please consult with your Financial advisor before trading or investing
I may be 100% wrong as its my personal view only.

NIFTY 25th April 2023 Setup (looks bullish) BUY Above 17754 (NIFTY 17650 CE) Target 17815, 17866,17916,17981
Sell Below 17656 (17600 PE) Target17556, 17498,17419
Short covering at 17700,1760,17600 and resistance buildup @ 17800 and 18000

Nifty 50 intraday chart analysis elliot wave analysis nifty 50 15 minute chart market go upside coorective wave and again come wave c

Nifty Levels for 19-04-2023.Nifty Level Buy Above 17670
SL Below 17630
Or Buy on Retest Level as per chart.
Sell Below Today Low 17610
SL as per Above 17660

NiftyOn weekly Charts nifty looks at suppor on cloud.. Looks like can give a reversal from here..
Buy with stop loss of closing below 16850 or 16950 if less risk..
targets 17350 17630 17890

Nifty Uptrend movement potential upto 17700 in 15 min timeframe.Nifty Uptrend movement potential upto 17700 in 15 min timeframe.
Time frame:Day chart
In higher time frame, Nifty is on downtrend movement.
Check the moving average and Macd Indicator, Moving average 20 is below moving average 40 and MACD, the value is below zero. So, Nifty indicates downtrend movement in higher time frame.
Time frame :15 minutes
In 15 minutes ,the value of the Nifty breaks out of the parallel channel and is going up Trend up to 17700.
Check the MA & MACD. THe value f MAC is above zero.Moving average 6 is above MA 20 && MA 20 is above MA40.So, this indicates Uptrend Movement in a lower time frame.
Hope our analysis is adding value to your TRADING JOURNEY.
NOTE: Published Ideas are for ‘’EDUCATIONAL PURPOSE ONLY’’ trade at your own risk.
NOTE: RESPECT The risk. SL should not be more than 2% of the capital.

NIFTY : Long play for 8.5% (FY 23-24)A conservative TGT of 8.5% (Expected GDP for FY23-24) in NIFTY based on Price Action.
An imperfect WW TGT also coincides with this level (TL in purple color)

Going long with Nifty future.I am going long with NSE:NIFTYH2023 on intraday, my stop loss for long is at 17000.95

Going Long with Nifty future.Technical charts of the Nifty march future suggest bullishness, I am going long at CMP(17144) and will add more below 17082.85, my stop loss for long is at 16983.

buy sidebased on ichimoku theory
buying nifty for target range
17600-17680
stop as per choice
disclaimer - trade @ own risk

NIFTY : 20 MARCH@NIFTY50 today support and resistance,
S1 - 16956 ,
S2 - 16850
R1 - 17152
R2 - 17315
Global News:
*UBS in talk with Credit Suisse , Complete take over of Credit suisse for $1bn dollar - Postive news for banking
* Warren Buffett in talk with fed - regarding banking sector collapse.
But in contrast - Banking sector needs external support to survive - negative for economy. Further collapse of any banks will impact market.
Feds aggressive money printing during corona and currently aggressive interest rate hike may dent financial sector to some extend.
Can see, intraday bullish but long term is unpredicatble.

NIFTY 50 - MONDAY 20-03-23In the last few days, the Nifty50 has found support near 16800 and has risen to 17123. The hourly chart shows that Nifty's support level is around 16985-86. So, I'll keep my long position until the Nifty crosses 17000. According to my forecast, the index will reach 17250 within the next few days.
The SGX Nifty is down significantly on Friday. The market is expected to open lower on Monday. However, it is an opportunity for swing traders to open a new long position.
This video is for educational purposes only. Please make any investment decisions after consulting with your SEBI Registered Analyst or advisor.

Going long in Nifty Futures.I am going long on Nifty March futures at CMP(17112) or below, my stop loss price for the long position will be 17001.35

Nifty chart for 14-March-2023 - price area to watch out for On 14th March 2023 , Nifty Spot prices to watch out are 17325 to 17375 (previous support broken area) and Fib levels - 17460 & 17540

buy nifty again on retrenchment on golden ratiofibo golden ratio around 17500 +- 30 if somehow buyers defend this levels we can see more upmove in coming days Friday need to close above 17550 we can plan buy tgt should be 18200

FASP levels for Nifty 02/03/2023The FASP for Nifty is listed for 02-03-2023 . You can add this levels to your trade setup for better results. This should not be the only indicator but an additional tool to increase your winning possibilities.
What is Fibolysis Anchor SupRes Points(FASP)?
It is a unique level arrived by using Fibonacci Retracement , Fibonacci Extension , Standard Pivot levels under various Timeframes. It is an extensively analyzed level to draw the support and resistance levels for the next day. You can use these levels along with your trade setup to increase your winning odds.
Validity of the levels: 1 Day
How to use these levels?
The three levels on both sides are usually easily achievable. The Targets above are bit difficult to achieve in a single trading session. I use this fact to write intraday positions and to buy options.
Color Coding: Green is regular support and buying area, Red is strong exit area
Disclaimer: This is shared in the interest of educational purpose and for knowledge enhancement. Kindly refer it in the same light. I am not responsible for any profits or loss incurred based on this information.

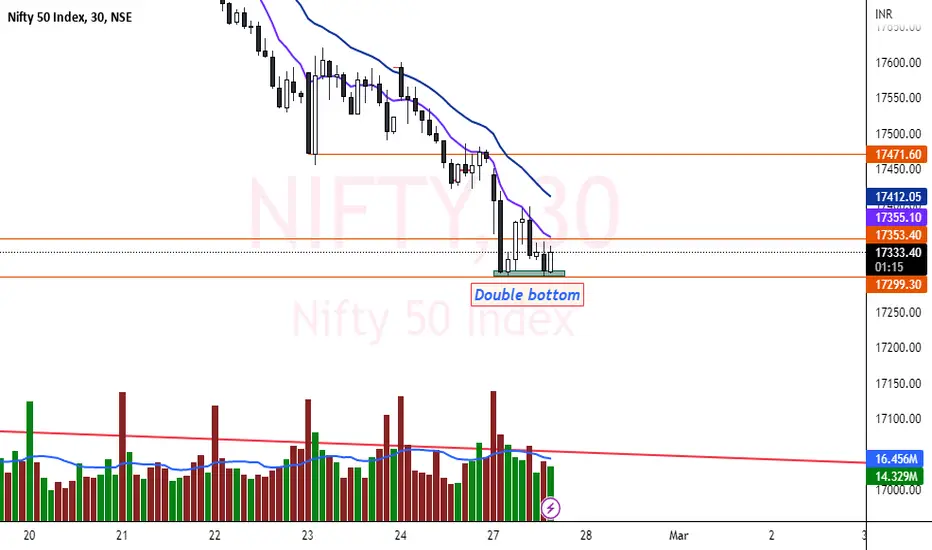
Nifty chartNifty made Double bottom 30 min chart but its will bullish above 17350 to 17355 level
Short term BULLISH VIEW
Those level only educational purpose..
Nifty ascending triangle formation Nifty ascending triangle formation bullish only above 18260 daily closing
