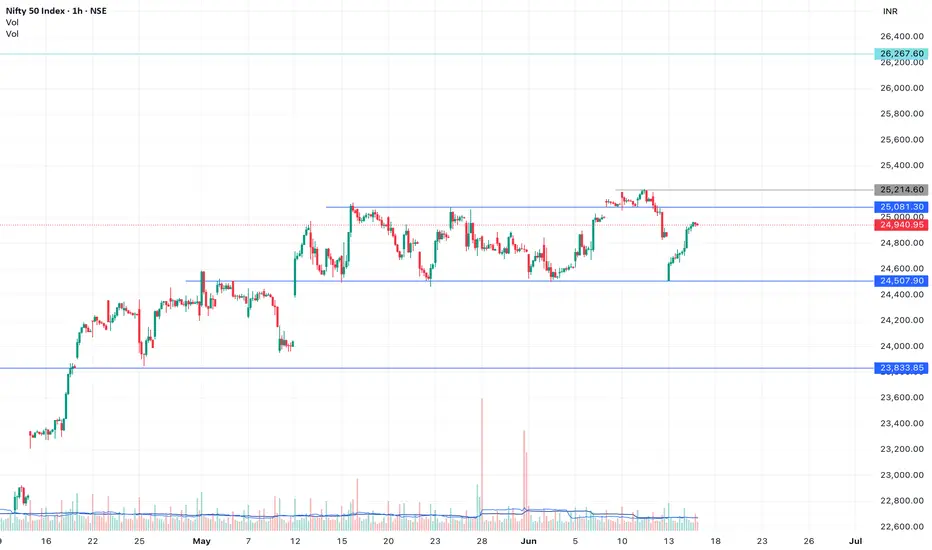
Nifty chart for 17th june 2025Looks like Nifty is in a range. Also, it took support on 24500 level.
Disclaimer: All information provided here is for educational purposes and not a recommendation, advice, research report, or stock tip of any nature. Analysis Posted here is just our view/personal study method on the stocks, commodities or other instruments and assets.
Niftyoutlook
nifty analysismay be nifty will positive in this month from monday. nifty next target is ATH. after that i aspecting a fake breakout . then nifty will fall upto 24100- 24000 levels . we see 24000 levels in the month of september.

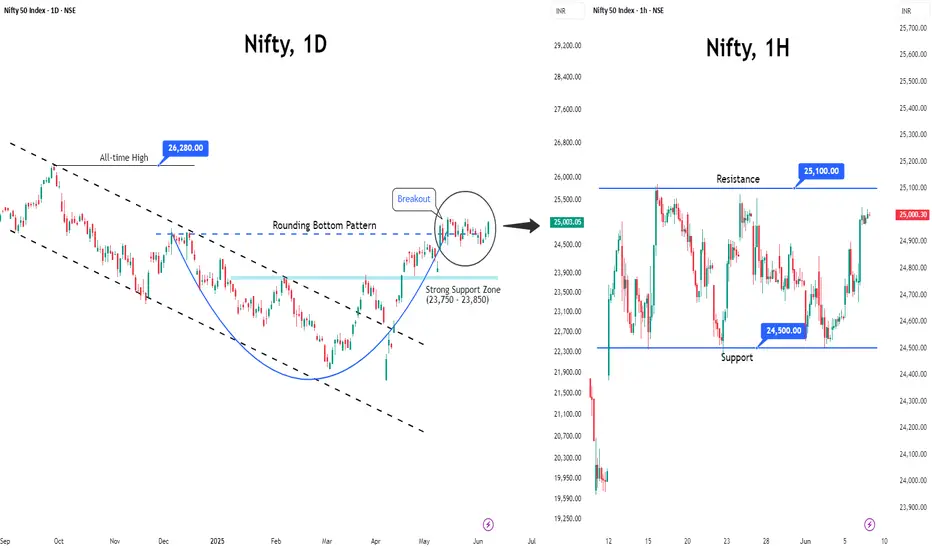
Bulls on Standby: Can Nifty Unleash Its Next Leg Higher?As anticipated, Nifty consolidated within a 600-point range between 24,500 and 25,100 last week, ending with a modest weekly gain of around 1%.
Volatility eased as well, with India VIX declining by 9% to close at 14.63, reflecting improved market stability.
Open Interest (OI) data indicates immediate support at 24,800, backed by the highest concentration of put writing.
Looking ahead, there is a strong possibility that Nifty may breach the 25,100 resistance level in the coming sessions, which could trigger a swift rally toward the 25,500 mark.
Nifty's Baby Shower: Will Mother Candle Deliver Before Expiry?👶📉📈
Will Mama Candle Deliver Before Expiry or Hold the Bump?
Hey traders, grab your popcorn (or baby carrots) because the Nifty is hosting a drama worthy of a maternity ward! Let’s break down this prenatal price action without any fancy indicators—just pure candle gossip !
The "Mother Candle" Saga
On May 15th, Nifty formed a MOTHER CANDLE (high: 25116, low: 24500) that’s been “pregnant” with 8 little baby candles. That’s right, 8 days of consolidation, and Mama’s still holding her ground. Will she deliver a explosive breakout before the expiry, or is this a false pregnancy? Let’s diagnose:
Key Levels to Watch (aka The Baby Monitor)
Due Date Resistance: 25116 (Mama’s high). Break this, and we’re naming the firstborn “Rocket Singh” 🚀.
Support Zone: 24500-ish (Mama’s comfy yoga pants zone). Hold here, and the bulls get baby shower confetti.
Critical Breakdown: 24700. Crack this, and it’s a slippery slope to 24500. Close below? Call it a "Failed Pregnancy" :(
The Obstetrician’s Bias (Spoiler: Bullish)
The price action suggests Mama Candle’s still got that pregnancy glow. Bulls are sipping coconut water, waiting for contractions (read: breakout). But if 24700 breaks, the midwives (bears) might rush in with forceps.
Will the Water Break This Week?
Bull Case: Mama holds 24500, pops above 25116, and we’re all godparents to a fresh uptrend. Baby shower theme: “All-Time Highs & Diaper Flys.”
Bear Case: A breakdown to 24500 turns into a ”diaper blowout”—messy, stinky, and nobody’s happy.
Trade Setup: Pack Your Hospital Bag
Long Entry: If Nifty snuggles above 24700 and eyes 25116. Bring tissues for happy tears.
Short Trigger: Close below 24500. Cancel the baby registry and buy bearish pacifiers.
Stop Loss: For bulls, keep it tight below 24500. For bears? Don’t get kicked out of the delivery room.
Final Thought: The expiry clock is ticking louder than a 3 AM baby monitor. Will Mama Candle push this week, or will the 24500 support double as a crib? Either way, keep your charts clean and your risk management tighter than a onesie.
Disclaimer: No actual candles or babies were harmed in this analysis. Trade at your own risk—parenthood (and trading) is unpredictable! 🍼🕯️

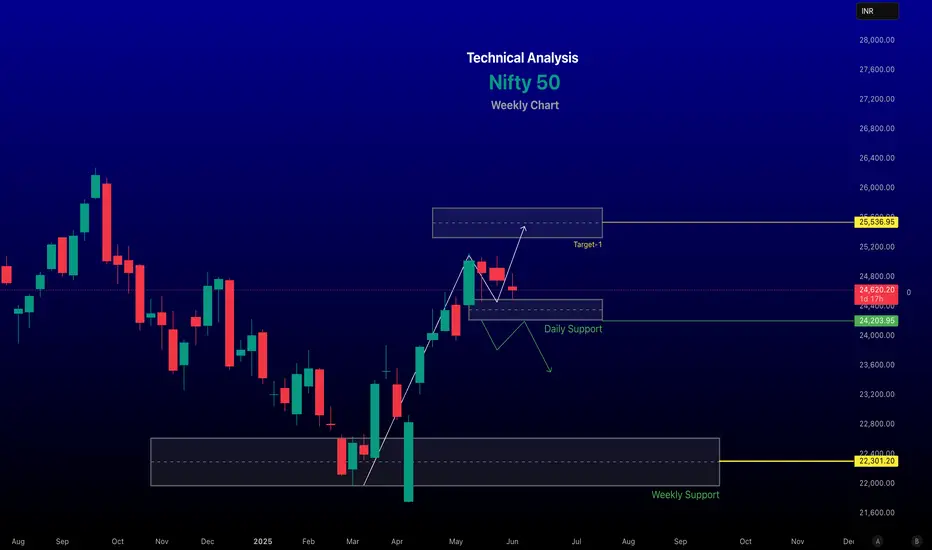
Nifty 50 Weekly Technical Analysis for June 02–06, 2025~~ Technical Analysis ~~
Trend: The Nifty 50 is currently in a Sideways trend. A close above 25800 level could signal a shift to a bullish trend.
#Support and Resistance:
Support: Key levels at 24,552, 24,485, and 24,200 further buying expected near 24,300 if breached.
Resistance: Immediate resistance at 24,666, 24,712, and 24,780. A breakout above 24,900 could push the index toward 25,200–25,600, while a sustained move above 25,050–25,070 may target 25,350–25,600.
Chart Patterns: The Nifty is consolidating within a 24,600–25,050 range, moving within an ascending channel. A bearish candle formed recently, breaching the 20-day EMA, indicating potential weakness unless it holds above 24,300.
Momentum Indicators: The Relative Strength Index (RSI) is mildly bullish at 65.47 for Bank Nifty, but Nifty-specific RSI data suggests consolidation. Oversold conditions (RSI sub-30) have historically signaled potential bottoms or bounces at levels like 23,900–24,100.
-- Disclaimer --
This analysis is based on recent technical data and market sentiment from web sources. It is for informational and educational purposes only and not financial advice. Trading involves high risks, and past performance does not guarantee future results. Always conduct your own research or consult a SEBI-registered advisor before trading.
#Boost and comment will be highly appreciated
Nifty Inverted Head and Shoulder Bullidh Breakout possibleNifty has confirmed an Inverted Head and Shoulder breakout around 22,650, indicating a strong bullish momentum. This classic reversal pattern suggests that buyers are gaining control, and further upside movement is expected.
Trade Setup:
Entry: Above 22,650
Stop Loss: 22,350 (below the right shoulder)
Target: 22,950 (measured move projection)
Technical Analysis:
The neckline breakout with good volume confirms bullish strength.
RSI is showing positive divergence, supporting the uptrend.
If Nifty sustains above the breakout level, we may witness further upward momentum.
Risk Management:
Always follow proper risk-reward management.
Keep position sizing appropriate to your risk appetite.
Avoid over-leveraging.
Disclaimer: This analysis is for educational and informational purposes only and should not be considered financial advice. Trading in the stock market involves risk. Please do your own research and consult a SEBI-registered financial advisor before making any investment decisions.

Berger Paints | Inverted Head & Shoulders Breakout Breakout Analysis:
Berger Paints (NSE: BERGEPAINT) has given a breakout from an Inverted Head & Shoulders pattern on the daily chart, indicating a potential bullish move ahead. The breakout level is around ₹509, which now acts as immediate support.
Trade Setup:
📈 Entry: ₹509 (Breakout Level)
🔹 Stop Loss: ₹487 (Below the right shoulder)
🎯 Targets:
Target 1: ₹520.45
Target 2: ₹530.60
Target 3: ₹542
Technical Observations:
✅ Volume confirmation on breakout.
✅ RSI moving above 60, indicating strong momentum.
✅ Price sustaining above key moving averages.
Disclaimer:
📌 This analysis is for educational purposes only and should not be considered financial advice. I am not a SEBI-registered advisor. Please do your own research and consult a financial professional before making any investment decisions. Trade wisely! 📊

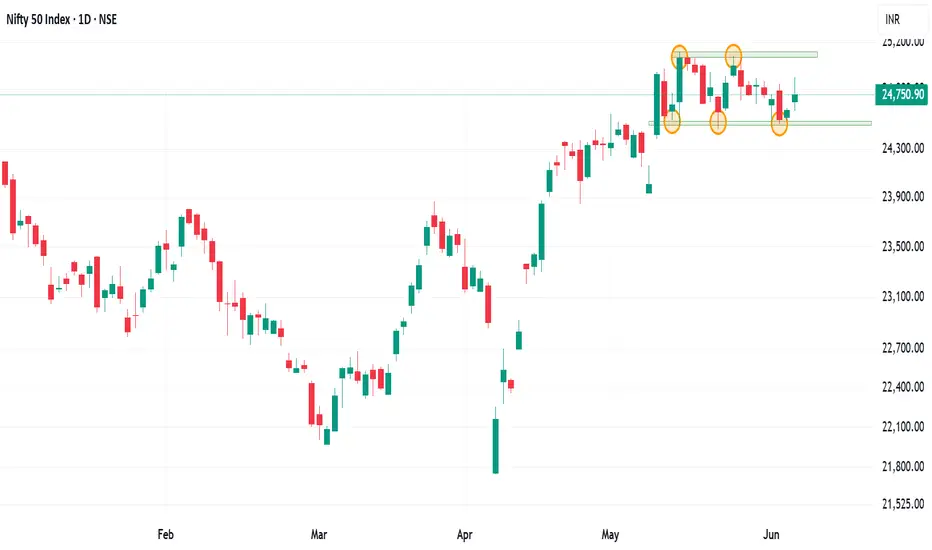
Outlook on nifty 50 for the next week. Is it going trending?Nifty 50 on the daily chart is trading in a range and has respected the zone quite effectively.
Index has remained sideways since a 3.82% move on 12th may. Market trade in cycle and after a sideways cycle, a trending market is predicted.
Either side movement can be seen in the index as 18 bars or 24 days it has remained in the range.
Major Resistance :- 25125, 25500
Major support :- 24500, 23930
This 600 range and change into same range of trending market.
Even the moving averages are coinciding and forming a MA gate which can give good momentum trading setup
Wait for the price action near the price levels before forming a trading basis. Trade only the setup and wait for the retest on either side.
Last one dance for NIFTY!!!!!!Scenario 1 ;
As per my analysis of nifty is declining with tight movement for last few days( consolidating lower)
Yesterday price rejected from one hour(1h) order block(ob) after that it moves quiet good.
For that reason ,today I am expecting more bullish in nifty( aggressive bullish).
Expecting +3% movement.
Scenario 2 ;
If nifty break and close below yesterday low, then it's all going to fall( sharp decline) from the sky to sharp edge of
the mountain( get support) and slowly tears ( after that slowly consolidating lower).
Expecting -5% movement.
Do your own analysis before taking trades. Peace.

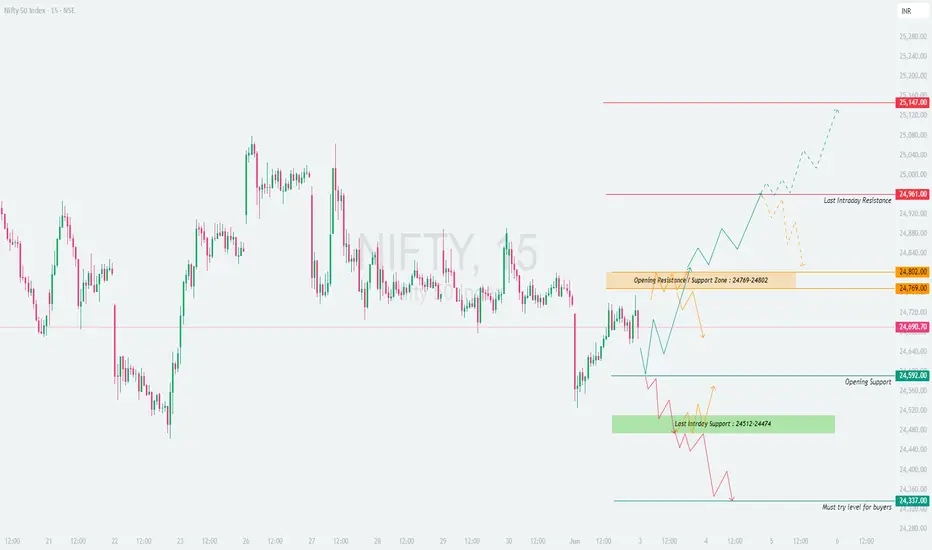
NIFTY : Trading levels and plan for 03-Jun-2025📘 NIFTY 50 – TRADING PLAN for 03-Jun-2025
🕒 Timeframe: 15-minute Chart Structure
📍 Gap Opening Threshold: 100+ points from the previous close of 24,690.70
🔼 GAP-UP OPENING (Above 24,802):
A gap-up above the Opening Resistance / Support Zone (24,769 – 24,802) signals early bullish sentiment. However, Nifty will face immediate resistance at 24,961, which is the Last Intraday Resistance . If that is crossed, the path opens toward 25,147, the next major resistance level.
✅ Plan of Action:
• Let the first 15–30 minutes unfold. If price sustains above 24,802, and forms a bullish 15-min structure (e.g., a higher high candle or retest + bounce), then consider going long above 24,820–24,840 zone.
• Targets:
→ First: 24,961
→ Extended: 25,147
• Stop-loss: Below the retest candle or under 24,769, depending on entry zone.
• Avoid chasing trades directly near 24,961. Let the level either break cleanly or give a pullback opportunity.
🧠 Educational Insight: Gap-ups tend to get tested. Don’t trade breakout levels blindly — instead, wait for a strong base formation or retest bounce before entering.
⚖️ FLAT OPENING (Between 24,690 – 24,769):
This zone lies within the broader consolidation area and right below the Opening Resistance Zone. It’s a sensitive area where the market may attempt either a base-building process or fake breakouts.
✅ Plan of Action:
• Avoid trading immediately at open. Let price test either side of the 24,769 – 24,802 resistance band.
• Long Setup: A clear 15-min candle close above 24,802 with volume support allows a long trade targeting 24,961 and possibly 25,147, with SL below 24,769.
• Short Setup: If price rejects 24,769 – 24,802 with a strong bearish pattern (e.g., evening star or shooting star), consider a short toward 24,592, with SL above 24,802.
• Treat this area as “No Trade Zone” unless a clear breakout or breakdown occurs.
🧠 Educational Insight: Most false breakouts happen in sideways zones like this. Let structure unfold with confirmation before you commit to a direction.
🔽 GAP-DOWN OPENING (Below 24,592):
A gap-down below 24,592 indicates early weakness, and price may head towards the Last Intraday Support Zone (24,512 – 24,474) . The final buyer defense level rests at 24,337, tagged as the Must Try Level for Buyers .
✅ Plan of Action:
• Allow 15–30 minutes to observe market reaction.
• If price holds above 24,512 – 24,474 zone and gives bullish reversal candles (hammer, bullish engulfing), it could offer a long trade toward 24,592 / 24,690.
• Aggressive Shorts: If price breaks and sustains below 24,474, look for quick scalps toward 24,337, with tight SL above 24,474.
• Reversal Longs: At 24,337, only buy if a clear bullish pattern confirms reversal; otherwise, avoid catching a falling knife.
🧠 Educational Insight: Don’t assume every support will bounce. Wait for bullish confirmation or trend shift signals. Panic selling is common on gap-downs, but reward comes only with patience.
🛡 RISK MANAGEMENT TIPS FOR OPTIONS TRADERS:
✅ 1. Avoid trading the first 5–15 minutes post-gap opening — especially with naked options. Let price stabilize.
✅ 2. Use spreads (Bull Call / Bear Put) to reduce risk and theta decay in directional bias.
✅ 3. Don’t overleverage just because premiums look cheap — IV crush can wipe you out fast.
✅ 4. Keep a time-based stop-loss for option buys — if price doesn’t move in your direction within 15–20 mins after entry, reassess.
✅ 5. Always follow the chart, not your emotions . Don’t hold losing trades hoping for a reversal.
📊 SUMMARY & CONCLUSION:
• 🟢 Bullish Above: 24,802, Targets: 24,961 / 25,147
• 🔴 Bearish Below: 24,592, Targets: 24,474 / 24,337
• 🟧 No Trade Zone: 24,690 – 24,769 → Wait for breakout/rejection structure
• 🟩 Support Zones: 24,592 / 24,474 / 24,337
• 🟥 Resistance Zones: 24,802 / 24,961 / 25,147
• ⏱ Time-based Rules: Let 15–30 mins develop to avoid false breakouts and overtrading
✨ Final Thought: Respect the plan. Let the chart tell you what to do — not your bias. The best trades are usually the most boring, disciplined ones.
📢 DISCLAIMER: I am not a SEBI-registered analyst. This trading plan is for educational and informational purposes only. Please consult a SEBI-registered financial advisor before taking any investment or trading decision.
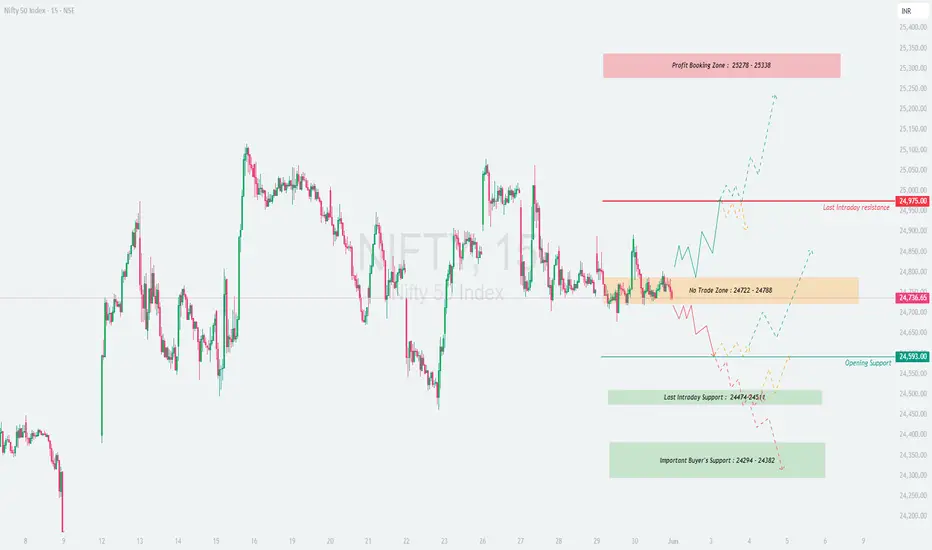
NIFTY : Trading Levels and Plan for 02-JUN-2025📘 NIFTY 50 – TRADING PLAN for 02-Jun-2025
🕒 Timeframe: 15-minute Chart Structure
📍 Gap Opening Threshold: 100+ points from previous close of 24,736.65
🔼 GAP-UP OPENING (Above 24,875):
If Nifty opens with a gap-up above the upper end of the No Trade Zone (24,722 – 24,788) , it indicates early strength and a potential breakout. However, it will face immediate resistance near the psychological mark of 24,975, which is the Last Intraday Resistance .
✅ Plan of Action:
• If the first 15–30 minutes show strength above 24,875 with bullish candles and follow-through volume, look to enter long above 24,900–24,975.
• Targets:
→ First: 24,975
→ Extended: 25,278 – 25,338 (Profit Booking Zone)
• Stop-loss: Below 15-min support candle or under 24,788 for confirmation-based trades.
• Avoid entering long trades directly near 24,975 unless a pullback-retest happens and sustains above.
🧠 Educational Tip: Don’t chase gap-ups blindly. Wait for confirmation like bullish engulfing or retest near breakout zone before taking the trade.
⚖️ FLAT OPENING (Between 24,722 – 24,788):
This is the No Trade Zone , meaning price is in indecision and trapped between key levels. Market may consolidate or build a base before directional movement.
✅ Plan of Action:
• Avoid trading the first 15–30 minutes. Let the price break out of this zone decisively.
• Break Above 24,788: Go long with SL below 24,722, targets: 24,975 / 25,278
• Break Below 24,722: Go short with SL above 24,788, targets: 24,593 / 24,474
• Watch for fakeouts – ensure breakout is supported by strong candle close and not just a wick.
🧠 Educational Tip: No Trade Zones are created for a reason – they usually trap impatient traders. Let the market choose direction and join the trend.
🔽 GAP-DOWN OPENING (Below 24,593):
A gap-down below Opening Support (24,593) suggests early weakness. Nifty may try to test deeper support levels near 24,474 – 24,451 (Last Intraday Support) and further toward 24,294 – 24,382 (Important Buyer’s Support).
✅ Plan of Action:
• Watch the 24,474 – 24,451 zone for signs of reversal. If a bullish reversal candle forms, a long entry can be attempted targeting:
→ 24,593
→ Extended: 24,722
• If 24,451 breaks decisively, expect momentum to carry prices toward 24,294 – 24,382.
• Short Trades: Can be taken only if price rejects bounce zones with bearish structure (e.g., bearish engulfing or retest failure).
🧠 Educational Tip: Don’t buy into weakness without confirmation. Bearish momentum tends to accelerate if support zones break early in the day.
🛡 RISK MANAGEMENT TIPS FOR OPTIONS TRADERS:
✅ 1. Avoid buying far OTM options after a gap opening – stick to ATM or near ATM strikes for better delta.
✅ 2. Use spreads (Bull Call/Bear Put) when expecting directional move with defined risk.
✅ 3. Never trade without a stop-loss ; even best setups fail in volatile markets.
✅ 4. Wait for the 15–30 minute structure to develop before taking directional trades.
✅ 5. Don’t average losers – instead, analyze the trade thesis and exit quickly if invalidated.
📊 SUMMARY & CONCLUSION:
• 🟢 Bullish Above: 24,788, Targets: 24,975 / 25,278 – 25,338
• 🔴 Bearish Below: 24,722, Targets: 24,593 / 24,451 / 24,294
• 🟧 No Trade Zone: 24,722 – 24,788 → Avoid initial trades, wait for breakout
• 🟩 Support Levels: 24,593 / 24,474 / 24,294
• 🟥 Resistance Levels: 24,975 / 25,278 / 25,338
• 📌 Key Rule: Let the structure confirm the bias – don't trade on emotions or pre-conceived notions.
✨ Final Note: Trade with discipline. Best trades don’t come every day — but risk-managed ones preserve your capital always.
📢 DISCLAIMER: I am not a SEBI-registered analyst. The trading plan shared above is strictly for educational purposes. Please consult with a SEBI-registered financial advisor before making any trading or investment decisions.
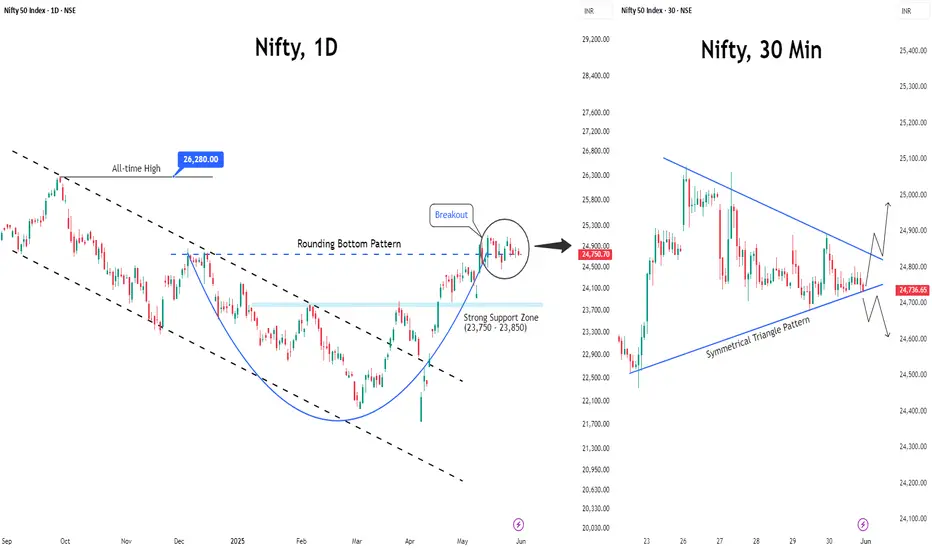
Nifty Outlook: Sideways Action Likely as June OpensAs anticipated last week, Nifty traded sideways, showing limited movement.
The current technical setup indicates the index may continue to remain range-bound in the upcoming week.
On the 30-minute chart, a symmetrical triangle pattern has formed, suggesting that a breakout in either direction could lead to a swift, short-term move.
Key Levels to Watch
Support: 24,500
Resistance: 25,100 – 25,150
A decisive breakout above 25,100, confirmed by two consecutive closes, could pave the way for a rally toward the 25,500 mark.
Meanwhile, Foreign Institutional Investors (FIIs) have cut their long positions to nearly half of April–May levels, reflecting a more cautious stance. Still, their net buying in the previous months, along with upcoming catalysts like the RBI policy announcement on June 6 and the progress of the monsoon, could potentially reignite market momentum.
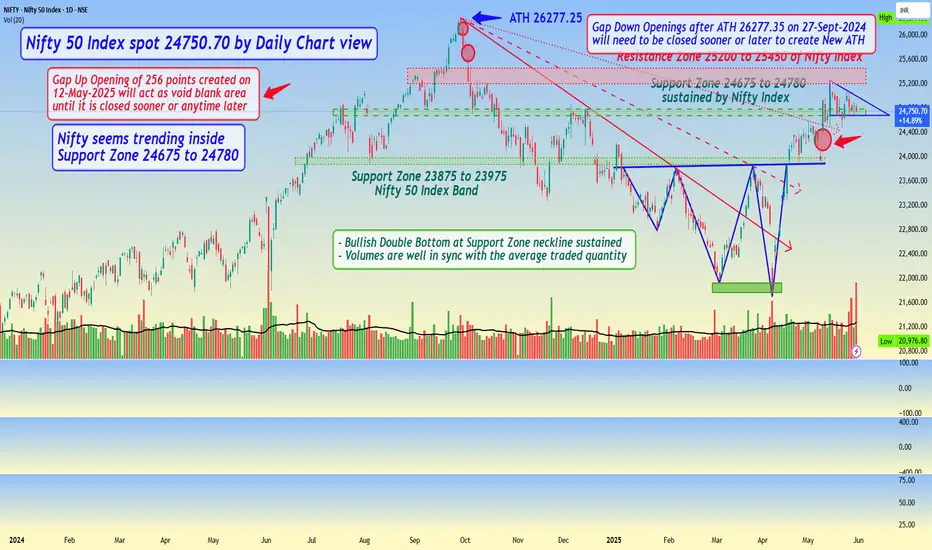
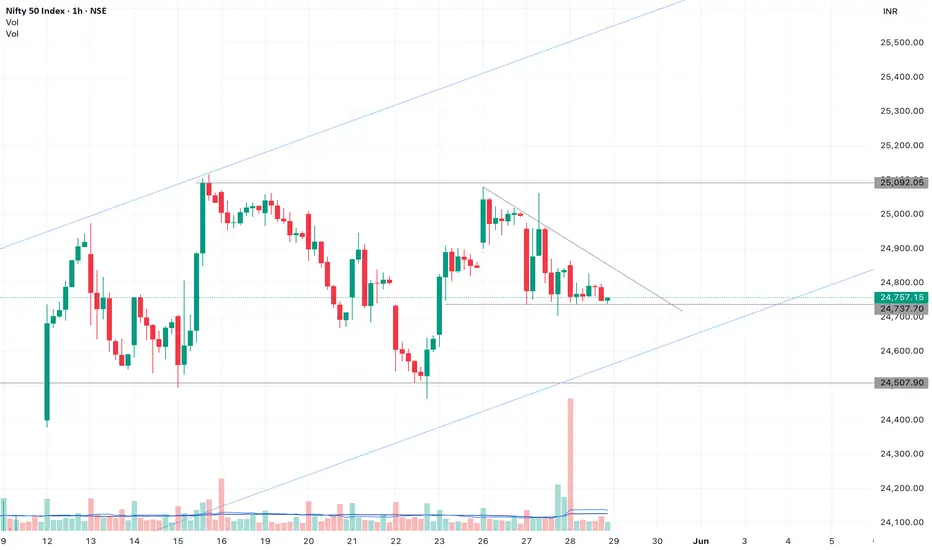
Nifty 50 Index spot 24750.70 by Daily Chart view - Weekly UpdateNifty 50 Index spot 24750.70 by Daily Chart view - Weekly Update
- Resistance Zone 25200 to 25450 of Nifty Index
- Support Zone 24675 to 24780 sustained by Nifty Index
- Nifty seems stuck within Descending Triangle pattern above Support Zone, needs to breakout from it for fresh upside
- Gap Up Opening of 256 points created on 12-May-2025 will act as void blank area until it is closed sooner or anytime later
- Gap Down Openings made after the ATH 26277.35 on 27-Sept-2024 will need to be closed sooner or later to create New ATH
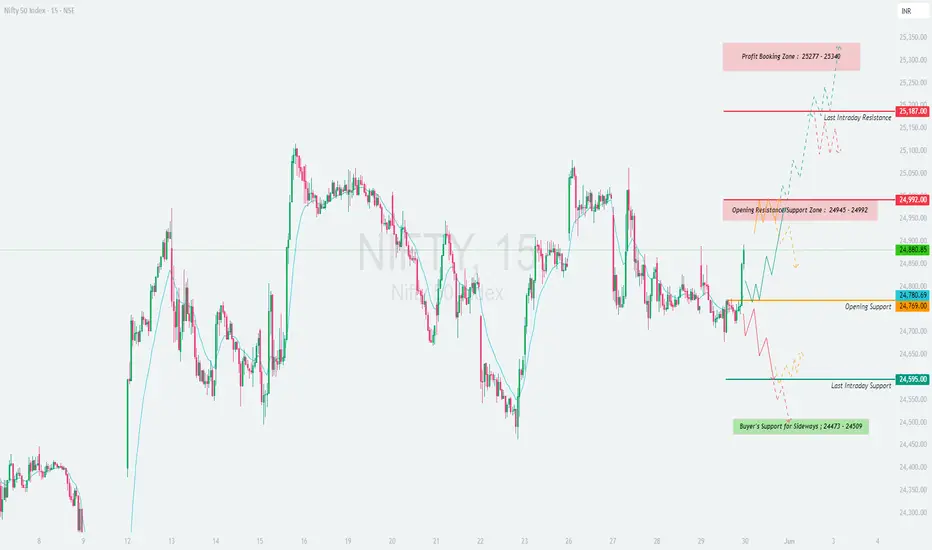
NIFTY : Trading Levels and Plan for 30-May-2025📘 NIFTY – TRADING PLAN for 30-May-2025
🕒 Based on 15-minute Chart Analysis
📍 Gap Opening Threshold: 100+ points from previous close of 24,880.85
🔼 GAP-UP OPENING (Above 24,992+):
If Nifty opens above the Opening Resistance zone (24,945 – 24,992) , it signals potential bullish continuation with strong upward momentum.
✅ Plan of Action:
• Wait for a 15-min candle close above 24,992 for breakout confirmation.
• Once confirmed, long trades may be initiated with upside targets:
→ 25,187 (Last Intraday Resistance)
→ 25,277 – 25,340 (Profit Booking Zone)
• Ideal stop-loss should be just below the breakout candle or beneath the 24,992 zone.
• If Nifty approaches 25,187 too quickly after open, expect minor profit booking or sideways move. Avoid aggressive buying near this resistance without proper structure.
🧠 Educational Insight: A gap-up above resistance is strong only if volume confirms and price sustains. Avoid chasing spikes; instead, wait for retest or consolidation above breakout levels to increase probability of success.
⚖️ FLAT OPENING (Between 24,780 – 24,945):
A flat open in this zone keeps the index in a balanced state with both opportunities and risks. Price action will dictate the day’s trend.
✅ Plan of Action:
• Mark the Opening Support: 24,780
• Mark the Resistance Supply zone: 24,945 – 24,992
• Wait for a range breakout:
→ Above 24,992 → Go long (targets: 25,187 → 25,340)
→ Below 24,780 → Go short (targets: 24,595 → 24,473)
• Do not trade within this zone unless price structure is clear and directional.
• Look for rejection wicks or engulfing patterns near support/resistance for potential scalps.
🧠 Educational Insight: Sideways zones are where traders lose most of their capital. Wait for confirmation before jumping in. A “No Trade” decision is also a trade that protects capital.
🔽 GAP-DOWN OPENING (Below 24,680):
A gap-down of more than 100 points brings Nifty near key supports: 24,595 (Last Intraday Support) and deeper into Buyer’s Support Zone (24,473 – 24,509).
✅ Plan of Action:
• Observe price behavior near 24,595.
• If this level holds, and you spot bullish reversal signs (hammer, bullish engulfing), go long toward:
→ 24,780 (Opening Support)
→ 24,880 (Previous Close)
• If price breaks below 24,473 with strong bearish candle, it opens up shorting possibilities with deeper targets.
• Stop-loss for reversal longs = below 24,473; for breakdown shorts = above 24,595.
• Avoid trading immediately at open; let the first 15–30 min range develop for clearer direction.
🧠 Educational Insight: Demand zones are highly reactive. Let the market show whether buyers are stepping in or fleeing. React, don’t predict.
🛡 RISK MANAGEMENT TIPS FOR OPTIONS TRADERS:
✅ Always use 15-min confirmation candles before taking a directional position.
✅ Don’t buy far OTM options post-gap openings ; use near ATM or spreads to control premium decay.
✅ Define your loss limit for the day and stick to it. One wrong revenge trade can ruin weeks of gains.
✅ Keep position sizing small on volatile or event days — focus on surviving first, thriving later.
✅ Use option spreads like debit spreads to reduce theta exposure during sideways market phases.
📊 SUMMARY & CONCLUSION:
• 🟢 Bullish Scenario: Above 24,992 → Targets: 25,187 / 25,340**
• 🔴 Bearish Scenario: Below 24,595 → Targets: 24,509 / 24,473**
• 🟧 Neutral Zone: 24,780 – 24,945 → Wait for breakout direction
• 🟩 Support Levels: 24,780 / 24,595 / 24,473
• 🟥 Resistance Levels: 24,992 / 25,187 / 25,340
• 🧠 Key Strategy: Avoid emotional trading during volatile opening. Wait, confirm, then act.
✨ Final Word: Trading is a skill of patience and preparation. Let levels guide you, not assumptions. The market rewards precision, not prediction.
📢 DISCLAIMER: I am not a SEBI-registered analyst. This trading plan is intended solely for educational purposes. Please consult your financial advisor before making any trading or investment decisions. Trade wisely. 📉📈
NIFTY : Trading levels and Plan for 29-May-2025📘 NIFTY 50 – TRADING PLAN for 29-May-2025
📈 Based on 15-min structure and key zones
📍 Gap Opening Threshold: 100+ points from previous close of 24,757
🔼 GAP-UP OPENING (Above 24,857):
If Nifty opens above 24,857+, it will open above the current Opening Resistance Zone: 24,748 – 24,786 , creating early bullish momentum.
✅ Plan of Action:
• Let the price settle in the first 15–30 mins. Avoid chasing green candles in the first 5 mins.
• If Nifty sustains above 24,891 (Opening Resistance), bullish momentum is confirmed. You may initiate long trades (Call options or Futures) with targets at 24,997 (Last Intraday Resistance) and trail SL at 24,891 .
• Once price reaches 24,997, partial profit booking is advised, as it’s a strong resistance zone.
• In case of a sharp pullback toward the 24,748–24,786 zone, observe for bullish reversal patterns (hammer, engulfing) before considering re-entry.
• A failure to sustain above 24,891 followed by bearish price action may lead to a trap. Wait for confirmation before going short.
🧠 Educational Tip: A gap-up followed by sideways movement or rejection at resistance often leads to profit-booking. Be cautious if momentum fades quickly.
⚖️ FLAT OPENING (Between 24,748 – 24,786):
This is a tricky Opening Support-Resistance Zone , often referred to as the "No Trading Zone" due to choppy price action.
✅ Plan of Action:
• Stay out initially – wait for either a breakout above 24,786 or a breakdown below 24,748 to take a directional trade.
• A 15-min candle close above 24,786 with volume confirmation can lead to upward momentum targeting 24,891 → 24,997 .
• If Nifty breaks and sustains below 24,748 , consider short trades toward 24,702 → 24,667 .
• Avoid overtrading in this zone; wait for clean structure and direction. Sideways zones are premium killers in options.
🧠 Educational Tip: Price often consolidates near open when inside a resistance-support overlap. Don't anticipate the move — participate only when confirmation arrives.
🔽 GAP-DOWN OPENING (Below 24,657):
If Nifty opens more than 100 points lower (below 24,657), it opens near the Opening Support Zone: 24,667 – 24,702 or possibly close to Last Intraday Support: 24,592 .
✅ Plan of Action:
• Observe early reactions around 24,592 . If this level holds and bullish reversal patterns emerge, you can go long for an intraday bounce toward 24,702+ with a tight SL below 24,592.
• If Nifty breaks 24,592 and sustains below on 15-min candle close, you may initiate Put trades or shorts, targeting 24,391 → 24,326 (Important Buyer’s Support).
• Be cautious near 24,391–24,326 zone — sharp reversals often occur there as it’s a critical demand zone.
• Avoid emotional shorting just because of gap-down; confirm weakness through patterns like breakdown and retest.
🧠 Educational Tip: Many retail traders short gap-downs only to be trapped in V-shape recoveries. Patience and pattern confirmation matter more than the gap itself.
🛡 RISK MANAGEMENT TIPS FOR OPTIONS TRADERS:
📌 Always follow 15-min candle close SLs for directional confirmation.
📌 Use spread strategies like Bull Call/Bear Put spreads on high IV days to limit risk.
📌 Avoid trades inside overlapping zones like 24,748 – 24,786 unless a breakout/breakdown occurs.
📌 Stick to maximum 1–2 trades a day. Avoid overtrading due to boredom or FOMO.
📌 Define your Risk:Reward ≥ 1:2 before entering any trade.
📌 Don’t average losing positions. Respect your stop-loss.
📌 Protect profits using trailing SL once targets start hitting.
📊 SUMMARY & CONCLUSION:
• 🟢 Bullish Above: 24,891 → Targets: 24,997
• 🔴 Bearish Below: 24,592 → Targets: 24,391 / 24,326
• 🟧 Opening Support-Resistance Zone: 24,748 – 24,786
• 🟩 Support Zone: 24,667 – 24,702
• 🟥 Last Intraday Support: 24,592
• 💚 Strong Buyer's Zone: 24,391 – 24,326
✨ Key Rule: Follow the flow — don’t predict it. Let price tell you what it wants to do and then ride the wave.
📢 DISCLAIMER: I am not a SEBI-registered analyst. This plan is shared purely for educational purposes. Please consult a certified financial advisor before making any trading or investment decisions. Trade at your own risk. 💼📉📈

Nifty chart for 29th May 2025Looks like Nifty is forming a triangle pattern.
Disclaimer: All information provided here is for educational purposes and not a recommendation, advice, research report, or stock tip of any nature. Analysis Posted here is just our view/personal study method on the stocks, commodities or other instruments and assets.
NIFTY : Trading levels and Plan for 28-May-2025📘 NIFTY TRADING PLAN – 28 MAY 2025
🕰 Based on 15-min price structure & support/resistance zones
📍 Gap opening considered when price opens 100+ points above or below the previous close (24,837)
🔼 GAP-UP Opening (Above 24,937 – 100+ points):
If Nifty opens above 24,937+ , it enters the zone between Last Intraday Resistance (25,000) and moves toward the Profit Booking Zone (25,285 – 25,347) .
✅ Plan of Action:
• Avoid aggressive entries in the first 15–30 minutes. Let price action settle and confirm sustainability.
• A 15-min candle close above 25,165 with strong volume may signal a breakout toward the Profit Booking Zone at 25,285–25,347 .
• Pullbacks near 25,000–25,165 acting as a new support can offer good CE entries for continuation.
• However, if Nifty shows reversal signs (bearish engulfing or shooting star) near the Profit Booking Zone, traders may consider light PE positions for a possible retracement.
🧠 Educational Insight: Gap-ups into major resistance should never be chased blindly. Let the market confirm whether bulls have the strength to sustain or not.
⚖️ FLAT Opening (Between 24,701 – 24,937):
This zone is where Nifty opens near the Opening Resistance (24,837–24,861) or Opening Support Zone (24,666–24,701) .
✅ Plan of Action:
• Mark this range as the NO TRADE ZONE initially. Wait for a breakout above 24,937 or breakdown below 24,666 before taking directional trades.
• If Nifty sustains above 24,861 with strong green candles, you may initiate CE positions with targets of 25,000 – 25,165 .
• A breakdown below 24,666 with rejection at retest opens PE opportunities toward 24,594 and lower.
• If the market stays sideways between 24,701–24,861 , stay on the sidelines. Avoid theta decay traps in options.
🧠 Educational Insight: In sideways zones, wait for price confirmation instead of anticipation. Let price break levels and retest for high-probability trades.
🔽 GAP-DOWN Opening (Below 24,737 – 100+ points):
In this case, Nifty opens below Opening Support Zone (24,666–24,701) or even the Last Intraday Support (24,594) .
✅ Plan of Action:
• If price finds support near 24,594 and shows bullish reversal signs (hammer, bullish engulfing), a bounce toward 24,701+ is possible.
• Breakdown and a 15-min close below 24,594 will likely take Nifty toward the Buyer’s Important Support Zone (24,326 – 24,391) .
• Use PE options if 24,594 breaks decisively and price fails to reclaim it on a retest.
• For aggressive traders, any retest of 24,666–24,701 acting as resistance can provide a PE entry with tight SL.
🧠 Educational Insight: Gap-downs into support zones often trap sellers if support holds. Watch for exhaustion or follow-through before deciding direction.
🛡 RISK MANAGEMENT TIPS FOR OPTIONS TRADERS:
📌 Use 15-min candle close SL to avoid emotional exits.
📌 Avoid overtrading. Stick to 1–2 high-quality trades only.
📌 Avoid buying options right after the open – let premiums stabilize.
📌 Always calculate Risk:Reward Ratio before placing a trade.
📌 Don’t trade inside the noise zone (24,701–24,861); wait for levels to be breached.
📌 Use spreads (Bull Call / Bear Put) if volatility is high.
📊 SUMMARY & CONCLUSION:
• 🔼 Bullish Breakout Zone: Above 25,165 → Target: 25,285 / 25,347
• 🔽 Bearish Breakdown Zone: Below 24,594 → Target: 24,391 / 24,326
• 🟧 No Trade Zone: 24,701 – 24,861
• 🟩 Opening Support Zone: 24,666 – 24,701
• 🟥 Profit Booking Resistance Zone: 25,285 – 25,347
📌 Wait for price structure to confirm direction. Use patience and discipline – not emotions. Great setups reward prepared traders.
📢 DISCLAIMER: I am not a SEBI-registered analyst. This trading plan is purely for educational purposes. Please consult your financial advisor before taking any investment decisions. Trade wisely and protect your capital. 💼📈📉

Nifty analysis for 28th May 2025Looks like Nifty is forming an inverse head and shoulders pattern.
Disclaimer: All information provided here is for educational purposes and not a recommendation, advice, research report, or stock tip of any nature. Analysis Posted here is just our view/personal study method on the stocks, commodities or other instruments and assets.
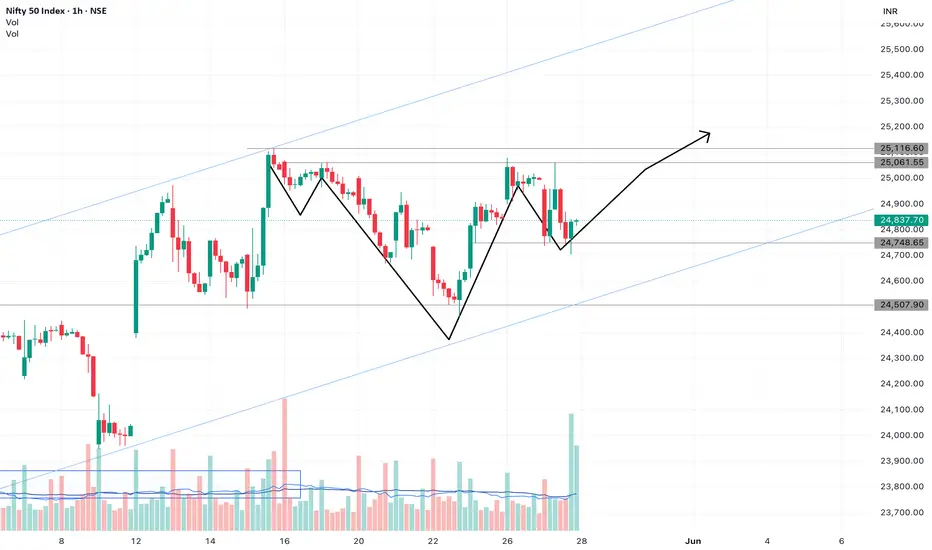
Nifty go long once break above 25100Green line show the target and red line show trend to be reversed in pe side
Now it's a time for strangle and straddle play
Green line is driven after consideration of breakout which might happen cup and handle formation
Derived from the cup size
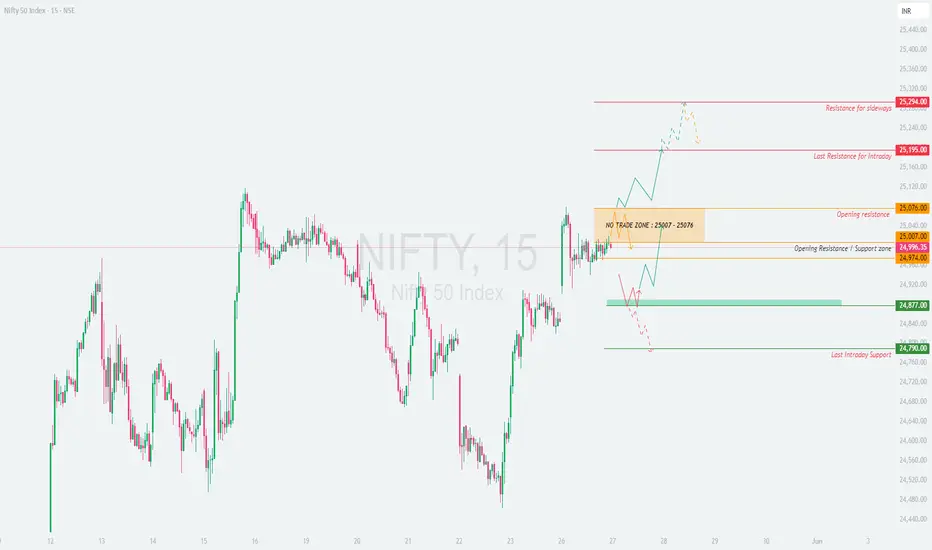
NIFTY : Trading levels and Plan for 27-May-2025📈 Nifty 50 Trading Plan – 27 May 2025
🔍 Chart Structure Analysis with Strategic Plan of Action
GAP-UP Opening (Above 25,076 – 100+ points):
If Nifty opens with a strong gap-up above 25,076 , we are stepping into the Opening Resistance zone , heading towards the Last Intraday Resistance at 25,195 and even towards 25,294 – Resistance for sideways price action .
✅ Plan of Action:
• Avoid early entries in the first 15-30 mins to let volatility settle.
• If price sustains above 25,195 on a 15-min candle close, potential momentum may push it to 25,294+ .
• Option buyers may consider buying CEs with tight SL below 25,076 on a retest for a favorable risk-reward.
• If price shows rejection from 25,195–25,294, watch for reversal patterns to scalp PEs with SL above 25,294 .
🧠 Education Tip: Gaps often trap retailers. Confirmation is key! Avoid aggressive trades at resistance without a proper base.
FLAT Opening (Between 25,007 – 25,076):
A flat start means price is within the NO TRADE ZONE (25,007–25,076). This zone offers low conviction as both bulls and bears wait for direction.
✅ Plan of Action:
• Wait and watch. Don’t force trades here.
• Trade only on clean breakout above 25,076 or breakdown below 25,007 with good volume .
• Avoid options buying here, theta decay will kill premiums.
• Look for directional breakouts post 10:00 AM for clarity.
🧠 Education Tip: No Trade Zone exists to protect your capital. Preserve energy for high-probability setups.
GAP-DOWN Opening (Below 24,877 – 100+ points):
A strong gap-down below 24,877 would take price into a decisive Buyer's Support Zone (24,877 – 24,791) or even to last intraday support at 24,790 .
✅ Plan of Action:
• If price holds above 24,790 – 24,877 zone , intraday pullback likely. Watch for reversal signals to scalp CEs with tight SL below 24,790 .
• Breakdown below 24,790 with volume may trigger further downside. Can aim for lower supports.
• Avoid chasing puts after a gap down—wait for a retest or consolidation before entry.
🧠 Education Tip: Buyer zones often act as magnets for smart money entries. Respect structure before shorting blindly.
💡 Options Trading Risk Management Tips:
• Use stop losses on candle-close basis and avoid mental SLs.
• Never buy options when premiums are inflated post-gap moves without confirmation.
• Use spreads (e.g., Bull Call or Bear Put spreads) on volatile days to reduce premium decay.
• Avoid over-leveraging—stick to 1–2 trades with proper planning.
• Hedge if you’re carrying positions overnight.
📊 Summary & Conclusion:
• 🔸 No Trade Zone: 25,007 – 25,076 (Avoid initiating fresh trades here).
• 🔼 Bullish breakout levels: Above 25,076 → Target 25,195 / 25,294
• 🔽 Bearish breakdown levels: Below 24,790 → Possible downside pressure.
• 💚 Buyer's Zone Support: 24,877 – 24,791
🔔 Remember: The market does not reward speed but precision and patience. Focus on execution based on structure and not emotions.
📌 Disclaimer: I am not a SEBI-registered analyst. The information provided is for educational purposes only. Please do your own analysis or consult your financial advisor before taking any trade. Trade safe and smart! 💼📉📈
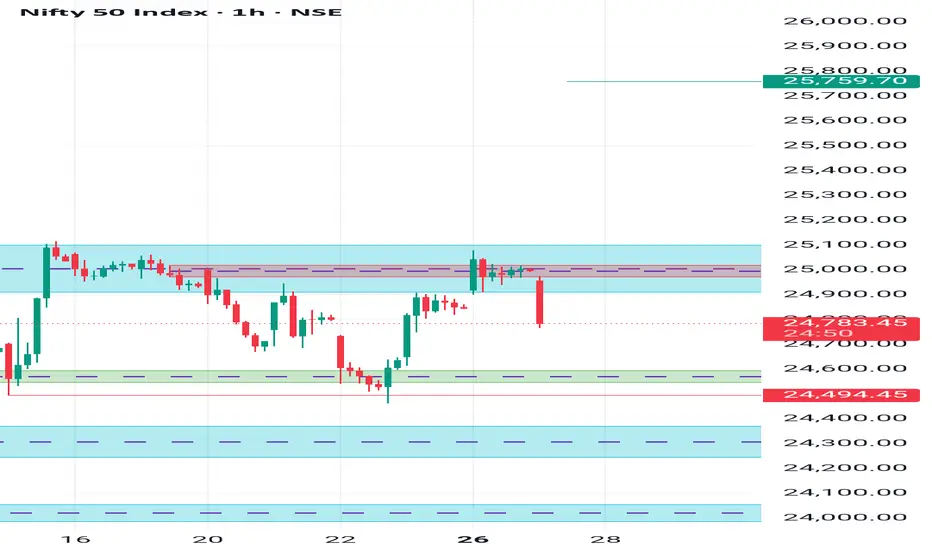
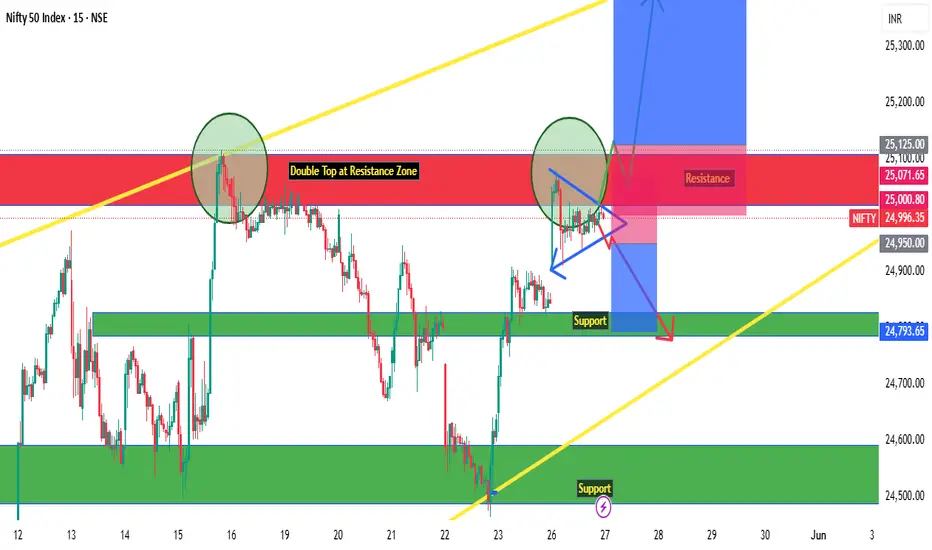
Nifty Intraday Level for 27-May-25Nifty closed at resistance level and formed Double Top Reversal Pattern may seen downside if resistance not broken else above resistance seen upsideknifty
Bearish < 24950
Bullish > 25125
Wait for Proper Rejection/Pattern :
@Support : Bullish
@Resistance : Bearish
Use Sl Trailing to reduce Risk
*All views for educational purpose only
Nifty analysis for 26th May 2025Looks like Nifty has formed an inverse head and shoulders pattern and it already broke the pattern moving upside.
Disclaimer: All information provided here is for educational purposes and not a recommendation, advice, research report, or stock tip of any nature. Analysis Posted here is just our view/personal study method on the stocks, commodities or other instruments and assets.

NIFTY50 Correction Mode over? Next move: 25200/26000 or 22500??1. On a daily time frame, Nifty50 formed a Head and Shoulders(H&S) pattern which is a bearish reversal pattern suggesting a potential downward trend. NIFTY broke the neckline and completed the H&S downside fall.
2. Now NIFTY is at a 0.618(22,435) Fibonacci Retracement level and is currently being tested as support. Next Fibonacci level on the downside is is at 22557.
3. A long-term trend ascending trendline may also act a dynamic support below 0.618 level. Overall NIFTY has a strong support zone from 22200-400.
4. With RSI at over sold levels, NIFTY may not retest 0.5 Fibonacci level and a good bounce can be seen from 22300-450 levels.
5. On the upside, strong resistance can be seen at 24100-150 levels.
