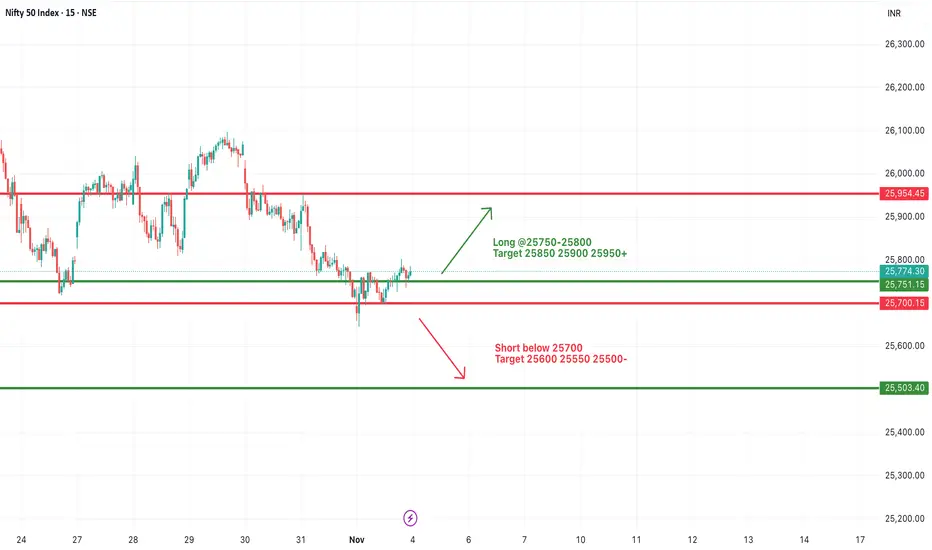
#NIFTY Intraday Support and Resistance Levels - 04/11/2025Nifty is expected to open flat near the 25,750–25,780 zone, indicating a neutral start as the market looks for fresh cues after a consolidation phase. The index is currently holding near key support, suggesting that both buyers and sellers are waiting for a breakout from this range to take control.
If Nifty sustains above 25,800, it may trigger a short-covering rally toward 25,850, 25,900, and 25,950+ levels. A move beyond 25,950 could further strengthen momentum toward 26,000–26,050.
On the downside, immediate support lies near 25,700–25,650. A breakdown below 25,700 could lead to weakness toward 25,600, 25,550, and 25,500, where the next major support zone lies.
Overall, with a flat opening, Nifty is likely to remain range-bound between 25,700–25,900 in the early session. Traders should wait for a clear breakout or breakdown before initiating fresh positions and use strict stop losses in this narrow consolidation phase.
Niftyoutlook
NIFTY : Trading levels and Plan for 04-Nov-2025🔹 NIFTY Trading Plan for 04-Nov-2025
(Based on psychological correction behavior and intraday structure)
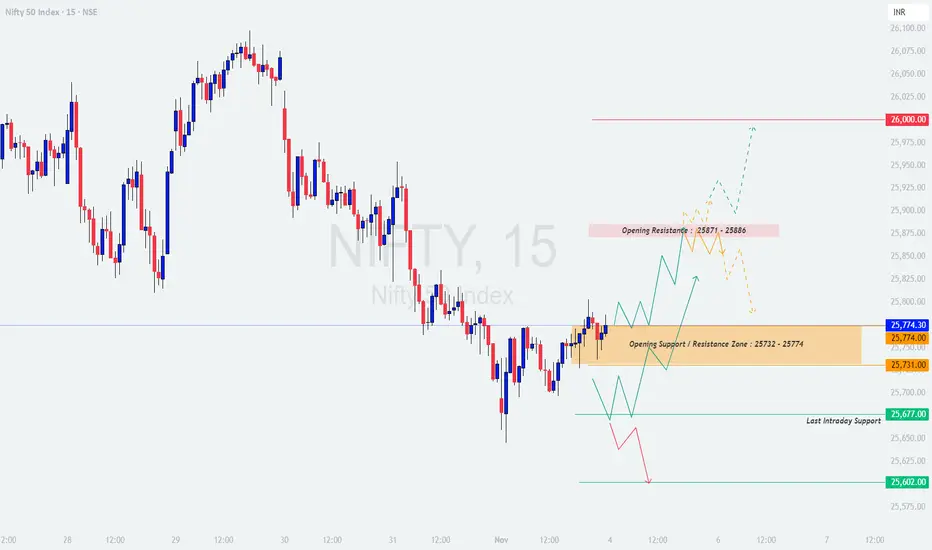
Chart Reference Levels:
🟧 Opening Support / Resistance Zone: 25,732 – 25,774
🟥 Opening Resistance: 25,871 – 25,886
🟩 Last Intraday Support: 25,677
🩵 Extended Support Zone: 25,602
❤️ Upside Psychological Target: 26,000
🟢 Scenario 1: Gap-Up Opening (100+ points above previous close)
If Nifty opens above 25,860, it enters near the Opening Resistance zone (25,871 – 25,886). Monitor how price behaves here — early candles showing rejection or long upper wicks could signal exhaustion and a potential pullback.
Only if Nifty sustains above 25,886 with strong momentum and closes a 15-minute candle above it, bulls could take control for a move towards the psychological mark of 26,000.
In case of a false breakout, prices could retrace back to the 25,774 zone, which may act as re-entry support for dip buyers.
📘 Educational Note: Gap-up days tend to trap retail traders who buy impulsively at the open. Always let the market prove its strength with a confirmed candle close before entering directional trades.
🟠 Scenario 2: Flat Opening (±50 points from previous close around 25,730)
Flat openings near 25,732 – 25,774 indicate equilibrium between bulls and bears. The first half-hour will decide whether this zone acts as support or resistance.
If Nifty sustains above 25,774, it can climb towards 25,871, where sellers might emerge again. Watch for a decisive breakout or rejection at that level.
A breakdown below 25,732 would expose the index to 25,677 (Last Intraday Support). Sustained weakness below that level could extend toward 25,602.
📘 Educational Note: Flat openings allow clear structure formation — ideal for observing whether large players are accumulating or distributing. Avoid rushing; let trend direction confirm itself.
🔴 Scenario 3: Gap-Down Opening (100+ points below previous close)
A gap-down below 25,650 brings price action directly near Last Intraday Support (25,677) or the Extended Support Zone (25,602). Watch closely for reversal candles or volume divergence in this region.
If Nifty fails to reclaim 25,677, it could extend weakness further, making 25,602 the next critical level where buyers may attempt to defend.
A recovery back above 25,732 after testing these supports may indicate a short-covering opportunity for intraday traders.
📘 Educational Note: Gap-downs are emotional openings. Avoid panic selling; instead, analyze whether the drop is driven by emotion or genuine momentum. Patience during the first 15–30 minutes often saves capital and improves entries.
💡 Tips for Risk Management in Options Trading
Never risk more than 1–2% of total trading capital per position.
Use hourly candle close-based stop-losses to minimize whipsaws in volatile moves.
Avoid chasing far OTM options post 11:00 AM — theta decay accelerates quickly.
If implied volatility (IV) is high, prefer spreads (Bull Call / Bear Put) over naked options.
Always pre-define your exit plan — entry is optional, exit is mandatory.
📊 Summary & Conclusion:
Above 25,886 → Bulls likely to extend toward 26,000.
Between 25,732 – 25,774 → Neutral consolidation zone; trade cautiously.
Below 25,677 → Bearish bias may continue toward 25,602.
In essence, 04-Nov-2025 could be a decision-making day for Nifty — either to confirm strength above the resistance band or to retest lower supports. Let the first 30 minutes establish the tone, then trade with discipline and risk control.
⚠️ Disclaimer:
I am not a SEBI-registered analyst . This analysis is shared purely for educational and informational purposes. Traders should conduct their own technical and psychological assessment or consult with a certified financial advisor before executing any trade.
NIFTY : Trading levels and Plan for 03-Nov-2025🔹 NIFTY Trading Plan for 03-Nov-2025
(Based on psychological correction zones and technical confluences)
Chart Reference Levels:
🟩 Opening & Important Support: 25,644 – 25,682
🟧 Opening Resistance: 25,773
🟥 Last Intraday Resistance: 25,905
🩶 Last Intraday Support: 25,614
🩵 Extended Support Zone: 25,459
🟢 Scenario 1: Gap-Up Opening (100+ points above previous close)
If Nifty opens above 25,830 – 25,860, monitor how prices react near 25,905 (Last Intraday Resistance). A sustained move above this level with good momentum can trigger an upward extension towards 26,015.
However, if rejection appears near 25,905, expect a possible intraday correction back toward 25,773 (Opening Resistance), which could now act as support.
For option traders: Look for quick scalps on CE side only after confirmation (e.g., 15-min candle closes above 25,905). Avoid chasing if volatility spikes immediately after opening.
📘 Educational Note: Gap-ups often trap late buyers, so patience during the first 15–30 minutes can help identify genuine breakouts versus false moves.
🟠 Scenario 2: Flat Opening (±50 points from previous close around 25,730)
In this case, early trade will revolve around the Opening and Important Support zone (25,644–25,682). A bounce from this region could create a base for testing 25,773 and possibly 25,905 if momentum builds.
On the other hand, a clear break and sustained move below 25,644 may attract selling pressure, pushing prices toward 25,614 and later 25,459.
Intraday traders can focus on range-bound strategies initially, buying near support and selling near resistance, until a decisive breakout occurs.
📘 Educational Note: Flat openings provide balanced opportunities — observe where institutional participation appears before committing. Price confirmation > prediction.
🔴 Scenario 3: Gap-Down Opening (100+ points below previous close)
A gap-down below 25,650 immediately places Nifty near or inside the support pocket (25,644–25,682). Watch for signs of reversal (hammer-type candles or volume spikes).
If Nifty fails to hold above 25,614, bears could dominate, targeting 25,459 as the next logical intraday support.
However, if Nifty stabilizes and closes back above 25,682, it could turn into a short-covering day with recovery potential up to 25,773.
📘 Educational Note: Gap-downs usually trigger emotional trades. Stay calm — wait for structure confirmation instead of reacting impulsively to open volatility.
💡 Tips for Risk Management in Options Trading
Always define your risk per trade — never risk more than 1–2% of your total capital on a single position.
Use stop-loss based on hourly candle close rather than fixed points for better accuracy in volatile sessions.
Avoid averaging in loss-making trades; instead, re-enter only on confirmation of trend reversal.
Focus on delta-neutral spreads (like Bull Call / Bear Put) on volatile days to manage premium decay effectively.
Remember: preserving capital is more important than chasing every move. The market will always provide new opportunities.
📊 Summary & Conclusion:
Above 25,905 → Bulls regain control, eyeing 26,015 as the next target.
Between 25,682–25,773 → Neutral zone, ideal for short-term reversals.
Below 25,614 → Bears dominate, with possible slide towards 25,459.
In essence, the session for 03-Nov-2025 may open with uncertainty near key support zones, so disciplined observation and reaction-based trading will be the key to consistent results.
⚠️ Disclaimer:
I am not a SEBI-registered analyst . This analysis is shared purely for educational and informational purposes. Traders are advised to conduct their own research or consult a certified financial advisor before taking any investment or trading decisions.

31 Oct 2025 - Finally, we are short-selling Nifty + PostMortemNifty Stance Bearish 🐻
In last week's postmortem report, we said the Diwali rally would be coming to an end. I guess I said that too early, as I was hoping for a reversal on Monday or Tuesday, but the reversal came only on Friday.
Our last long signal was on the 3rd of October and a short-reversal came only on the 31st, which again shows how Nifty spent an entire month in bullish mode. The profits gained in this period is a whopping 985 points ~ 3.97%.
We have now formed a decent double top at the 26086 level and a faint double bottom on an upward-sloping trendline. As we all know, only one of them will actually work, and the double top is here to stay.
The upcoming support levels are 25681, 25219 and 25003. If we break the 25681 on Monday, the next 400 pts fall could come quite easily as more shorts could enter the system.
Meanwhile, the new rules on Nifty bank look really promising as the weightage of each component should not exceed 20% and a total of 14 banks have to be present in the index. The downside to this rule is that HDFC and ICICI banks, which have a weightage above 20% currently, may have to face outflows to reduce the weightage, or their weightage may have to be controlled via a formula.

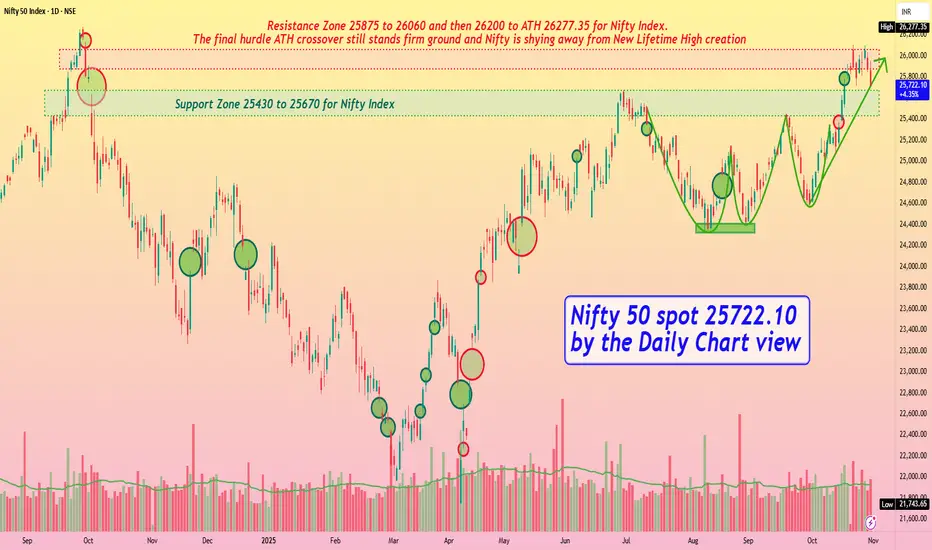
Nifty 50 spot 25722.10 by the Daily Chart view - Weekly UpdateNifty 50 spot 25722.10 by the Daily Chart view - Weekly Update
- Support Zone 25430 to 25670 for Nifty Index
- Rising Support Trendline seems in active mode but may be broken
- Nifty below Resistance Zone but taking rest tad above the Support Zone
- Resistance Zone 25875 to 26060 and then 26200 to ATH 26277.35 for Nifty Index
- Bullish Rounding Bottoms seems active but continued skepticism keeping the Nifty index weak
- The final hurdle ATH crossover still stands ground and Nifty shying away from New Lifetime High creation
Understanding Grindwell Norton’s Long-Term Technical StructureGrindwell Norton’s long-term technical setup offers a valuable learning opportunity in trendline analysis and RSI behavior—ideal for learners exploring price action and momentum indicators.
Understanding Grindwell Norton’s Long-Term Technical Structure
Grindwell Norton Limited (NSE: GRINDWELL), currently trading around ₹1,705, presents a compelling case study in long-term technical analysis. Since 2009, the stock has respected a rising trendline formed by connecting higher lows on the monthly chart. This trendline has acted as a reliable support level, with price rebounding each time it approached this line.
🔍 What Is a Trendline?
A trendline is a straight line that connects two or more price points and extends into the future to act as a line of support or resistance. In Grindwell Norton’s case:
The trendline connects higher lows since 2009, indicating a long-term uptrend.
Each time the price nears this line, it tends to reverse upward, showing the line’s strength as a support level.
This behavior reflects market participants’ confidence in the stock’s long-term trajectory.
Up Trend Line is valid until price trades above it.
📊 RSI: A Momentum Indicator Worth Studying
The Relative Strength Index (RSI) is a momentum oscillator that measures the speed and change of price movements. It ranges from 0 to 100 and is typically used to identify overbought or oversold conditions.
RSI Behavior in Grindwell Norton:
Historically, the RSI has found support slightly below the 50 level whenever the price approached the long-term trendline.
This suggests a bullish momentum reset rather than a breakdown, reinforcing the trendline’s validity.
RSI below 50 but bouncing back indicates accumulation and potential reversal zones.
🧠 Learner’s Takeaways
Here are key concepts and insights for learners studying technical analysis:
Trendline Construction: Learn to draw trendlines by connecting significant swing lows or highs. Consistency across timeframes (like monthly charts) adds strength to the analysis.
RSI Interpretation: Understand that RSI near or slightly below 50 is not necessarily bearish. In long-term uptrends, it often acts as a momentum support zone.
Confluence Matters: When price action (trendline support) aligns with indicator behavior (RSI support), it increases the probability of a reversal.
Historical Context: Studying long-term charts helps identify patterns that short-term charts may miss. Grindwell Norton’s 16-year trendline is a textbook example.
Practice with Real Charts: Use platforms like TradingView to explore how these indicators behave in real time
Live chart Example

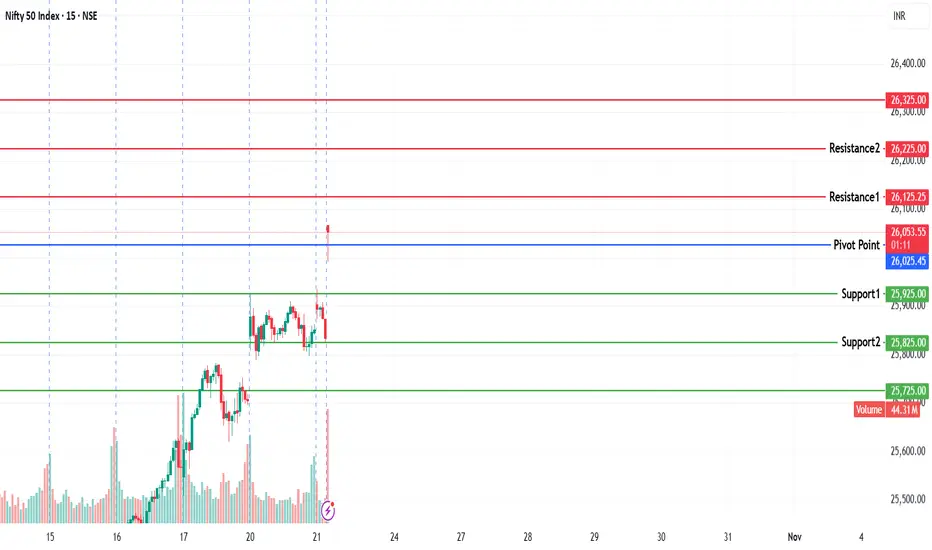
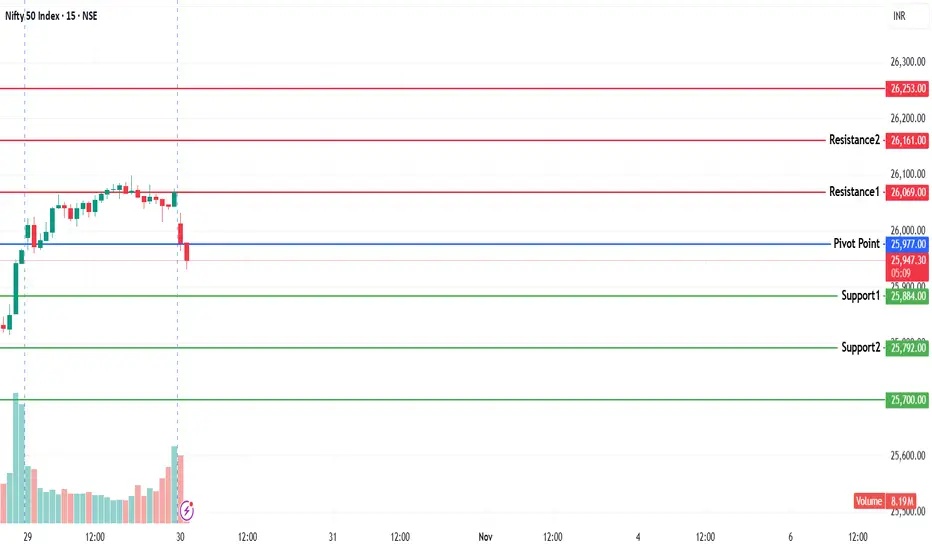
NIFTY KEY LEVELS FOR 31.10.2025NIFTY KEY LEVELS FOR 31.10.2025
Timeframe: 3 Minutes
If the candle stays above the pivot point, it is considered a bullish bias; if it remains below, it indicates a bearish bias. Price may reverse near Resistance 1 or Support 1. If it moves further, the next potential reversal zone is near Resistance 2 or Support 2. If these levels are also broken, we can expect the trend.
When a support or resistance level is broken, it often reverses its role; a broken resistance becomes the new support, and a broken support becomes the new resistance.
If the range(R2-S2) is narrow, the market may become volatile or trend strongly. If the range is wide, the market is more likely to remain sideways
please like and share my idea if you find it helpful
📢 Disclaimer
I am not a SEBI-registered financial adviser.
The information, views, and ideas shared here are purely for educational and informational purposes only. They are not intended as investment advice or a recommendation to buy, sell, or hold any financial instruments.
Please consult with your SEBI-registered financial advisor before making any trading or investment decisions.
Trading and investing in the stock market involves risk, and you should do your own research and analysis. You are solely responsible for any decisions made based on this research.

NIFTY : Trading levels and Plan for 31-Oct-2025📊 Prepared by LiveTradingBox | Based on 15-min structure and key intraday levels
🔍 Key Reference Levels:
🟥 Profit Booking Zone: 26,218 – 26,256
🟥 Last Intraday Resistance: 26,020
🟧 Opening Resistance / Support: 25,911
🟩 Opening and Last Support Zone: 25,731 – 25,793
🟢 Major Support Extension: 25,643
🟢 1. Gap-Up Opening (Above 26,020 – 100+ points)
If Nifty opens above 26,020, it signals strong momentum continuation, possibly fueled by short-covering or positive global cues. The first resistance to watch is 26,218 – 26,256, which is the defined profit booking zone.
Plan of Action:
Allow the first 15–20 minutes for prices to stabilize — avoid jumping into trades immediately.
If the index sustains above 26,020, consider entering a long position with a target of 26,218–26,256.
Use a stop loss below 25,911 (opening support zone) to manage risk.
Book partial profits near 26,218 and trail stop-loss to cost to protect gains.
If rejection occurs near 26,218–26,256, wait for confirmation candles; this zone may trigger intraday pullbacks.
📘 Educational Insight:
A sustained gap-up above resistance often traps late sellers. Smart traders wait for a retest near the breakout zone (26,020) to enter with better risk–reward potential rather than chasing the first green candle.
🟦 2. Flat Opening (Around 25,891 ±50 points)
A flat start near the opening level (25,891) indicates indecision between bulls and bears. Directional clarity will emerge after either a breakout above 25,911–26,020 or a breakdown below 25,793.
Plan of Action:
Observe initial 15–30 minutes of price formation — volatility could be misleading.
If price sustains above 25,911, expect a move toward 26,020, and if momentum continues, toward 26,218–26,256.
Breakdown below 25,793 can invite selling pressure targeting 25,731 – 25,643.
Avoid trading inside the narrow 25,891–25,911 range; such zones often cause whipsaws.
Wait for a confirmed candle close beyond these boundaries to enter with clarity.
📘 Educational Insight:
Flat openings are “setup builders.” Patience is key — professionals let price confirm strength or weakness before reacting. Avoid predicting; instead, follow the flow post-confirmation.
🔻 3. Gap-Down Opening (Below 25,731 – 100+ points)
If Nifty opens below 25,731, it signals weakness or global negative cues. The next logical test is 25,643, a strong support level that may attract buyers for short-covering rallies.
Plan of Action:
Watch early price reaction near 25,643. A strong rebound candle here can offer a low-risk long entry aiming for 25,793–25,911.
If the index fails to hold 25,643, avoid longs — it could extend weakness toward 25,550–25,500 (psychological round level).
For short trades, enter only after confirmation of sustained weakness below 25,643.
Keep stop loss above 25,731 to manage risk effectively.
Avoid averaging losing trades — respect stop losses to prevent capital erosion.
📘 Educational Insight:
Gap-downs can cause emotional reactions. Instead of panic selling, focus on how the market behaves at defined support levels — reaction matters more than prediction.
🧠 Risk Management Tips for Options Traders:
Always use a stop loss. A small loss is a business expense — not a failure.
Don’t enter trades impulsively in the first 15 minutes; let volatility settle.
Stick to ATM or slightly ITM options to balance premium decay and delta sensitivity.
Avoid overtrading — 1 or 2 good trades a day are enough.
Risk only 2–3% of your trading capital on a single setup.
Trail profits using structure-based levels instead of fixed points.
📈 Summary & Conclusion:
Above 26,020, momentum remains bullish with targets near 26,218–26,256.
Between 25,911–25,793, expect a consolidation zone — stay patient and trade confirmed breakouts only.
Below 25,731, weakness may extend toward 25,643 or even 25,550 if pressure sustains.
Follow disciplined risk management; reacting to price structure is always safer than predicting direction.
⚠️ Disclaimer:
I am not a SEBI-registered analyst . The above analysis is purely for educational and informational purposes only . Traders are advised to perform their own research or consult a financial advisor before making any investment or trading decisions.

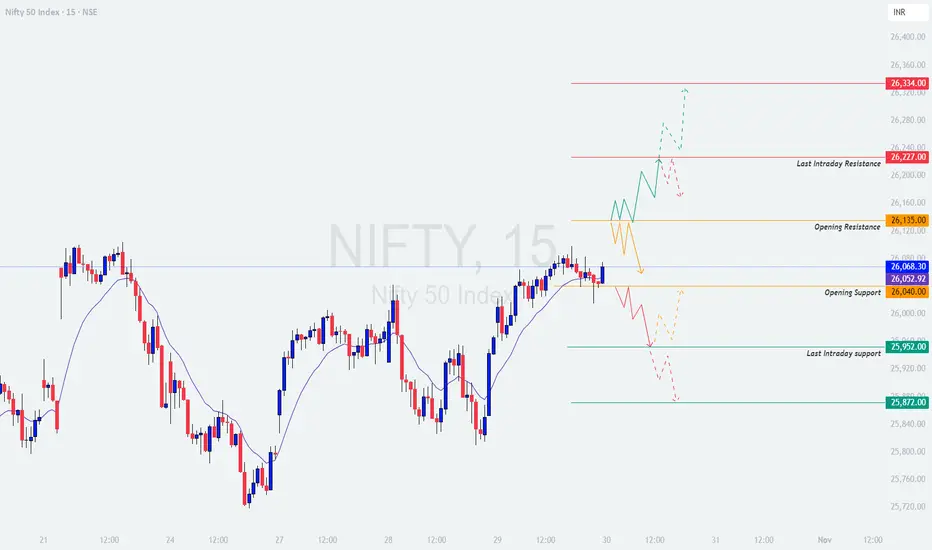
NIFTY : Trading levels and Plan for 30-Oct-2025NIFTY TRADING PLAN – 30-Oct-2025
📊 Prepared by LiveTradingBox | Based on 15-min chart structure & key intraday reference zones
🔍 Key Levels to Watch:
🟥 Last Intraday Resistance: 26,227
🟥 Next Resistance Extension: 26,334
🟧 Opening Resistance: 26,135
🟦 Opening Support: 26,040
🟩 Last Intraday Support: 25,952
🟢 Major Support Zone: 25,872
🟢 1. Gap-Up Opening (Above 26,135 – 100+ points)
If Nifty opens with a Gap-Up above 26,135 , it enters the higher resistance zone. The immediate focus will shift to whether it can sustain above this level. Sustained price action above 26,135 may trigger momentum buying toward 26,227 and possibly 26,334 if strength continues.
Plan of Action:
Wait for the first 15-minute candle to close. Avoid chasing the initial spike.
If price sustains above 26,135, consider entering long positions targeting 26,227–26,334 zone.
Keep a strict stop loss below 26,040 on a closing basis.
If rejection occurs near 26,227, book profits partially and trail your stop to cost.
If Nifty fails to sustain above 26,135 and slips below 26,040, avoid longs and prepare for a pullback toward 25,952.
📘 Educational Insight:
A strong gap-up requires confirmation. Many traders jump in early, but waiting for price to hold above the opening resistance helps avoid fake breakouts.
🟦 2. Flat Opening (Around 26,040 ±50 points)
A flat start near 26,040 suggests balanced sentiment between buyers and sellers. Directional clarity will emerge once either the resistance or support levels are broken.
Plan of Action:
Allow the first 30 minutes for market stabilization.
A sustained move above 26,135 with volume indicates strength — target 26,227 with a stop loss below 26,040.
If Nifty stays range-bound between 26,135–26,040, expect sideways movement — best avoided for options trading.
Breakdown below 26,040 will open short opportunities targeting 25,952–25,872 zones.
For option buyers, avoid overtrading in sideways phases to reduce premium decay.
📘 Educational Insight:
Flat openings are often “wait-and-watch” setups. Avoid predicting direction; instead, react once key levels confirm strength or weakness.
🔻 3. Gap-Down Opening (Below 25,952 – 100+ points)
If Nifty opens below 25,952, it reflects weak sentiment and profit booking pressure. The index will test demand near 25,872, which serves as the final intraday support zone.
Plan of Action:
Monitor price reaction near 25,872 — if it holds and rebounds, expect a short-covering rally toward 26,040.
If Nifty remains below 25,952 without recovery, maintain a bearish stance with a target of 25,820 (psychological level).
Place a stop loss above 26,040 on an hourly close.
Avoid bottom fishing; wait for confirmation candles before considering reversals.
📘 Educational Insight:
Gap-down setups usually trigger panic trades. Professionals wait for stabilization before entering, while retail traders often get trapped during early volatility.
🧠 Risk Management Tips for Options Traders:
Always define your risk — use stop-loss orders and don’t hold losing trades beyond your comfort zone.
Avoid trading both sides of the market; pick one directional bias.
Stick to ATM or slightly ITM options to manage time decay efficiently.
Avoid aggressive trades during the first 15–30 minutes after the market opens.
Maintain proper position sizing — never risk more than 2–3% of your trading capital in a single trade.
📈 Summary & Conclusion:
Above 26,135, the bias remains bullish — expect an extension toward 26,227–26,334.
Between 26,040–26,135, expect choppy consolidation — best to wait for breakout confirmation.
Below 25,952, weakness may extend toward 25,872 or lower if support fails.
Stick to a disciplined approach — react to price, don’t predict it.
⚠️ Disclaimer:
I am not a SEBI-registered analyst . The above analysis is purely for educational and informational purposes. Traders should do their own analysis or consult a financial advisor before taking any positions.
NIFTY KEY LEVELS FOR 30.10.2025NIFTY KEY LEVELS FOR 30.10.2025
Timeframe: 3 Minutes
If the candle stays above the pivot point, it is considered a bullish bias; if it remains below, it indicates a bearish bias. Price may reverse near Resistance 1 or Support 1. If it moves further, the next potential reversal zone is near Resistance 2 or Support 2. If these levels are also broken, we can expect the trend.
When a support or resistance level is broken, it often reverses its role; a broken resistance becomes the new support, and a broken support becomes the new resistance.
If the range(R2-S2) is narrow, the market may become volatile or trend strongly. If the range is wide, the market is more likely to remain sideways
please like and share my idea if you find it helpful
📢 Disclaimer
I am not a SEBI-registered financial adviser.
The information, views, and ideas shared here are purely for educational and informational purposes only. They are not intended as investment advice or a recommendation to buy, sell, or hold any financial instruments.
Please consult with your SEBI-registered financial advisor before making any trading or investment decisions.
Trading and investing in the stock market involves risk, and you should do your own research and analysis. You are solely responsible for any decisions made based on this research.
Update idea
NIFTY Intraday Trade Setup For 30 Oct 2025NIFTY Intraday Trade Setup For 30 Oct 2025
Bullish-Above 26110
Invalid-Below 26060
T- 26350
Bearish-Below 25920
Invalid-Above 25970
T- 25690
NIFTY has closed on a bullish note with 0.45% gain today. Index has been consolidating below 26100 since few days. Above 26110 index is all set for a fresh ATH. On a 15 Min candle close above 26110, plan a long for the target of 26345. 25900 zone can be a confluence zone. Plan a short below 25920 on 15 Min candle close, 25690 will be target.
In case of a big gap up/down, wait till 10 o'clock and mark the high and low of the trading range (5MIN). Trade on this range breakout.
==========
I am Not SEBI Registered
This is my personal analysis for my personal trading. Kindly consult your financial advisor before taking any actions based on this.

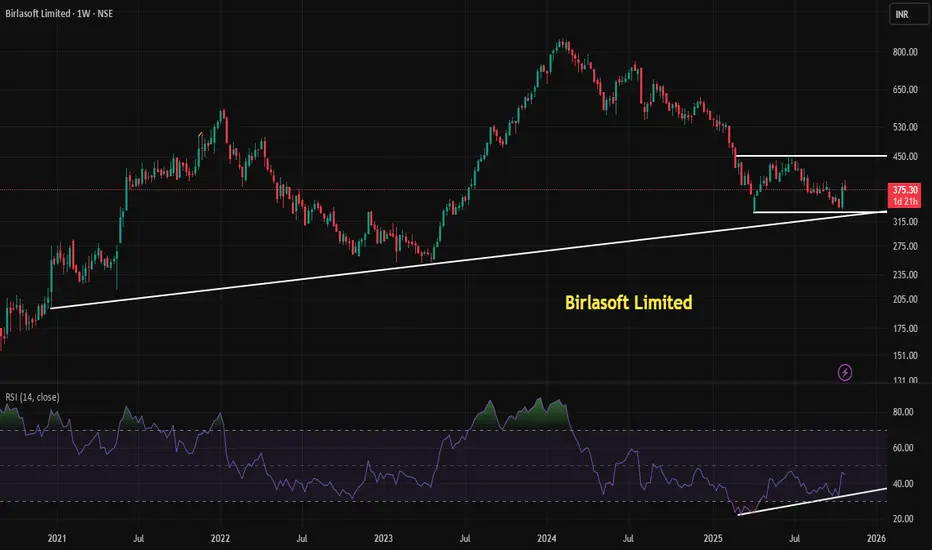
BIRLASOFT LIMITED is showing a bullish Technical setupBirlasoft Ltd. is showing a bullish technical setup with a double bottom pattern and RSI positive divergence on the weekly chart, suggesting a potential trend reversal from recent lows.
Understanding the Setup: Double Bottom + RSI Divergence
Birlasoft Ltd, currently trading around ₹376.60, has recently formed a double bottom pattern on its weekly chart—a classic bullish reversal signal. This pattern typically appears after a prolonged downtrend and consists of two distinct troughs at roughly the same price level, separated by a moderate peak. It reflects a shift in market sentiment from bearish to bullish.
In Birlasoft’s case, the two bottoms were formed near the ₹330 zone, indicating strong support. The neckline resistance lies around ₹450, and a breakout above this level could confirm the pattern and trigger further upside.
RSI Positive Divergence: Momentum Shift
Adding strength to this setup is the Relative Strength Index (RSI) positive divergence. While the stock price made a lower low/equal low during the second bottom, the RSI made a higher low—signaling that bearish momentum is weakening. This divergence often precedes a price reversal and suggests that buyers are gradually regaining control.
Educational Takeaway
This setup is a textbook example of how combining price action with momentum indicators can enhance technical analysis:
Double Bottom: Indicates potential reversal and strong support.
RSI Divergence: Confirms weakening bearish momentum.
Volume Confirmation: A breakout above ₹450 with rising volume would validate the pattern.
Traders often wait for a breakout above the neckline with strong volume before entering long positions. Stop-losses are typically placed just below the second bottom to manage risk.
Final Thoughts
While the technicals suggest a bullish bias, it's crucial to monitor broader market conditions and company fundamentals. Birlasoft operates in the IT services sector, which is sensitive to global tech trends and client spending cycles.
This live chart analysis offers a compelling case for a potential trend reversal, but disciplined execution and risk management remain key.
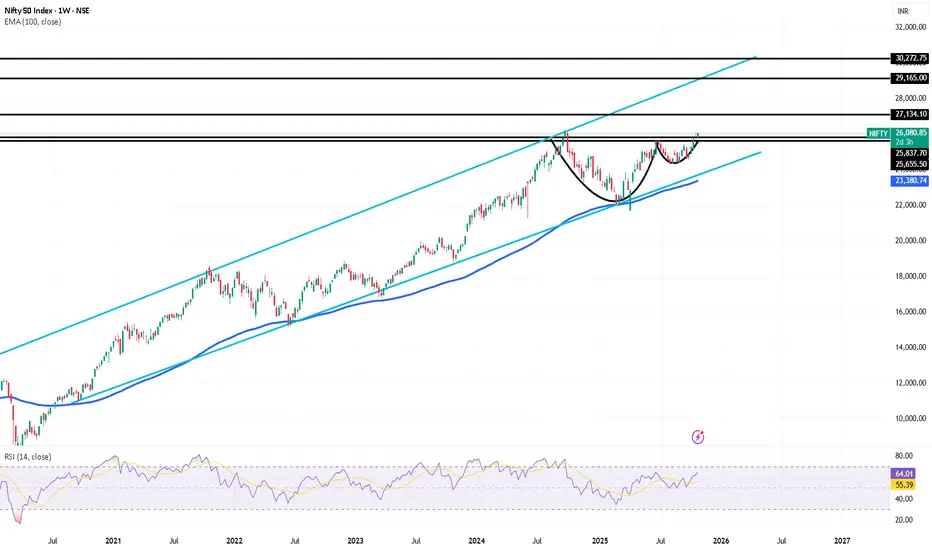
NIfty Positional on the verge of Breakout PatternHello everyone,
Nifty weekly forming Cup & handle pattern and about to break along with lifetime high with Good RSI strength is 64. Nifty corrected 16% from preivous high of 26270 falls continue for almost 6 month and in next 6 month recovered fully....possible trading in channel above 26600-700 there is 27500 and the 30000 is the targets.
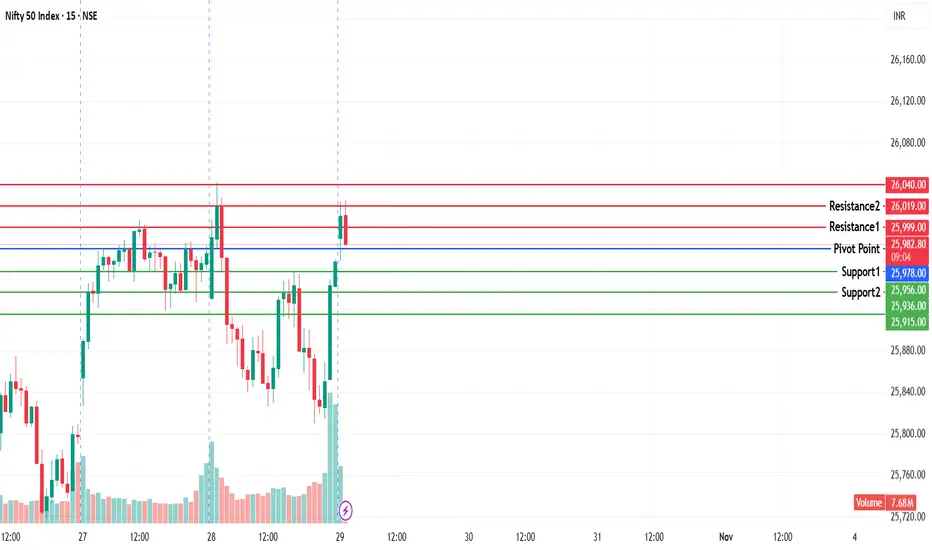
NIFTY KEY LEVELS FOR 29.10.2025NIFTY KEY LEVELS FOR 29.10.2025
Timeframe: 3 Minutes
If the candle stays above the pivot point, it is considered a bullish bias; if it remains below, it indicates a bearish bias. Price may reverse near Resistance 1 or Support 1. If it moves further, the next potential reversal zone is near Resistance 2 or Support 2. If these levels are also broken, we can expect the trend.
When a support or resistance level is broken, it often reverses its role; a broken resistance becomes the new support, and a broken support becomes the new resistance.
If the range(R2-S2) is narrow, the market may become volatile or trend strongly. If the range is wide, the market is more likely to remain sideways
please like and share my idea if you find it helpful
📢 Disclaimer
I am not a SEBI-registered financial adviser.
The information, views, and ideas shared here are purely for educational and informational purposes only. They are not intended as investment advice or a recommendation to buy, sell, or hold any financial instruments.
Please consult with your SEBI-registered financial advisor before making any trading or investment decisions.
Trading and investing in the stock market involves risk, and you should do your own research and analysis. You are solely responsible for any decisions made based on this research.
NIFTY : Trading levels and Plan for 29-Oct-2025NIFTY TRADING PLAN – 29-Oct-2025
📊 Nifty closed around 25,965, forming a tight consolidation within the No-Trade Zone (25,910 – 26,021). The index has been oscillating between intraday resistances and supports, showing signs of indecision. As we head into tomorrow’s session, traders should focus on reactions around the key breakout and breakdown levels.
🟩 SCENARIO 1: GAP-UP OPENING (100+ Points Above 26,021)
If Nifty opens above 26,021, it will immediately face the Last Intraday Resistance Zone (26,134 – 26,227).
A strong opening above 26,021 may trigger bullish momentum, driving prices toward 26,134.
Sustaining above 26,134 could attract follow-through buying, targeting 26,227 and possibly 26,300+.
However, this resistance zone is also a potential profit-booking area, where early buyers might book gains.
Failure to sustain above 26,134 could bring a pullback toward 26,021, which will act as an intraday pivot level.
🧠 Educational Insight:
Gap-ups often represent overnight optimism, but smart traders wait for a confirmation candle before entering. False breakouts near resistance zones can trap long positions quickly.
⚙️ Plan of Action:
→ If the first 15–30 minutes hold above 26,134, look for intraday long entries toward 26,227 – 26,300 with a stop-loss below 26,021.
→ If prices reject 26,134, expect a corrective dip — short-term traders can scalp short positions back toward 26,021.
🟨 SCENARIO 2: FLAT OPENING (Between 25,910 – 26,021)
A flat start inside the No-Trade Zone usually signals a day of range-bound activity in the initial session.
The market may stay choppy between 25,910 and 26,021 before choosing direction.
A breakout above 26,021 can trigger bullish momentum, while a breakdown below 25,910 will invite sellers.
Avoid trading inside this zone as both buyers and sellers may get trapped due to low directional clarity.
🧠 Educational Insight:
The “No-Trade Zone” is where risk-reward ratios are unfavorable. Experienced traders often wait for a clean breakout candle or volume confirmation before committing capital.
⚙️ Plan of Action:
→ Avoid premature entries. Wait for an hourly candle close above 26,021 or below 25,910 to initiate trades.
→ Maintain smaller position sizes until the trend direction becomes evident.
🟥 SCENARIO 3: GAP-DOWN OPENING (100+ Points Below 25,910)
If Nifty opens below 25,910, it will test the Last Intraday Support Zone (25,712 – 25,736).
Expect buyers to attempt a bounce from 25,712 – 25,736 initially.
If this zone fails, the next key support comes at 25,624, which could act as a potential reversal level.
A sustained break below 25,624 may trigger further downside pressure and shift short-term sentiment bearish.
🧠 Educational Insight:
Gap-downs often create emotional reactions, but disciplined traders wait to see if the first bounce holds. Many intraday reversals begin near strong support zones when retail traders panic sell.
⚙️ Plan of Action:
→ For aggressive traders: Short below 25,712 with targets near 25,624, keeping stop-loss above 25,910.
→ For conservative traders: Wait for a rejection candle near 25,910 to confirm a continuation or reversal pattern before entry.
💡 RISK MANAGEMENT TIPS FOR OPTIONS TRADERS
Avoid trading the first 15–30 minutes; let volatility settle before entering.
Always set a fixed stop-loss (preferably not exceeding 1–2% of your trading capital).
Prefer ITM options for directional trades to minimize time decay.
Exit half your position once you achieve 1:1 R:R to protect profits.
Avoid overtrading inside the No-Trade Zone — capital protection should be your top priority.
📘 SUMMARY & CONCLUSION
Key Resistance Levels: 26,021 → 26,134 → 26,227
Key Support Levels: 25,910 → 25,736 → 25,624
No Trade Zone: 25,910 – 26,021
🔹 Nifty remains in a neutral-to-cautious zone, with short-term volatility expected near 26,134 resistance.
🔹 A breakout above 26,134 can extend upside momentum, while a breakdown below 25,910 may invite fresh selling.
🔹 The best approach is to stay patient for directional clarity, respect levels, and trade with defined stops.
⚠️ Disclaimer: I am not a SEBI-registered analyst. This analysis is shared purely for educational and informational purposes. Please do your own research or consult a certified financial advisor before making any trading decisions.

NIFTY KEY LEVELS FOR 28.10.2025NIFTY KEY LEVELS FOR 28.10.2025
Timeframe: 3 Minutes
If the candle stays above the pivot point, it is considered a bullish bias; if it remains below, it indicates a bearish bias. Price may reverse near Resistance 1 or Support 1. If it moves further, the next potential reversal zone is near Resistance 2 or Support 2. If these levels are also broken, we can expect the trend.
When a support or resistance level is broken, it often reverses its role; a broken resistance becomes the new support, and a broken support becomes the new resistance.
If the range(R2-S2) is narrow, the market may become volatile or trend strongly. If the range is wide, the market is more likely to remain sideways
please like and share my idea if you find it helpful
📢 Disclaimer
I am not a SEBI-registered financial adviser.
The information, views, and ideas shared here are purely for educational and informational purposes only. They are not intended as investment advice or a recommendation to buy, sell, or hold any financial instruments.
Please consult with your SEBI-registered financial advisor before making any trading or investment decisions.
Trading and investing in the stock market involves risk, and you should do your own research and analysis. You are solely responsible for any decisions made based on this research.

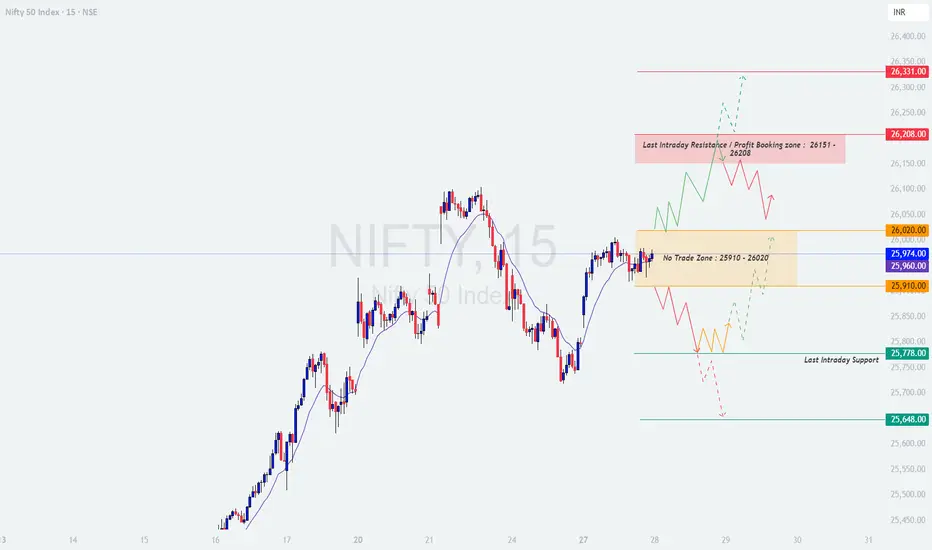
NIFTY : Trading levels and Plan for 28-Oct-2025 (Educational)NIFTY TRADING PLAN – 28-Oct-2025
📊 Nifty closed around 25,974, hovering within the No Trade Zone (25,910 – 26,020) after a choppy session. The index is showing signs of indecision as buyers defend lower supports near 25,778, while sellers remain active near the upper resistance zone around 26,151 – 26,208. Tomorrow’s move will largely depend on the opening tone and how prices react to the key levels outlined below.
🟩 SCENARIO 1: GAP-UP OPENING (100+ Points Above 26,020)
If Nifty opens above 26,020, it will immediately enter the Last Intraday Resistance / Profit Booking Zone (26,151 – 26,208).
Watch for quick momentum toward 26,151 — this is a critical intraday level where profit booking can emerge.
Sustaining above 26,208 may trigger fresh long entries, extending the move toward 26,331.
Failure to hold above 26,151 could bring the index back to retest the 26,020 breakout level — a healthy pullback zone for intraday traders.
A sustained break below 26,020 will indicate a failed gap-up breakout, turning bias neutral to mildly bearish.
🧠 Educational Insight:
Gap-ups often reflect overnight optimism, but smart traders wait for confirmation candles before chasing prices. The first 15–30 minutes are crucial to determine if the opening gap will sustain or fade.
⚙️ Plan of Action:
→ Let the first candle close; if Nifty holds above 26,151, long entries can be considered with targets toward 26,331 and stop-loss below 26,020.
🟨 SCENARIO 2: FLAT OPENING (Between 25,910 – 26,020)
A flat start within the No Trade Zone may lead to range-bound and confusing price action early in the session.
Bulls need a clean breakout above 26,020 to shift momentum back toward 26,151 – 26,208.
Bears will regain short-term control if prices slip below 25,910, potentially driving the index toward 25,778.
Avoid trading within this zone as whipsaws are likely due to equal buying and selling pressure.
🧠 Educational Insight:
When markets open flat within a “No Trade Zone,” patience is key. Many traders lose money trying to predict breakouts that never confirm. Let the price show strength before taking a stance.
⚙️ Plan of Action:
→ Wait for a decisive hourly close beyond 26,020 (for long) or below 25,910 (for short). Trade only post-confirmation with strict stop-loss rules.
🟥 SCENARIO 3: GAP-DOWN OPENING (100+ Points Below 25,910)
If Nifty opens below 25,910, it will shift short-term sentiment bearish, especially if opening occurs near 25,778 or below.
The first support zone lies around 25,778 — expect a possible technical bounce here.
If this support fails, the next target for sellers will be 25,648, where a temporary base could form.
Only a recovery and sustained close above 25,910 would negate the bearish pressure.
🧠 Educational Insight:
Gap-down openings often test traders’ emotions — avoid panic selling at open. Reversal candles around 25,778 can provide high R:R setups for quick intraday longs.
⚙️ Plan of Action:
→ Consider short positions below 25,778 with stop-loss above 25,910. For a safer play, wait for rejection candles near 25,910 before entering any directional trade.
💡 RISK MANAGEMENT TIPS FOR OPTIONS TRADERS
Avoid entering during the first 15–30 minutes after market opens — let volatility settle.
Always define your stop-loss — never risk more than 1–2% of total capital in a single trade.
Prefer deep ITM options for directional plays to reduce time decay.
Avoid trading when price remains in the “No Trade Zone”; capital preservation is priority.
Trail profits dynamically — once your trade achieves 1:1 R:R, secure partial gains.
📘 SUMMARY & CONCLUSION
Key Resistance Levels: 26,020 → 26,151 → 26,208 → 26,331
Key Support Levels: 25,910 → 25,778 → 25,648
No Trade Zone: 25,910 – 26,020
🔹 The bias remains neutral within the range, but momentum can quickly shift beyond 26,020 or below 25,910.
🔹 Buy on dips near 25,778 if support holds, and sell on rises near 26,208 if rejection patterns appear.
🔹 Stay flexible — the trend confirmation will only emerge after a decisive breakout beyond the defined zones.
⚠️ Disclaimer: I am not a SEBI-registered analyst. This analysis is purely for educational and informational purposes. Please do your own research or consult a certified financial advisor before taking any trading decision.
NIFTY KEY LEVELS FOR 27.10.2025NIFTY KEY LEVELS FOR 27.10.2025
Timeframe: 3 Minutes
If the candle stays above the pivot point, it is considered a bullish bias; if it remains below, it indicates a bearish bias. Price may reverse near Resistance 1 or Support 1. If it moves further, the next potential reversal zone is near Resistance 2 or Support 2. If these levels are also broken, we can expect the trend.
When a support or resistance level is broken, it often reverses its role; a broken resistance becomes the new support, and a broken support becomes the new resistance.
If the range(R2-S2) is narrow, the market may become volatile or trend strongly. If the range is wide, the market is more likely to remain sideways
please like and share my idea if you find it helpful
📢 Disclaimer
I am not a SEBI-registered financial adviser.
The information, views, and ideas shared here are purely for educational and informational purposes only. They are not intended as investment advice or a recommendation to buy, sell, or hold any financial instruments.
Please consult with your SEBI-registered financial advisor before making any trading or investment decisions.
Trading and investing in the stock market involves risk, and you should do your own research and analysis. You are solely responsible for any decisions made based on this research.

24 Oct 2025 - Happy Diwali Uptrend coming to an end? PostMortem Nifty Stance Bullish 🐂
Nifty has been in a bullish stance since the 3rd of October 2025, and we have amassed total gains of 960pts so far. If you have not made money this month, there is something wrong with your strategy, because this was the easiest month in the last 3 or 4 years to make money. The reason is that we have had an unchecked, one-way journey with nil reversal or choppiness.
If you were an option seller, you might have lost money, as the implied volatility (VIX) was at its all-time low, and the quick surge in the underlying (Nifty) would have taken out your stop losses. If you had not covered your shorts, your losses would have widened. As the count of speculators has gone down, it's hard to guess it from X, as very few people are sharing P&L screenshots these days.
Coming back to our EMA crossover strategy, we are looking at 960+ points of unrealized gains. At one point, the gains exceeded 1,250+, all thanks to Trump's tweets indicating that Indian tariffs may be reduced to 15% from the current 50%. Our technical analysis is no match for his tweets, and the only way to protect ourselves is to use a fully hedged credit/debit spread instead of naked longs or shorts.
From the chart, you can see that the faster EMA (orange line) is dipping and could cross the blue line on Monday if we maintain a narrow ATR of 100 points or keep falling. We have the monthly expiry coming Tuesday, and it could be a flatter expiry, as we have already moved a lot on price in this series. If we fall on Tuesday, I would be very excited to play the Sensex expiry on Thursday as well.
The support levels for Nifty are 25681, 25219, and 25003 (hoping we don't fall that much). The resistance is faint at 25906, breaching which could take us to the ATHs soon.
---
If you liked this article, consider sharing it with someone who could benefit from this.

NIFTY : Trading levels and Plan for 27-Oct-2025 (educational)📘 NIFTY TRADING PLAN – 27-Oct-2025
📊 Timeframe: 15-Min | Analysis by LiveTradingBox
📈 Index Close: 25,797.45 (−0.01%)
🧭 Key Reference Levels
🟥 Last Intraday Resistance: 26,020
🟧 Opening Resistance: 25,910
🟨 Opening Support / Resistance Zone: 25,714 – 25,758
🟩 Last Intraday Support Zone: 25,553 – 25,581
🚀 Scenario 1: Gap-Up Opening (100+ Points Above Previous Close)
If Nifty opens near or above 25,900–25,950, it enters the Opening Resistance Zone. This area has repeatedly attracted sellers in the recent sessions. A gap-up may therefore test the patience of both bulls and bears as traders assess whether the move is sustainable or just another reaction to short-covering.
If Nifty sustains above 25,910 for 15–30 minutes with supportive volume, a momentum extension toward 26,020 and potentially 26,150 could unfold.
However, if the index fails to hold above 25,910, profit booking may drag prices back to the 25,758–25,714 zone.
Aggressive buyers should wait for a retest near 25,758 before entering, as this level could provide better risk/reward structure.
Only a sustained break above 26,020 with hourly candle confirmation may invite positional longs aiming toward 26,150+.
🟢 Educational Tip: After strong gap-up openings, avoid chasing the price in the first few candles. Wait for a base-building or retest setup to confirm market intent — remember, the first 15–30 minutes often define the trap zone.
⚖️ Scenario 2: Flat Opening Around 25,780 – 25,820
A flat start around the current closing levels suggests market indecision. The Opening Support Zone (25,714–25,758) will act as the first battlefield between buyers and sellers.
If Nifty holds this zone and crosses above 25,910, a bullish intraday bias could develop, targeting 26,020.
But if the index repeatedly fails near 25,910, expect sideways-to-weak bias, as intraday traders may prefer range setups between 25,750–25,910.
Breakdown below 25,714 with volume confirmation can trigger a short move toward 25,600 and then 25,553 (last support).
Patience is crucial; the best trades form when the market reveals its direction post-opening volatility.
🟠 Educational Insight: Flat openings reflect balance between overnight buyers and sellers. In such cases, structure-based trades — breakouts or breakdowns with volume confirmation — are far superior to speculative entries.
🔻 Scenario 3: Gap-Down Opening (100+ Points Below Previous Close)
If Nifty opens near 25,650–25,600, it steps into the Last Intraday Support Zone (25,553–25,581). This region is critical as it represents the prior demand zone from where intraday recoveries were observed.
Look for reversal signals like bullish engulfing, hammer, or higher low near 25,560 to anticipate short-covering rallies.
A rebound above 25,714–25,758 can confirm a recovery attempt targeting 25,910.
Conversely, a breakdown below 25,553 with heavy volume may lead to deeper selling toward 25,480–25,450 zones.
Avoid impulsive trades immediately at the open; let the first 15-minute candle settle before reacting.
🔴 Educational Note: Gap-downs often trigger emotional trades. Focus on reaction at key supports — a well-timed reversal trade from strong zones can yield high reward with limited risk.
💡 Risk Management Tips for Options Traders
🎯 Stick to defined setups: Trade only near marked zones with clear confirmation.
💰 Position sizing: Risk not more than 2% of your total capital on a single trade.
🛑 Stop Loss Discipline: Always use a strict stop loss based on an hourly close — avoid emotional widening.
⌛ Avoid early entries: The first 30 minutes are for observation, not execution.
📊 Book partial profits: Secure 30–40% gains early and trail stop loss to cost for remaining position.
📆 Avoid overnight option positions: Theta decay and event risks can distort reward potential.
🧩 Summary & Conclusion
Nifty currently trades between two crucial decision zones — 25,553–25,581 (Support) and 26,020 (Resistance).
A breakout above 26,020 may open gates for 26,150, while a breakdown below 25,553 could extend weakness toward 25,450.
The broader sentiment remains neutral-to-bullish as long as Nifty holds above 25,714. The plan should be to trade only confirmed breakouts or retests, ensuring entries align with volume and structure rather than impulse. Remember — discipline and timing are your best tools, not prediction. 🧘♂️
⚠️ Disclaimer:
I am not a SEBI-registered analyst. This analysis is shared purely for educational and informational purposes. Traders are advised to conduct their own research or consult a certified financial advisor before making any investment or trading decisions.

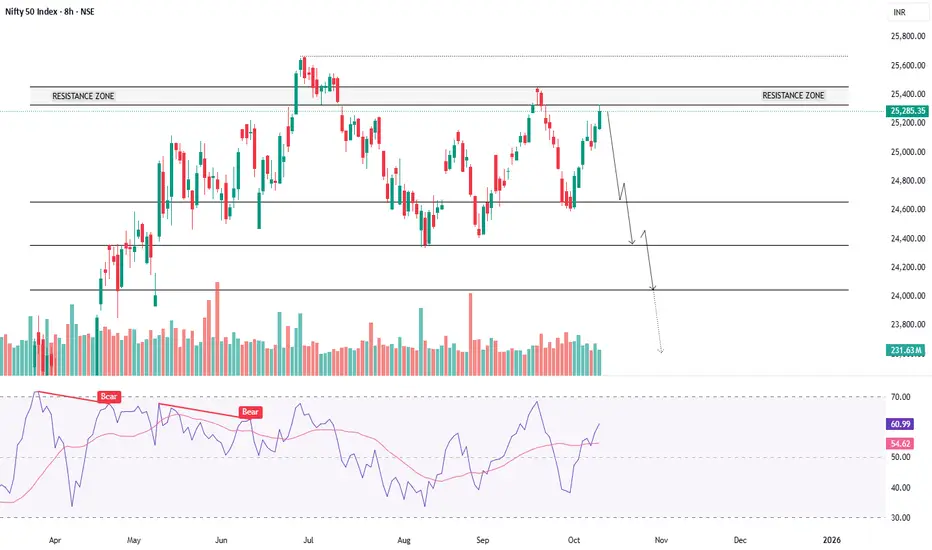
NIFTY50 - VULNERABLE TO 20% CORRECTIONSymbol - NIFTY50
NIFTY50 has been trading within a defined range for the past several months, unable to generate any meaningful trending move due to the absence of strong fundamental or macroeconomic catalysts on either side. Both bullish and bearish drivers have remained largely muted, resulting in a period of indecision and lackluster volatility.
While the index itself has shown little directional progress, distribution patterns are increasingly visible across the broader market, which continues to exhibit a consolidation to bearish bias. This suggests that institutional participation may be shifting, and underlying sentiment is weakening despite the Nifty50’s apparent stability.
There are several macroeconomic and geopolitical factors that could contribute to a potential correction in global equity markets. Although listing them all would make this analysis excessively long, some of the key concerns include:
1. Rising inflationary pressures driven by US tariffs implemented under Trump’s economic policy.
2. Weak US fiscal policy and growing concerns that the US government could default on its debt obligations.
3. Elevated recession expectations in the United States.
4. Gold and Silver simultaneously hitting historic highs, signaling a clear risk-off sentiment, even as US equity markets trade at record levels.
5. Overvaluation and speculative euphoria in AI and machine learning related stocks, indicating a potential bubble in select sectors.
At current levels, valuations appear moderately high, and the 'smart money' or true value buying zones remain significantly lower. Based on these factors, my personal bias leans toward a major correction in the coming months. I anticipate a potential downside of around 20% or more in NIFTY50.
This is a positional view, so I am not sharing immediate support or resistance levels. However, the 20-21K zone and below may represent attractive long term accumulation levels for investors once the correction plays out.
It’s worth recalling that in my previous outlook last year, when Nifty50 traded near 26000, I projected a 10–15% correction, which materialized shortly after. This time, however, the downside potential could be even deeper - though only time will tell how the broader macro picture unfolds.
Disclaimer: This analysis is shared purely for educational purposes and should not be considered trading or investment advice.
NIFTY KEY LEVELS FOR 24.10.2025NIFTY KEY LEVELS FOR 24.10.2025
Timeframe: 3 Minutes
If the candle stays above the pivot point, it is considered a bullish bias; if it remains below, it indicates a bearish bias. Price may reverse near Resistance 1 or Support 1. If it moves further, the next potential reversal zone is near Resistance 2 or Support 2. If these levels are also broken, we can expect the trend.
When a support or resistance level is broken, it often reverses its role; a broken resistance becomes the new support, and a broken support becomes the new resistance.
If the range(R2-S2) is narrow, the market may become volatile or trend strongly. If the range is wide, the market is more likely to remain sideways
please like and share my idea if you find it helpful
📢 Disclaimer
I am not a SEBI-registered financial adviser.
The information, views, and ideas shared here are purely for educational and informational purposes only. They are not intended as investment advice or a recommendation to buy, sell, or hold any financial instruments.
Please consult with your SEBI-registered financial advisor before making any trading or investment decisions.
Trading and investing in the stock market involves risk, and you should do your own research and analysis. You are solely responsible for any decisions made based on this research.

NIFTY KEY LEVELS FOR 23.10.2025NIFTY KEY LEVELS FOR 23.10.2025
Timeframe: 3 Minutes
If the candle stays above the pivot point, it is considered a bullish bias; if it remains below, it indicates a bearish bias. Price may reverse near Resistance 1 or Support 1. If it moves further, the next potential reversal zone is near Resistance 2 or Support 2. If these levels are also broken, we can expect the trend.
When a support or resistance level is broken, it often reverses its role; a broken resistance becomes the new support, and a broken support becomes the new resistance.
If the range(R2-S2) is narrow, the market may become volatile or trend strongly. If the range is wide, the market is more likely to remain sideways
please like and share my idea if you find it helpful
📢 Disclaimer
I am not a SEBI-registered financial adviser.
The information, views, and ideas shared here are purely for educational and informational purposes only. They are not intended as investment advice or a recommendation to buy, sell, or hold any financial instruments.
Please consult with your SEBI-registered financial advisor before making any trading or investment decisions.
Trading and investing in the stock market involves risk, and you should do your own research and analysis. You are solely responsible for any decisions made based on this research.