Nifty 50: Monthly Supply Zone Rejection Signals Bearish Momentum📊 Monthly Timeframe Analysis 📊
Nifty 50 and Nifty 500 have both respected their monthly supply zones, taking a clear rejection from these levels. Interestingly, despite the difference in the number of stocks (50 vs. 500), both indices are showing identical patterns, which the market is currently reflecting as a strong bearish bias.
📉 Weekly Timeframe Analysis
The weekly chart shows a proper rejection from a sloping downtrend line, confirming sellers’ dominance.
This week’s candle has formed a Bearish Marubozu – a long body with tiny wicks – indicating strong selling pressure.
Structurally, this candle aligns with an Evening Star type reversal, reinforcing the bearish bias.
Key takeaway: Weekly chart clearly favors the bears until price sustains above the supply zone.
📉 Daily Timeframe Analysis
On the daily chart, selling pressure has been continuing for the past few sessions.
Today’s candle is a Gap Down Bearish Candle, forming part of a Three Black Crows pattern on Nifty 500.
This confirms a short-term trend reversal and strong bearish momentum.
The next major support lies around the demand zone Nifty (~24475). If price tests this zone and reverses, we may see a bounce.
However, if the daily close is below this demand zone in upcoming sessions, expect further downside.
✅ Final Outlook ✅
Monthly supply zone has triggered a bearish reversal, coinciding with the Weekly Downtrend line.
Strong Bearish Marubozu on weekly close signals a shift in trend toward sellers.
Daily Three Black Crows + Gap Down candle confirms strong selling pressure in the short term.
Overall bias remains bearish until support near the demand zone shows a potential reversal.
“Patience and discipline are your best allies in trading; let the charts guide you, not emotions.”
Lastly, thank you for your support, your likes & comments. 📈 Keep analyzing, keep learning, and let the charts teach you every day!
This analysis is purely for educational purposes and is not a trading or investment recommendation. I am not a SEBI registered analyst.
Niftyprediction

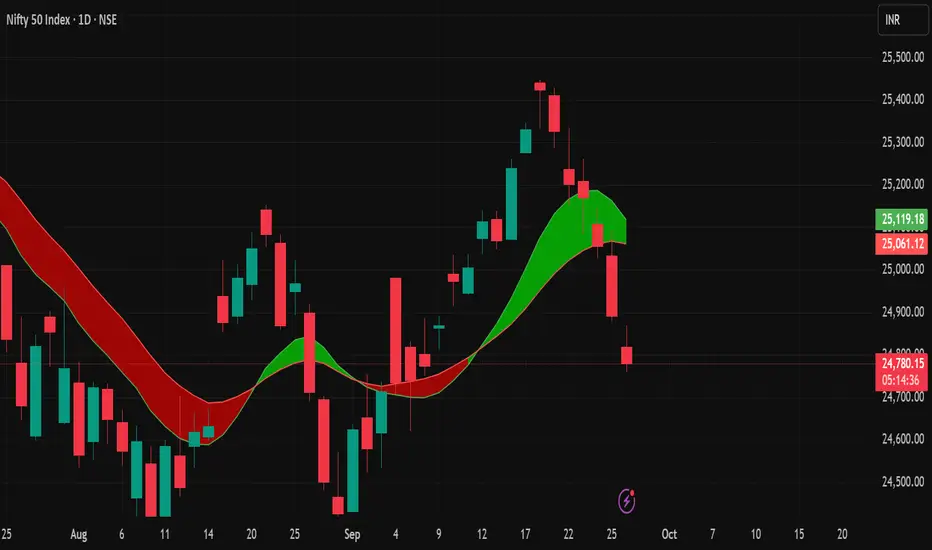
NIFTY50 Market Update✅ Market Trend Indicator is still Green, meaning the market is currently in accumulation mode.
📍 Key Observations:
A gap imbalance exists between 24,732 – 24,713 → This will act as the last support for Nifty50.
As long as 25,150 holds, the market has strength to move upside towards 25,600 – 25,900.
Weekly candle is also highlighting the same last gap imbalance at 24,732.
Monthly candle was bullish but could not capture the upside liquidity at 25,600 (previous candle level).
📈 Outlook:
🔹 Maximum chances for next month bullish continuation towards 25,600+.
🔖 Hashtag: #𝗧𝗿𝘂𝗲𝗗𝗶𝗿𝗲𝗰𝘁𝗶𝗼𝗻𝘀𝟭
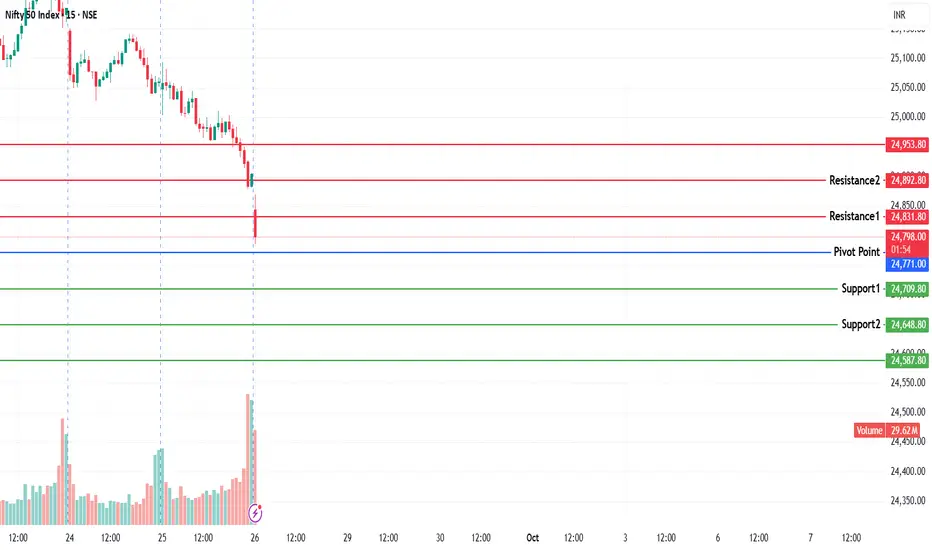
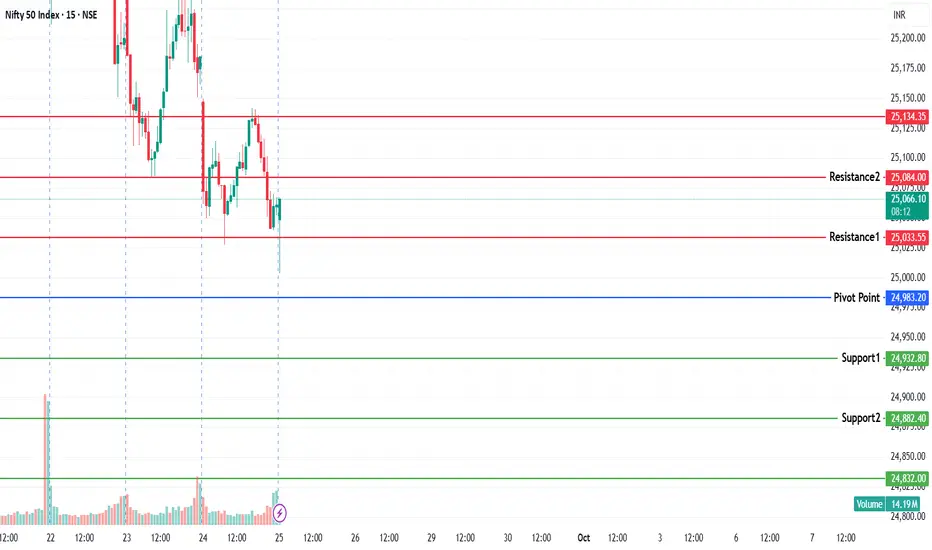
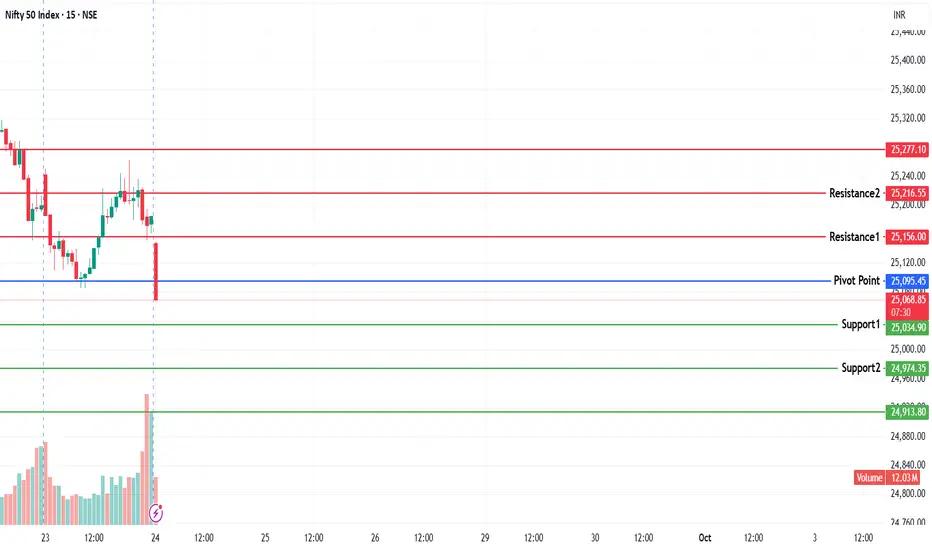
NIFTY KEY LEVELS FOR 26.09.2025NIFTY KEY LEVELS FOR 26.09.2025
RTF: 3 Minutes
If the candle stays above the pivot point, it is considered a bullish bias; if it remains below, it indicates a bearish bias. Price may reverse near Resistance 1 or Support 1. If it moves further, the next potential reversal zone is near Resistance 2 or Support 2. If these levels are also broken, we can expect the trend.
When a support or resistance level is broken, it often reverses its role; a broken resistance becomes the new support, and a broken support becomes the new resistance.
If the range(R2-S2) is narrow, the market may become volatile or trend strongly. If the range is wide, the market is more likely to remain sideways
please like and share my idea if you find it helpful
📢 Disclaimer
I am not a SEBI-registered financial adviser.
The information, views, and ideas shared here are purely for educational and informational purposes only. They are not intended as investment advice or a recommendation to buy, sell, or hold any financial instruments.
Please consult with your SEBI-registered financial advisor before making any trading or investment decisions.
Trading and investing in the stock market involves risk, and you should do your own research and analysis. You are solely responsible for any decisions made based on this research.
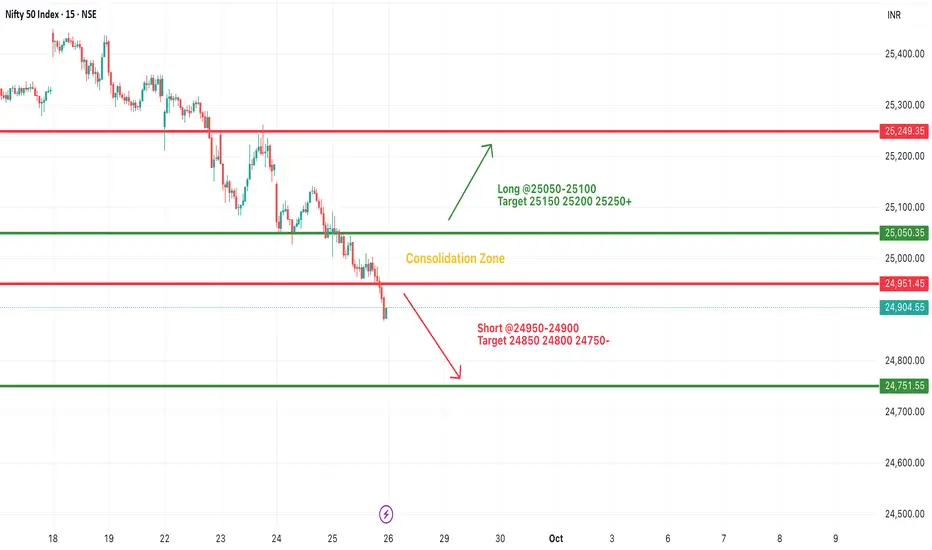
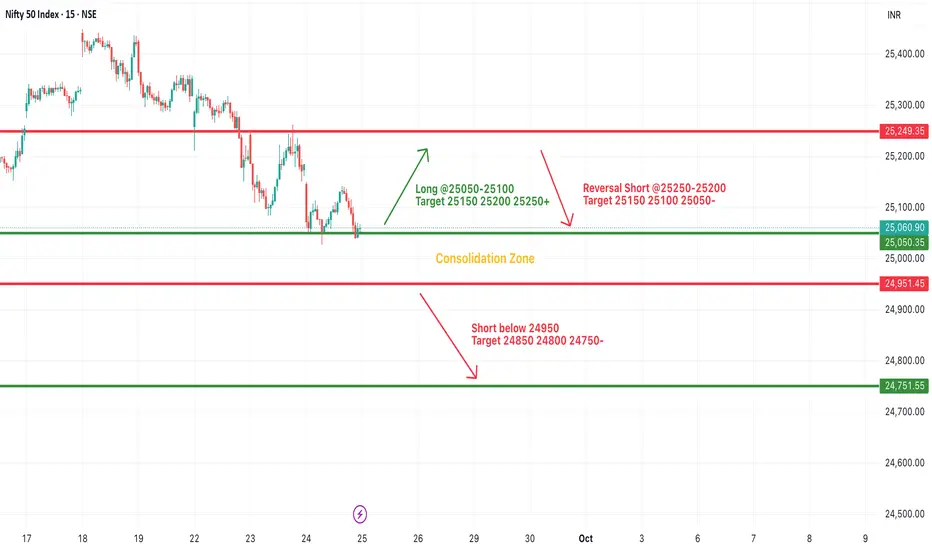
#NIFTY Intraday Support and Resistance Levels - 26/09/2025Nifty is expected to open on a flat note near the 24,900 zone, showing signs of consolidation. On the upside, a move above 25,050–25,100 will be crucial for bulls to regain strength, which can open the path toward 25,150, 25,200, and 25,250+. Sustaining above these levels may extend the rally further. On the downside, immediate support lies at 24,950, and a breakdown below 24,900 could trigger selling pressure, dragging Nifty lower toward 24,850, 24,800, and 24,750-.
Overall, the index is currently trading in a consolidation zone, where both upside and downside moves are possible. Traders should closely monitor the breakout and breakdown levels for directional confirmation. With a flat opening expected, it’s important to follow strict stop-loss rules and trail profits as targets are achieved.
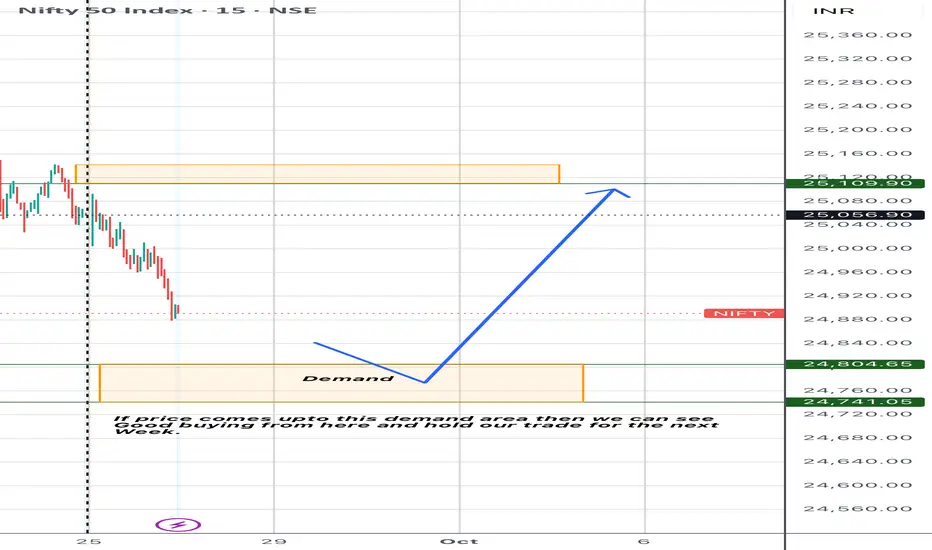
Nifty for the next week Good support area
If we see any sign of bullish flag from this zone
The we can good buying from here and catch atleast 300nifty points.
Just watch the price
If price shows 15min Ema crossover then good trade can be possible to make money here.
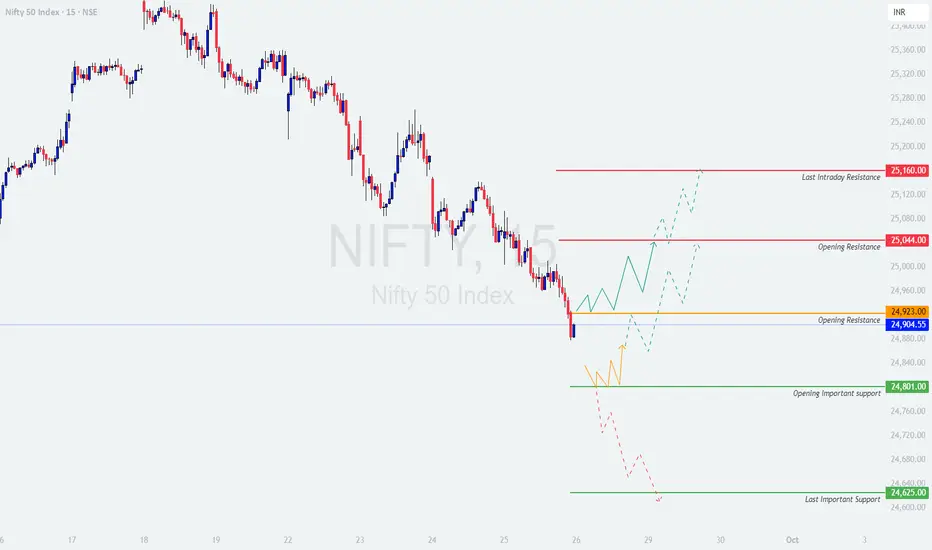
NIFTY : Trading levels and Plan for 26-Sep-2025NIFTY TRADING PLAN – 26-Sep-2025
Nifty closed at 24,904.55, very close to the Opening Resistance Zone at 24,904 – 24,923 . Tomorrow’s opening will be crucial in determining whether bulls regain control or bears extend pressure further.
📌 Key Levels to Watch:
Opening Resistance: 24,904 – 24,923
Immediate Resistance: 25,044
Last Intraday Resistance: 25,160
Opening Important Support: 24,801
Last Important Support: 24,625
🚀 Scenario 1: Gap Up Opening (100+ points)
If Nifty opens near or above 25,000 – 25,050, it will immediately test the Opening Resistance at 25,044 .
Sustaining above 25,044 can invite further upside towards 25,160 (Last Intraday Resistance) .
A breakout above 25,160 may trigger fresh momentum buying, potentially extending towards higher zones.
However, failure to hold above 25,044 may attract selling pressure and drag prices back into the 24,904 – 24,923 consolidation zone.
👉 Educational Note: Gap-ups often trap late buyers. Always look for follow-through candles above resistance before adding long positions.
⚖️ Scenario 2: Flat Opening (within ±100 points)
A flat start around 24,850 – 24,950 will keep Nifty in the Opening Resistance zone (24,904 – 24,923) .
Sustaining above 24,923 will give buyers an edge, opening the path towards 25,044 → 25,160.
On the flip side, if the index struggles and slips below 24,904, weakness may extend towards 24,801 (Opening Important Support) .
Traders should be prepared for range-bound price action until either side decisively breaks.
👉 Educational Note: Flat openings offer better clarity as both buyers and sellers test their levels naturally, reducing false breakouts.
📉 Scenario 3: Gap Down Opening (100+ points)
If Nifty opens below 24,800, it will directly test the Opening Important Support at 24,801 .
A breakdown below this level can extend bearishness towards 24,625 (Last Important Support) .
If buyers defend 24,801 – 24,625, a relief rally back to 24,904 is possible through short-covering.
But sustained trading below 24,625 may accelerate selling pressure, weakening market sentiment further.
👉 Educational Note: Gap-downs are usually panic-driven. Safer trades emerge after waiting for confirmation at key supports instead of chasing the first move.
🛡️ Risk Management Tips for Options Traders
Wait for the first 15–30 minutes before entering trades to avoid being trapped by initial volatility.
Use hourly candle close to validate stop losses instead of reacting to intraday spikes.
Avoid naked call/put buying near resistance/support; instead, use spreads (Bull Call / Bear Put).
Keep a minimum 1:2 risk-to-reward ratio for every trade.
Book partial profits on the way instead of holding full lots till the final target.
Always position size carefully—never risk more than 2% of capital in a single trade.
📌 Summary & Conclusion
Bullish View: Above 25,044, momentum may extend to 25,160.
Range-Bound Zone: Between 24,904 – 24,923, expect consolidation until breakout.
Bearish View: Below 24,801, weakness may drag Nifty towards 24,625.
📊 Nifty is trading around a decisive resistance zone. The first 30 minutes will be crucial to determine whether bulls can push above 25,044 or bears take charge below 24,801. Patience and disciplined risk management are key.
⚠️ Disclaimer: This trading plan is for educational purposes only. I am not a SEBI-registered analyst. Please do your own analysis or consult a financial advisor before trading.
NIFTY KEY LEVELS FOR 25.09.2025NIFTY KEY LEVELS FOR 25.09.2025
RTF: 3 Minutes
If the candle stays above the pivot point, it is considered a bullish bias; if it remains below, it indicates a bearish bias. Price may reverse near Resistance 1 or Support 1. If it moves further, the next potential reversal zone is near Resistance 2 or Support 2. If these levels are also broken, we can expect the trend.
When a support or resistance level is broken, it often reverses its role; a broken resistance becomes the new support, and a broken support becomes the new resistance.
If the range(R2-S2) is narrow, the market may become volatile or trend strongly. If the range is wide, the market is more likely to remain sideways
please like and share my idea if you find it helpful
📢 Disclaimer
I am not a SEBI-registered financial adviser.
The information, views, and ideas shared here are purely for educational and informational purposes only. They are not intended as investment advice or a recommendation to buy, sell, or hold any financial instruments.
Please consult with your SEBI-registered financial advisor before making any trading or investment decisions.
Trading and investing in the stock market involves risk, and you should do your own research and analysis. You are solely responsible for any decisions made based on this research.
#NIFTY Intraday Support and Resistance Levels - 25/09/2025Nifty is expected to open with a gap down near the 25,050 zone, which lies within the current consolidation range. On the upside, if the index sustains above 25,050–25,100, it can trigger buying momentum toward 25,150, 25,200, and 25,250+.
A breakout above 25,250 will further strengthen the bullish sentiment and open the path for higher levels. On the downside, immediate support is placed around 25,000–24,950, and a breakdown below this zone may invite fresh selling pressure, dragging the index lower toward 24,850, 24,800, and 24,750-.
Additionally, a reversal short near the 25,200–25,250 resistance band cannot be ruled out, which may push prices back toward the lower range. Overall, Nifty remains in a consolidation phase, and traders should wait for a clear breakout or breakdown before taking directional positions.
Nifty trade idea for 25-9-2025As per my analysis this weeks target are done.
Now nifty will move in between or from these marked supply demand areas.
If we find any sign of support or rejection from marked zones then we can look for a trade.
Find mss in 5 min or 9 ema setup to target at-least 75 points in nifty.

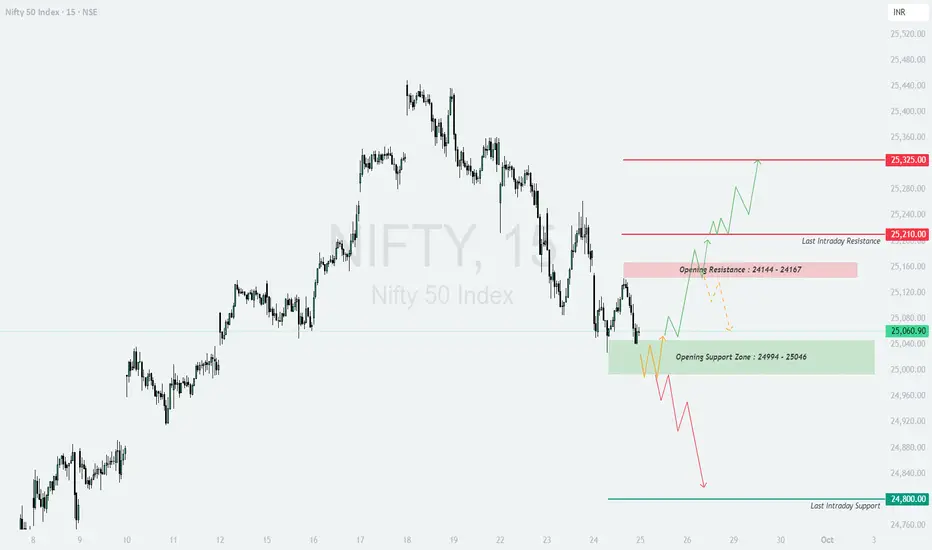
NIFTY : Trading levels and Plan for 26-Sep-2025NIFTY TRADING PLAN – 25-Sep-2025
Nifty closed around 25,060.90, and the chart shows critical levels for the upcoming session. Traders should focus on the Opening Support Zone: 24,994 – 25,046 and Opening Resistance Zone: 25,144 – 25,167 . Major intraday boundaries are set at 24,800 (Support) and 25,325 (Resistance) .
🚀 Scenario 1: Gap Up Opening (100+ points)
If Nifty opens above 25,160+, it will directly enter the Opening Resistance Zone . Traders should watch whether price sustains above this zone or shows rejection.
Sustaining above 25,167 can lead to bullish momentum towards the last intraday resistance at 25,210 and further extension to 25,325 .
If rejection occurs, price may slip back to the support zone of 25,046–24,994, where buying interest may re-emerge.
👉 Educational Note: A strong gap-up often traps late buyers. Wait for the first 15–30 minutes to confirm if the breakout sustains before entering.
⚖️ Scenario 2: Flat Opening (within ±100 points)
A flat start near 25,060 means price will hover close to the Opening Support Zone .
Holding above 25,046 can trigger an upward move towards 25,144–25,167 resistance. If broken, it opens the path for 25,210 → 25,325.
On the downside, failure to hold 25,046 may bring quick selling towards 24,994, and extended weakness can test the last intraday support of 24,800.
👉 Educational Note: Flat openings are usually safer for directional trades since they allow traders to align with intraday trend rather than chasing gaps.
📉 Scenario 3: Gap Down Opening (100+ points)
A gap-down below 24,960 will pressure the market, pushing it closer to the Opening Support Zone (24,994–25,046) .
If Nifty breaks below 24,994 and sustains, expect selling pressure towards the last intraday support at 24,800 .
However, if support holds, a sharp short-covering bounce may lift Nifty back towards 25,046 → 25,144 levels.
👉 Educational Note: Gap-down openings are often emotional reactions to global cues. Avoid panic entries; instead, wait for price to show whether the support zone holds.
🛡️ Risk Management Tips for Options Traders
Always define your stop-loss on hourly closing basis to avoid noise from smaller candles.
Avoid over-leveraging; trade with limited lots suitable for your capital.
Do not chase gaps. Let the first 30 minutes decide market direction.
Prefer spreads (like Bull Call or Bear Put Spreads) near resistance/support zones to manage premium decay.
Keep risk-to-reward at least 1:2 before entering trades.
📌 Summary & Conclusion
Bullish Trigger: Above 25,167, expect momentum towards 25,210 → 25,325.
Neutral Zone: Between 25,046 – 25,144, price may consolidate before choosing direction.
Bearish Trigger: Below 24,994, weakness may extend towards 24,800.
Traders should remain flexible and adapt to intraday price action. Waiting for confirmation after the open will help in avoiding false breakouts and improve probability of success.
⚠️ Disclaimer: This analysis is purely for educational purposes. I am not a SEBI-registered analyst. Traders are advised to do their own research or consult with a financial advisor before making trading decisions.
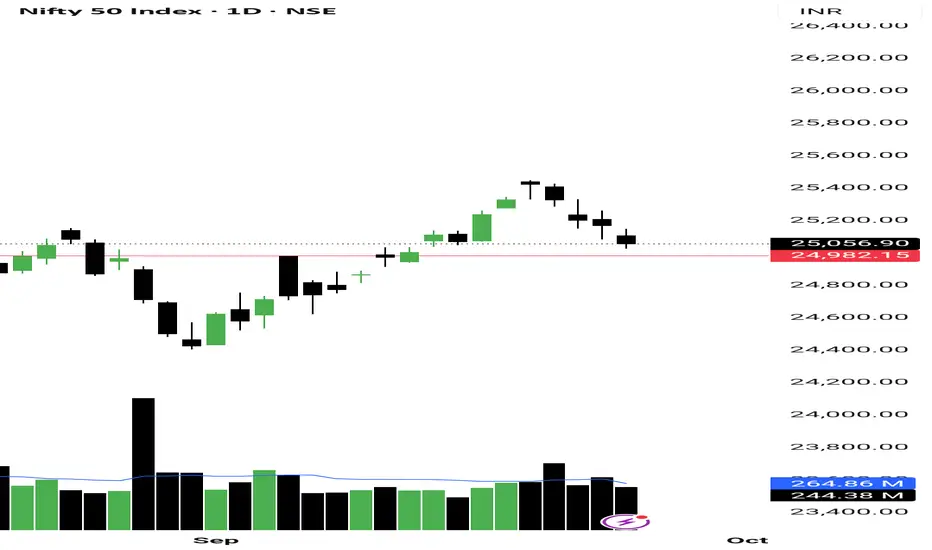
Wait and Watch day for Nifty Everything played out exactly as we planned yesterday.
The strong sellers’ volume from yesterday reflected today, and NSE:NIFTY saw a sell-on-rise move from the highs.
When the market follows the plan, it simply means the move is predictable and the environment is tradable.
Now for today – Nifty gave a good bounce from its support near 25025.
However, this bounce isn’t strong because sellers’ volume was still 40 million higher than buyers.
So my strategy for tomorrow will be Wait and Watch. Since the index bounced from support but sellers’ volume remains high, I will only trade on confirmed breakouts of levels.
If Nifty opens above the pivot at 25078 and breaks the resistance at 25150, I’ll go long with an upside target of 25250.
If it opens above the pivot but falls and breaks below 25000, I’ll short with a downside target of 24930.
Sector focus for tomorrow – NBFCs, as many stocks there are showing turnover buildup.
Today we booked 6% profit in NSE:TOLINS and 18% profit in $NSE:ARCHIES.
That’s all for today. Take care. Have a profitable day ahead.
---
📊 Levels at a glance:
Pivot: 25078
Support 1: 25025
- Support 2: 25000 (below this = short, target 24930)
- Resistance 1: 25150 (above this = long, target 25250)
Bias: Wait and Watch, trade only on breakout of levels
Sector focus: NBFCs
NIFTY KEY LEVELS FOR 24.09.2025NIFTY KEY LEVELS FOR 24.09.2025
RTF: 3 Minutes
If the candle stays above the pivot point, it is considered a bullish bias; if it remains below, it indicates a bearish bias. Price may reverse near Resistance 1 or Support 1. If it moves further, the next potential reversal zone is near Resistance 2 or Support 2. If these levels are also broken, we can expect the trend.
When a support or resistance level is broken, it often reverses its role; a broken resistance becomes the new support, and a broken support becomes the new resistance.
If the range(R2-S2) is narrow, the market may become volatile or trend strongly. If the range is wide, the market is more likely to remain sideways
please like and share my idea if you find it helpful
📢 Disclaimer
I am not a SEBI-registered financial adviser.
The information, views, and ideas shared here are purely for educational and informational purposes only. They are not intended as investment advice or a recommendation to buy, sell, or hold any financial instruments.
Please consult with your SEBI-registered financial advisor before making any trading or investment decisions.
Trading and investing in the stock market involves risk, and you should do your own research and analysis. You are solely responsible for any decisions made based on this research.
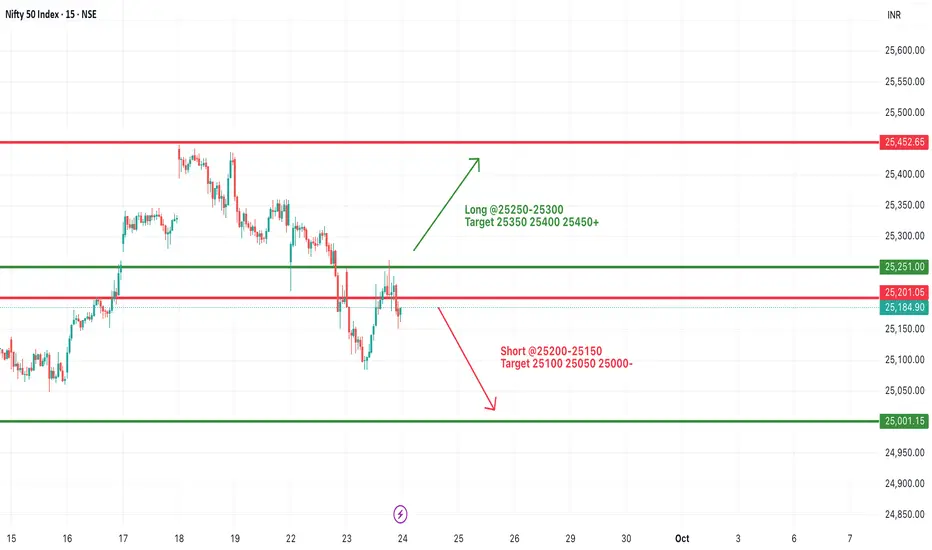
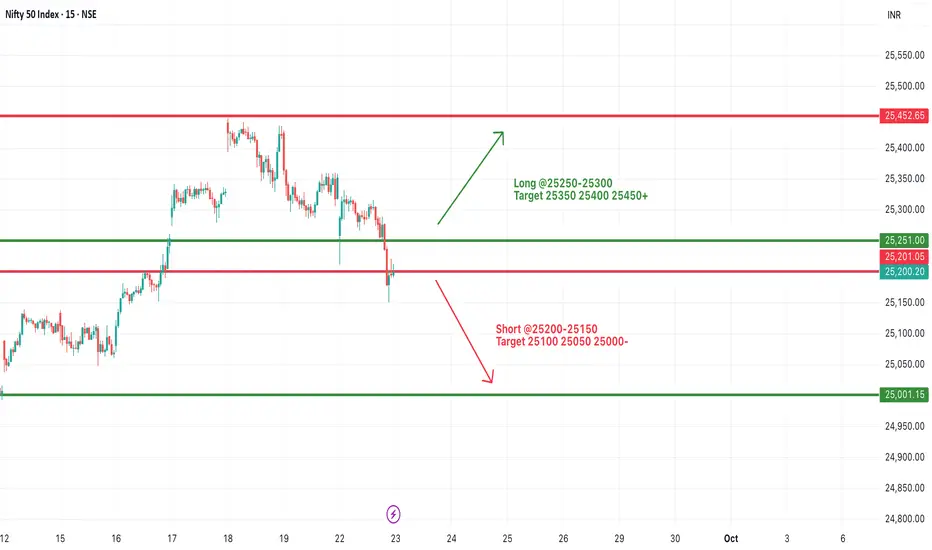
#NIFTY Intraday Support and Resistance Levels - 24/09/2025Nifty, a flat opening is expected near 25,200 levels. On the upside, a move above 25,250–25,300 can trigger fresh buying momentum, pushing the index toward 25,350, 25,400, and 25,450+. If it sustains beyond 25,450, the rally can extend further.
On the downside, immediate support lies around 25,200–25,150. A breakdown below this zone may open the way for selling pressure, dragging the index lower toward 25,100, 25,050, and 25,000-.
Overall, Nifty is consolidating near a key support-resistance zone. A decisive breakout above 25,300 or breakdown below 25,150 will decide the directional trend for the session. Traders should stay cautious and trade with strict stop-losses while trailing profits as levels unfold.
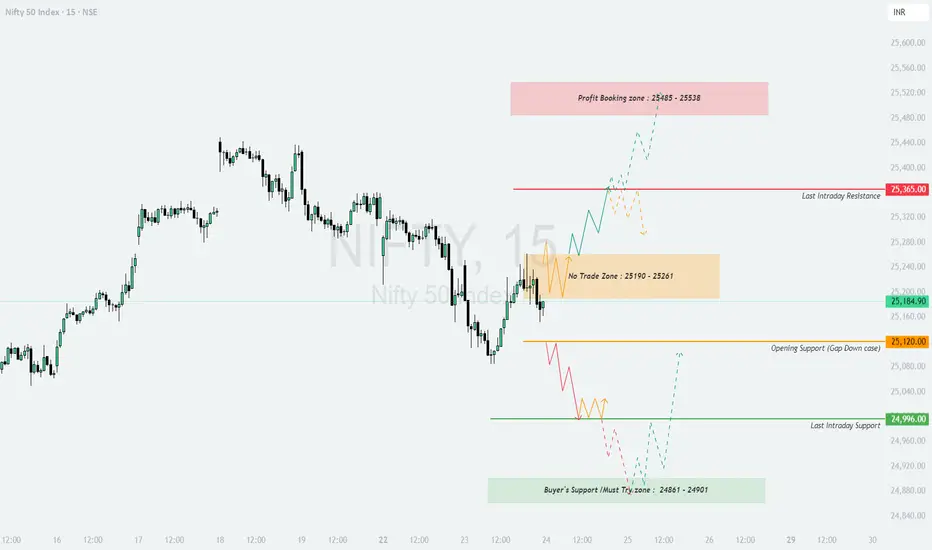
NIFTY : Trading levels and Plan for 24-Sep-2025NIFTY TRADING PLAN – 24-Sep-2025
📌 Key Levels to Watch :
🟥 25,485 – 25,538 → Profit Booking Zone
🟥 25,365 → Last Intraday Resistance
🟧 25,190 – 25,261 → No Trade Zone
🟧 25,120 → Opening Support (Gap Down case)
🟩 24,996 → Last Intraday Support
🟩 24,861 – 24,901 → Buyer’s Must Try Zone
🚀 Gap Up Opening (100+ points above previous close)
If Nifty opens above 25,261, immediate resistance lies near 25,365. Sustained price action above this level can open the door to the Profit Booking Zone (25,485 – 25,538) .
Traders can consider long trades above 25,365, but profit booking is advisable once prices approach the upper band.
However, if Nifty fails to sustain above 25,365, a pullback toward the No Trade Zone (25,190 – 25,261) is possible.
📚 Educational Note: Gap-up openings near resistance levels can create false breakouts. Always wait for a strong candle close above resistance to confirm momentum.
⚖️ Flat Opening (within 100 points range)
If Nifty opens inside the 25,190 – 25,261 No Trade Zone, avoid aggressive entries as price action may remain choppy.
A breakout above 25,261 with strength may push the index toward 25,365 and higher levels.
A breakdown below 25,190 can drag the index toward 25,120 and 24,996 supports.
📚 Educational Note: Flat openings inside congestion zones are best avoided until the market provides a clear breakout direction. Patience often saves capital in such situations.
⚠️ Gap Down Opening (100+ points below previous close)
If Nifty opens below 25,120, weakness can extend toward the Last Intraday Support at 24,996.
A further drop could test the Buyer’s Must Try Zone (24,861 – 24,901) , where strong buying interest may emerge.
Reversal signals here can be used for small long attempts with a strict stop loss. If this zone fails, deeper downside may unfold.
📚 Educational Note: Gap downs often create panic selling, but supports like the Buyer’s Zone provide opportunity for sharp intraday reversals. Focus on confirmation before entering.
💡 Risk Management Tips for Options Traders :
❌ Avoid trading inside the No Trade Zone (25,190 – 25,261) to prevent whipsaws.
⏳ Wait for the first 15–30 minutes to let the market settle before entering trades.
📌 Use ATM or slightly ITM options for better risk-reward during directional moves.
🔒 Always keep stop-losses in place and never risk more than 2% of trading capital per trade.
🛡️ Consider spreads (Bull Call / Bear Put) on volatile days to minimize premium erosion.
✅ Summary & Conclusion :
A Gap Up above 25,261 can extend toward 25,365 and the Profit Booking Zone, but requires confirmation.
A Flat Opening inside 25,190 – 25,261 is a no-trade area; wait for breakout or breakdown.
A Gap Down below 25,120 may test 24,996 and the Buyer’s Support Zone (24,861 – 24,901).
The focus should remain on respecting key levels, avoiding noise, and trading only confirmed setups.
⚠️ Disclaimer : This analysis is purely for educational purposes. I am not a SEBI-registered analyst . Please consult a financial advisor or do your own research before taking trading decisions.
Nifty next plan for 24sep I would like to see the nifty to go again down to take liquidity from 25050. Then if price shows bullish sign then only i will plan bullish trade till then again nifty have same plan to short to target 25050.

Nifty: Sellers were heavy today. Volatality rising Yesterday we analyzed that NSE:NIFTY would turn bullish only if it opened above the pivot. Since it couldn’t, the index stayed bearish.
Support was at 25200, but the index couldn’t close above it.
So the calculation from here is simple:
1. If 25150 breaks, the index can drop to 25025.
2. If 25225 is crossed and sustained, then the move can extend up to 25400.
The one big negative today is that sellers’ volume was 50 million higher than buyers. For an index options trader, this is the most important piece of data.
That’s why my strategy for tomorrow will be Sell-on-Rise. I’ll short if the index gets rejected from resistance.
As for the equity segment, I’m noticing that relative strength is falling in many stocks on my watchlist. So I won’t be opening any fresh positions for now.
Industries with the highest turnover right now are Auto Parts and Pharma – intraday opportunities can be looked for in these tomorrow.
---
📊 Levels at a glance:
Support 1: 25150
Support 2: 25025
Resistance 1: 25225 (sustaining above = bullish)
Resistance 2: 25400 (upside target)
Bias: Sell-on-Rise, cautious bullish only above 25225
Sectors to watch: Auto Parts, NSE:CNXPHARMA

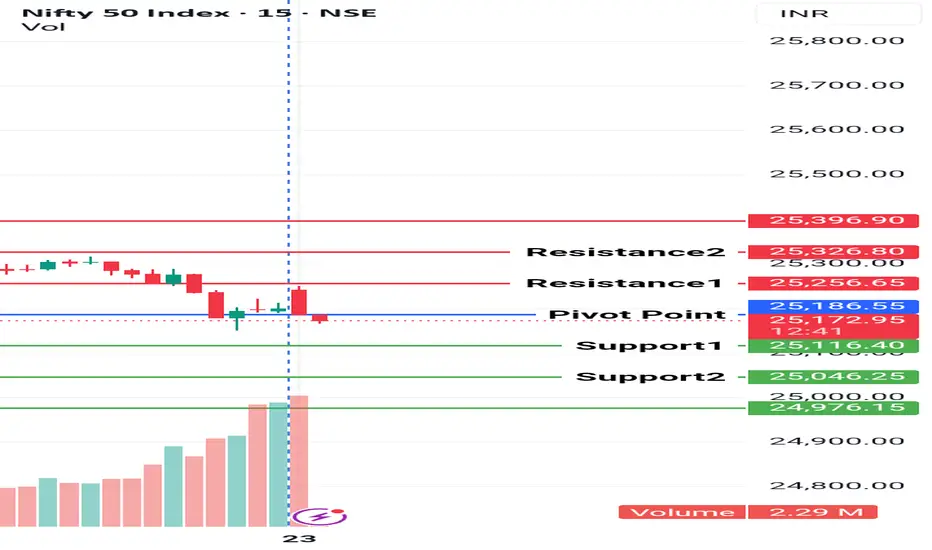
Nifty key levels for 23.09.2025NIFTY KEY LEVELS FOR 23.09.2025
RTF: 3 Minutes
If the candle stays above the pivot point, it is considered a bullish bias; if it remains below, it indicates a bearish bias. Price may reverse near Resistance 1 or Support 1. If it moves further, the next potential reversal zone is near Resistance 2 or Support 2. If these levels are also broken, we can expect the trend.
When a support or resistance level is broken, it often reverses its role; a broken resistance becomes the new support, and a broken support becomes the new resistance.
If the range (R2-S2) is narrow, the market may become volatile or trend strongly. If the range is wide, the market is more likely to remain sideways.
please like and share my idea if you find it helpful
Disclaimer
The idea is for educational purpose only..
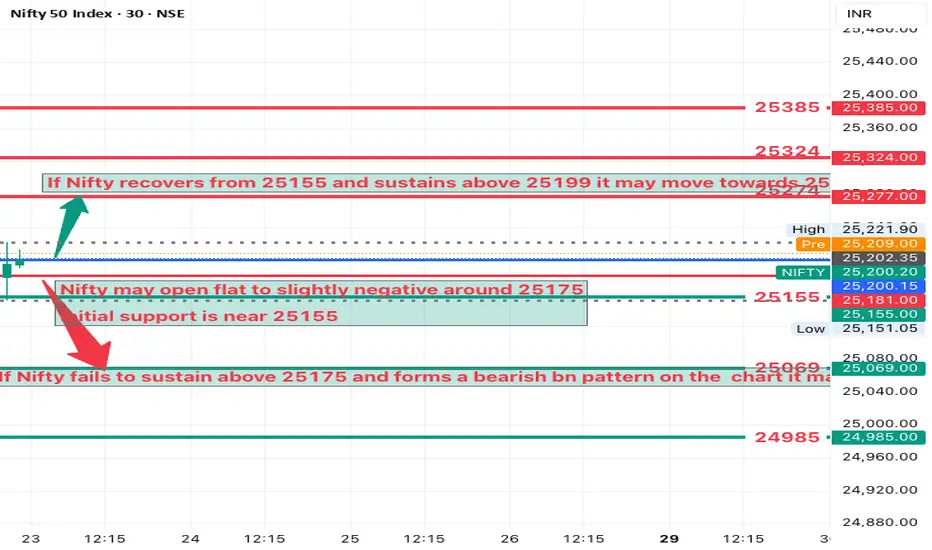
NIFTY Analysis 23 SEPTEMBER, 2025 ,Daily Morning update at 9 amSupport 25155 25069 24985
Resistance 25274 25324 25385
If Nifty holds 25155 and moves above 25199, consider buying
Target: 25274
Stop loss: just below 25155
If Nifty fails to sustain above 25175 and forms a BN pattern on chart, consider selling
Target 25103 then 25065
Stop loss just above 25175
Trade only near support and resistance levels
Watch price action on 5-minute and 15minute charts
gift for you. If Nifty holds above 25199 Buy Calls
If Nifty breaks below 25175 Buy Puts
If Nifty stays between 25155–25199 Avoid or Sell Options with hedging
#NIFTY Intraday Support and Resistance Levels - 23/09/2025For Nifty, a flat opening is expected near the 25,200 zone. On the upside, sustaining above 25,250–25,300 can trigger a bullish move toward 25,350, 25,400, and 25,450+. A breakout above 25,500 will further strengthen the trend, opening the path toward 25,650–25,750+.
On the downside, immediate support lies at 25,200–25,150. A break below this may invite selling pressure, dragging the index toward 25,100, 25,050, and 25,000-. If weakness extends further, strong support exists around 24,950–25,000.
Overall, Nifty is trading at a crucial support zone. A decisive move on either side will dictate intraday direction, so traders should wait for confirmation and manage trades with strict stop-losses.
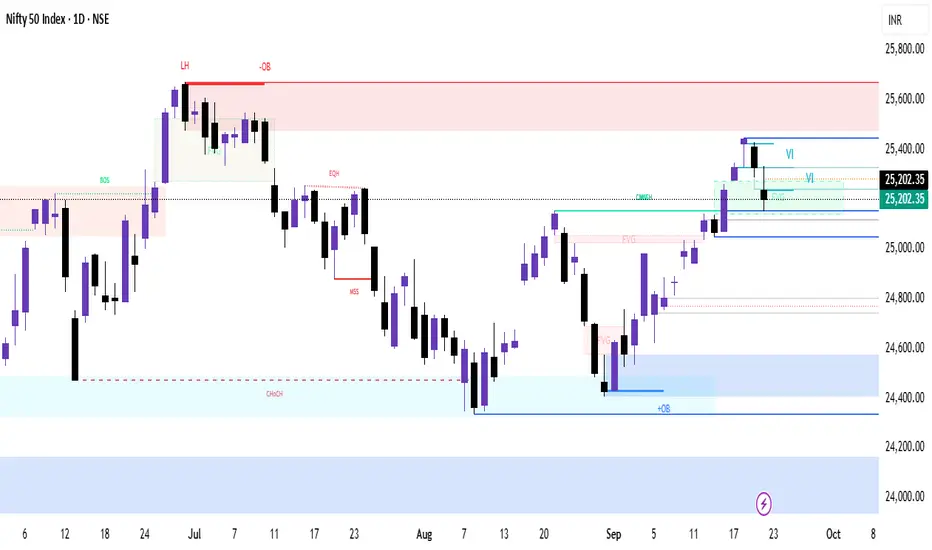
Nifty Technical Analysis – 23 September 2025🕒 1-Day Chart
Support Levels:
25,200: Immediate support; bulls need to defend this level.
25,050: Critical support; a break below this could lead to further downside.
Resistance Levels:
25,300: Immediate resistance; a breakout above this could lead to a rally.
25,450–25,500: Key resistance zone; bulls need to reclaim this for a bullish trend.
Technical Indicators:
RSI is below 60, indicating weakening momentum.
MACD shows a bearish crossover, suggesting potential downside.
Market Sentiment:
The index formed a bearish candle with a long upper shadow, indicating selling pressure at higher levels.
The index is trading below the 10-day EMA, suggesting a short-term downtrend.
🕓 4-Hour Chart
Support Levels:
25,150: Immediate support; a break below this could lead to further downside.
25,000: Strong support; bulls need to defend this level.
Resistance Levels:
25,300: Immediate resistance; a breakout above this could lead to a rally.
25,450: Key resistance; bulls need to reclaim this for a bullish trend.
Technical Indicators:
RSI is below 60, indicating weakening momentum.
MACD shows a bearish crossover, suggesting potential downside.
Market Sentiment:
The index is trading below the 10-period EMA, suggesting a short-term downtrend.
🕐 1-Hour Chart
Support Levels:
25,150: Immediate support; a break below this could lead to further downside.
25,000: Strong support; bulls need to defend this level.
Resistance Levels:
25,250: Immediate resistance; a breakout above this could lead to a rally.
25,400: Key resistance; bulls need to reclaim this for a bullish trend.
Technical Indicators:
RSI is below 60, indicating weakening momentum.
MACD shows a bearish crossover, suggesting potential downside.
Market Sentiment:
The index is trading below the 10-period EMA, suggesting a short-term downtrend.
🕒 15-Minute Chart
Support Levels:
25,150: Immediate support; a break below this could lead to further downside.
25,000: Strong support; bulls need to defend this level.
Resistance Levels:
25,250: Immediate resistance; a breakout above this could lead to a rally.
25,400: Key resistance; bulls need to reclaim this for a bullish trend.
Technical Indicators:
RSI is below 60, indicating weakening momentum.
MACD shows a bearish crossover, suggesting potential downside.
Market Sentiment:
The index is trading below the 10-period EMA, suggesting a short-term downtrend.
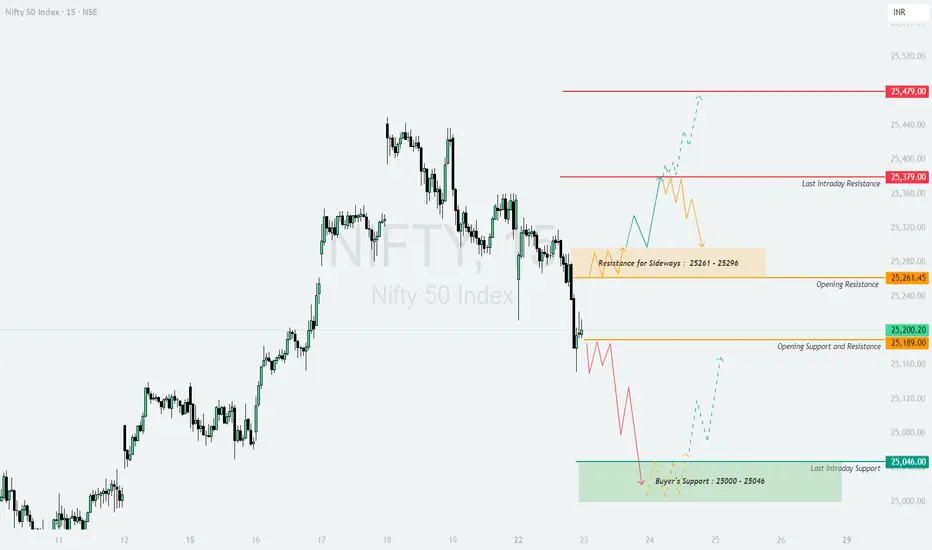
NIFTY : Trading levels and plan for 23-Sep-2025NIFTY TRADING PLAN – 23-Sep-2025
Nifty closed near 25,200, holding around the critical zone of 25,189–25,200, with multiple resistances above and strong support below.
Opening Resistance: 25,261
Sideways Resistance Zone: 25,261–25,296
Last Intraday Resistance: 25,379
Major Resistance: 25,479
Opening Support: 25,189
Last Intraday Support (Buyers’ Zone): 25,000–25,046
With a gap opening threshold of 100+ points, let’s look at the trading scenarios in detail:
🚀 Gap Up Opening (100+ points above previous close)
If Nifty opens near or above 25,300–25,320, it will enter a test zone of 25,261–25,296.
A sustained breakout above 25,296 may invite momentum buying towards 25,379, and a further extension can take it towards 25,479.
If Nifty fails to sustain above 25,296, then a pullback towards 25,261–25,200 can occur. This retracement may offer intraday shorting opportunities.
👉 Traders should avoid chasing the initial spike. Waiting for 15–30 minutes for confirmation will help avoid false breakouts.
⚖️ Flat Opening (near 25,180–25,220 zone)
In case of a flat start, the immediate play will be between 25,189 (support) and 25,261 (resistance).
A decisive move above 25,261 can attract bullish momentum towards 25,296–25,379.
Conversely, slipping below 25,189 may drag Nifty back towards 25,046, which is a critical buyer’s zone.
👉 This is the best scenario for breakout traders, as both sides provide clear risk-reward setups depending on the direction chosen by the market.
📉 Gap Down Opening (100+ points below previous close)
If Nifty opens near or below 25,100, immediate pressure will shift focus to the 25,000–25,046 buyer’s support zone.
A quick bounce from this zone can trigger a recovery rally back towards 25,189–25,261.
However, if Nifty breaks below 25,000 and sustains, it will trigger strong bearish momentum, possibly extending the fall towards 24,950–24,880 levels.
👉 In this setup, option traders can look for put buying opportunities but must keep stop-losses tight, as volatility will be high around psychological levels like 25,000.
🛡️ Risk Management & Option Trading Tips
Always allow the first 15–30 minutes for market direction to settle before taking trades.
Trade near support/resistance zones; avoid entries in the middle range.
Follow hourly candle closing for breakout confirmations.
Keep a 1:2 minimum risk-reward ratio to filter low-quality trades.
In options trading, avoid over-leveraging as premiums decay quickly on sideways days.
Respect levels like 25,000, which act as strong psychological supports/resistances.
📌 Summary & Conclusion
Above 25,296, bullish momentum may extend towards 25,379–25,479 🚀.
Flat openings will revolve around 25,189–25,261 levels, offering breakout trades ⚖️.
Below 25,000, deeper bearish pressure may emerge, targeting 24,950–24,880 📉.
Discipline, patience, and waiting for price confirmation at key levels will be crucial for success.
⚠️ Disclaimer
I am not a SEBI-registered analyst. This analysis is only for educational purposes. Please do your own research or consult a financial advisor before making any trading decisions.
Bulls seen in today's selling candle in Nifty So, NSE:NIFTY touched the final support we mentioned at 25150 and bounced back. We discussed that the dip will get bought, and that’s exactly what happened.
Now even though today's candle is red, buyers’ volume is 12 million higher than sellers. That confirms the buying is coming in.
Now, if Nifty opens above the Pivot, which is at 25228, it could turn into a bullish day since PP is at 0.10%.
The retail index is down but market breadth remains strong, so tomorrow could be a sideways day with a bullish tone intact.
Support for tomorrow will be at 25200 and resistance at 25250.
The key resistance is 25330. If that breaks, we may see sharp short covering in the coming days. That level will be the main focus if you’re trading index options.
Stocks from Auto Components and Construction industries will be on my radar tomorrow for intraday trades.
I traded NSE:MMTC , NSE:STALLION and NSE:TRAVELFOOD today. All gave really good blast.
📊 Levels at a glance:
Pivot: 25228
Support: 25200
Resistance 1: 25250
Resistance 2: 25330 (major breakout level, short covering zone)
Pivot Percentile: 0.10% (supports bullish tone)
Bias: Sideways with bullish undertone
Sectors to watch: Auto Components, Construction
That’s all for the day. Take care. Have a profitable tomorrow.

Nifty to target 25050 this weekNext target for nifty is 25050
I will look for a rejection sign from this highlighted area marked supply zone. I will look for mss or below 9ema downside closed candle for short entry.
