#NIFTY Intraday Support and Resistance Levels - 16/09/2025Nifty is expected to open on a flat note, with no major changes seen from yesterday’s levels. The market continues to hover within a defined range, suggesting that intraday traders should wait for a breakout or breakdown before taking fresh positions.
On the upside, fresh momentum can be seen if Nifty sustains above 25,000–25,050, opening the path toward 25,100, 25,150, and 25,200+. A stronger rally can only be expected once Nifty clears 25,250, which may push it further toward 25,350–25,450+.
On the downside, weakness may emerge if Nifty slips below 25,200–25,150, which could drag it toward 25,100, 25,050, and 25,000-. A further breakdown below 24,950 will intensify selling pressure, with targets at 24,850, 24,800, and 24,750-.
Overall, Nifty is in a consolidation phase, and traders should follow a wait-and-watch approach near key levels. A flat opening signals indecision, so risk management and quick profit booking will be crucial.
Niftyprediction
NIFTY : Trading levels and plan for 16-Sep-2025NIFTY TRADING PLAN – 16-Sep-2025
📊 Spot Price (Previous Close): 25,069
🔑 Key Levels from Chart:
Opening Resistance: 25,119
Last Intraday Resistance: 25,189
Major Resistance: 25,248
Opening Support Zone: 25,053 – 25,068
Last Opening Support: 25,000
Buyer’s Support / Last Intraday Support: 24,886 – 24,853
🔹 Scenario 1: Gap-Up Opening (100+ Points above 25,119)
If Nifty opens above 25,119, it directly tests the resistance zone.
A sustained move above this level may drive prices toward 25,189, which is the last intraday resistance.
If bullish momentum continues, the next upside target could be 25,248 major resistance.
However, a rejection from 25,119 – 25,189 zone may trigger a pullback toward 25,119, which will act as immediate support.
📌 Educational Note: Gap-ups near resistance zones are prone to profit-booking. Always wait for a 15-min or hourly candle confirmation before chasing longs.
🚨 Risk Tip: Avoid buying high-premium calls at market open. Prefer Bull Call Spreads (ATM + OTM combo) to limit risk.
🔹 Scenario 2: Flat Opening (Between 25,053 – 25,119)
A flat opening in this range will lead to early indecision.
If price sustains above 25,119, bulls may take control, targeting 25,189 → 25,248.
If price slips below 25,053 – 25,068 opening support zone, downside pressure may drag Nifty toward 25,000 last opening support.
Choppy moves are likely until a clear breakout is seen on either side.
📌 Educational Note: Flat opens are “trapping zones.” The first 30 minutes are crucial to filter out false moves.
🚨 Risk Tip: Keep position sizing small during flat openings. Enter larger positions only after confirmation of breakout/breakdown.
🔹 Scenario 3: Gap-Down Opening (100+ Points below 25,000)
A gap-down below 25,000 indicates weakness.
If Nifty sustains below this level, it may head toward the Buyer’s Support / Last Intraday Support zone (24,886 – 24,853).
Strong buyers may emerge here; a rebound can push prices back toward 25,000.
A breakdown below 24,853 may extend bearish momentum and trigger deeper selling.
📌 Educational Note: Gap-downs near key supports are high-volatility areas. Watch for strong wicks and reversal candles before deciding on shorts.
🚨 Risk Tip: Instead of naked puts, use Bear Put Spreads to reduce premium decay and hedge against sudden short-covering rallies.
📝 Summary & Conclusion
Bullish above: 25,119 → Targets: 25,189 / 25,248
Neutral Zone: 25,053 – 25,119 → Wait for clear breakout.
Bearish below: 25,000 → Downside targets: 24,886 / 24,853
📌 The index is at a make-or-break zone. A breakout above 25,119 can fuel bullish momentum, while a sustained breakdown below 25,000 can shift the trend bearish.
💡 Options Tip: Use ATM or ITM options for directional momentum. For uncertain markets, prefer spreads (Bull Call / Bear Put) to manage risk.
⚠️ Disclaimer: I am not a SEBI-registered analyst. This plan is prepared purely for educational purposes. Please do your own research or consult a financial advisor before making trading decisions.

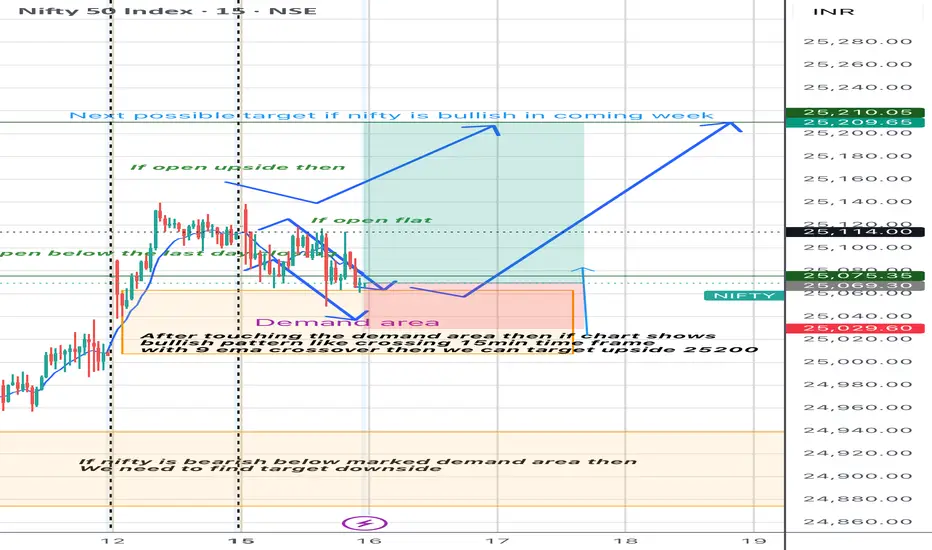
Next possible trade in nifty for 16sepNext target 25200 for this week, if it is trading above marked demand zone.
My trade is highlighted my stop loss is marked near 25030. Taking btst for this whole week to target 25200.
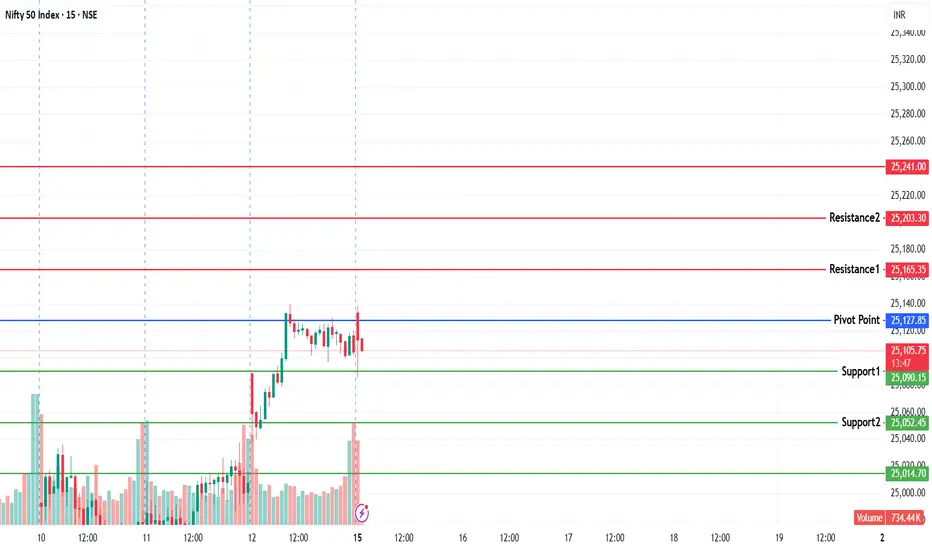
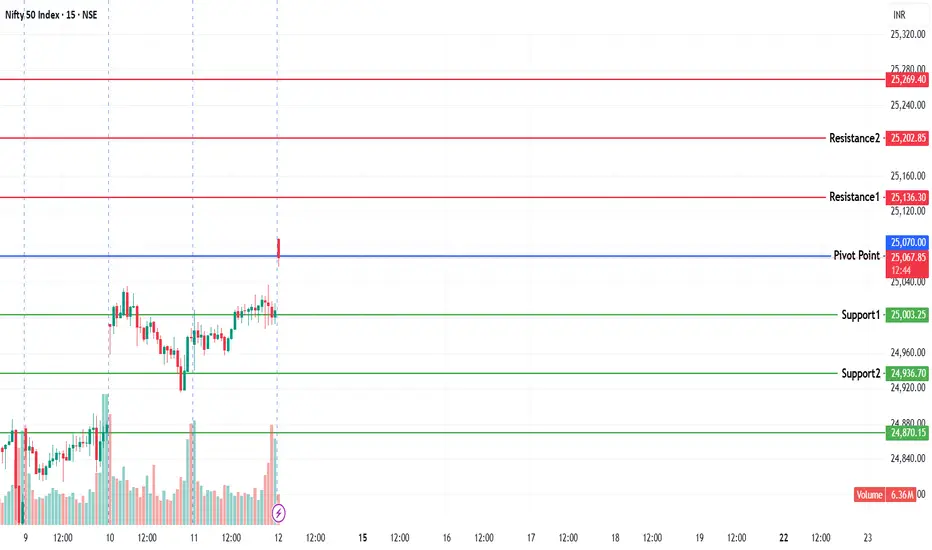
NIFTY KEY LEVELS FOR 15.09.2025NIFTY KEY LEVELS FOR 15.09.2025
RTF: 3 Minutes
If the candle stays above the pivot point, it is considered a bullish bias; if it remains below, it indicates a bearish bias. Price may reverse near Resistance 1 or Support 1. If it moves further, the next potential reversal zone is near Resistance 2 or Support 2. If these levels are also broken, we can expect the trend.
If the range(R2-S2) is narrow, the market may become volatile or trend strongly. If the range is wide, the market is more likely to remain sideways
Friends, please like and share my idea if you find it helpful
📢 Disclaimer
I am not a SEBI-registered financial adviser.
The information, views, and ideas shared here are purely for educational and informational purposes only. They are not intended as investment advice or a recommendation to buy, sell, or hold any financial instruments.
Please consult with your SEBI-registered financial advisor before making any trading or investment decisions.
Trading and investing in the stock market involves risk, and you should do your own research and analysis. You are solely responsible for any decisions made based on this research.
NIFTY Analysis 15 SEPTEMBER, 2025 ,Daily Morning update at 9 amopen flat near 25002
Initial range between 25072 to 25153
Market is in overbought zone, so risk of profit booking is high
if sustain Aaabove 25074
Buy with target 25150, 25199
Stop loss below 25050
Above 25150 sustain with bn pattern form
Buy with target 25203, 25266
Stop loss below 25120
Below 25074 break and sustain
Sell with target 25002, 24944
Stop loss above 25100
Failure near 25150 (resistance rejection)
Sell with target 25074 and may be 25020
Stop loss above 25175

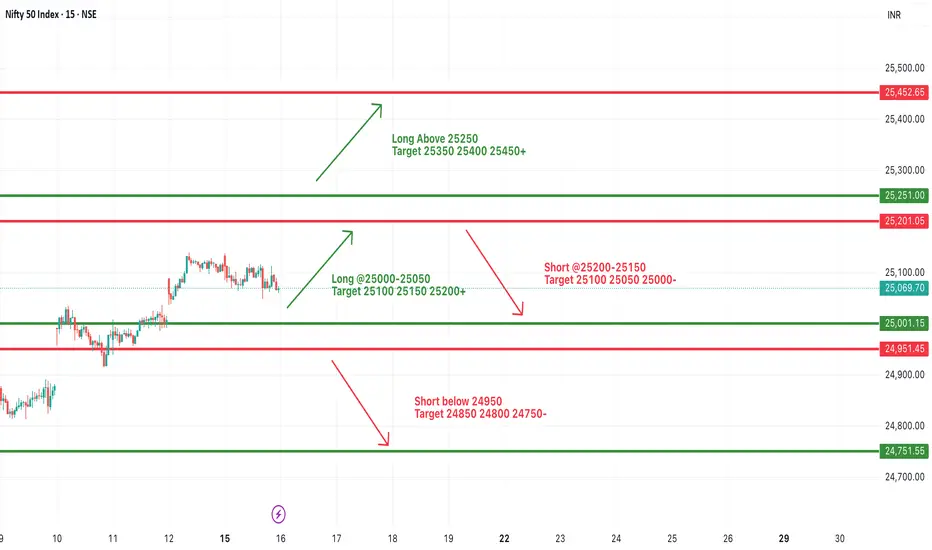
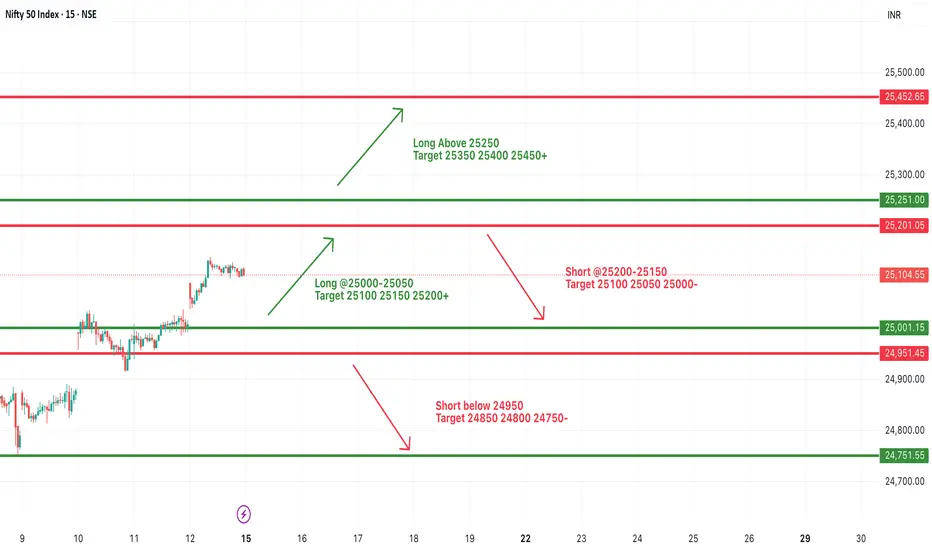
#NIFTY Intraday Support and Resistance Levels - 15/09/2025Nifty is set for a gap up opening near 25,200, signaling continuation of its strong upward momentum. The index is now trading close to a crucial resistance zone where intraday direction will be decided based on breakout or rejection.
On the upside, fresh long positions can be initiated around 25,000–25,050, with immediate targets placed at 25,100, 25,150, and 25,200+. A sustained move above 25,250 will further strengthen the bullish sentiment, paving the way for targets at 25,350, 25,400, and 25,450+.
On the downside, support is seen near 24,950. A break below this zone may trigger short positions, dragging the index toward 24,850, 24,800, and 24,750- levels. A reversal short near 25,200–25,150 is also possible if Nifty fails to sustain higher levels, with downside targets of 25,100, 25,050, and 25,000-.
Overall, the bias remains positive with a gap up opening, but traders should stay cautious near resistance zones and manage trades with strict stop-losses. The reaction around 25,200–25,250 will be key for deciding today’s trend.
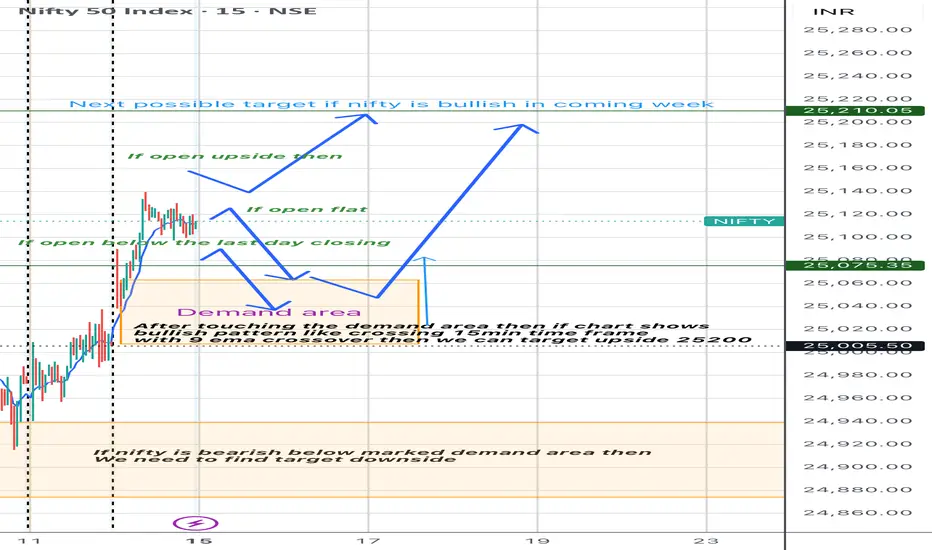
Nifty plan for 15sep2025Nifty next possible target is 25200 if nifty is bullish in the next week. If nifty comes to demand area again then i will look for bullish signs to enter in trade to target 25200.
Looking for 15min time frame 9EMA cross over closing candle.
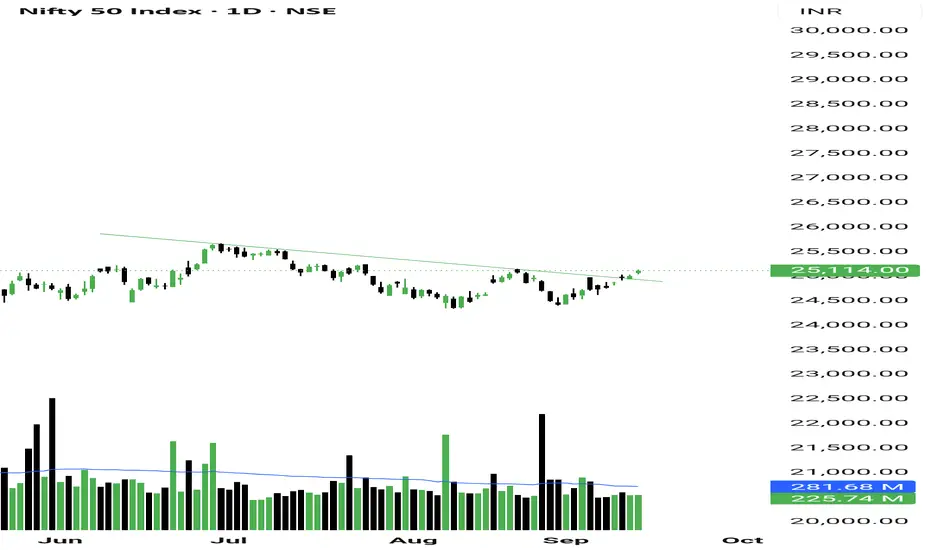
Nifty Data hints a pullback As we anticipated on Friday, NSE:NIFTY broke the 25100 resistance and also gave a close above it.
This clearly shows that strength has come back into the index and the market is getting ready for a sharp bull run in the coming days.
Let’s see what Nifty data indicates for Monday:
1. Nifty Pivot up – 25097
2. Retail index up
3. Momentum up
4. Volume – Negative (-9.5 million)
5. Market breadth – Positive
6. Close above resistance
7. Trend up
8. Momentum up
So, 7 points are positive and only 1 is negative. But volume is a big indicator, so its negativity matters. On top of that, weekly volume also shows sellers’ volume is 18 million higher than buyers.
Therefore, the view for tomorrow = bullish with a pullback.
Meaning, if sellers’ volume reflects tomorrow, we will buy at support which is at 24980.
But if 25155 breaks, then a sharp move till 25250 can come because PP is at 0.07%.
Overall, tomorrow’s move will set the direction for the coming week.
For next week, the financial sector will remain in trend and by Tuesday the telecom sector is also likely to join the rally.
📊 Levels at a glance:
Nifty Pivot: 25097
Support: 24980
Resistance: 25155
Target: 25250+
Pivot Percentile: 0.07% (sharp move hint)
Bias: Bullish with pullback probability
Sectors on radar: NSE:CNXFINANCE , Telecom
That’s all for today. Take care and have a profitable tomorrow.
NIFTY KEY LEVELS FOR 12.09.2025NIFTY KEY LEVELS FOR 12.09.2025
RTF: 3 Minutes
If the candle stays above the pivot point, it is considered a bullish bias; if it remains below, it indicates a bearish bias. Price may reverse near Resistance 1 or Support 1. If it moves further, the next potential reversal zone is near Resistance 2 or Support 2. If these levels are also broken, we can expect the trend.
If the range(R2-S2) is narrow, the market may become volatile or trend strongly. If the range is wide, the market is more likely to remain sideways
📢 Disclaimer
I am not a SEBI-registered financial adviser.
The information, views, and ideas shared here are purely for educational and informational purposes only. They are not intended as investment advice or a recommendation to buy, sell, or hold any financial instruments.
Please consult with your SEBI-registered financial advisor before making any trading or investment decisions.
Trading and investing in the stock market involves risk, and you should do your own research and analysis. You are solely responsible for any decisions made based on this research.
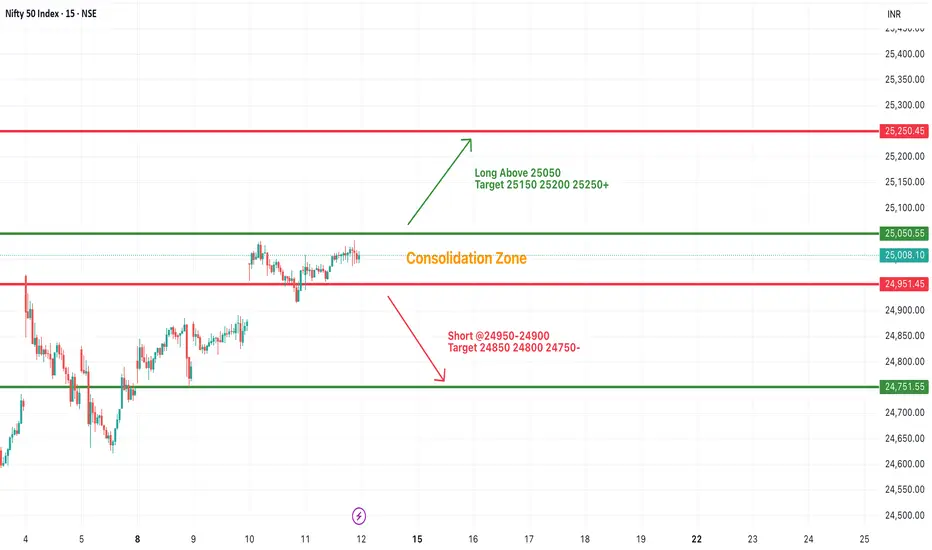
#NIFTY Intraday Support and Resistance Levels - 12/09/2025Nifty is likely to witness a gap up opening today, carrying forward the positive momentum from the previous session. Interestingly, there are no major changes in yesterday’s levels, which indicates the market is still trading within a consolidation zone.
On the upside, a sustained move above 25,050 can trigger a rally toward 25,150, 25,200, and 25,250+ levels. A breakout from this consolidation could add strength to the bulls and open the path for higher targets in the coming sessions.
On the downside, immediate support is placed around 24,950–24,900. If Nifty slips below this zone, short positions may get active, leading to a decline toward 24,850, 24,800, and 24,750 levels.
Overall, the structure remains balanced, and the market awaits a clear breakout above or below the consolidation zone for directional clarity. Traders should stay cautious and align their intraday trades with these crucial levels, keeping strict stop-losses in place.
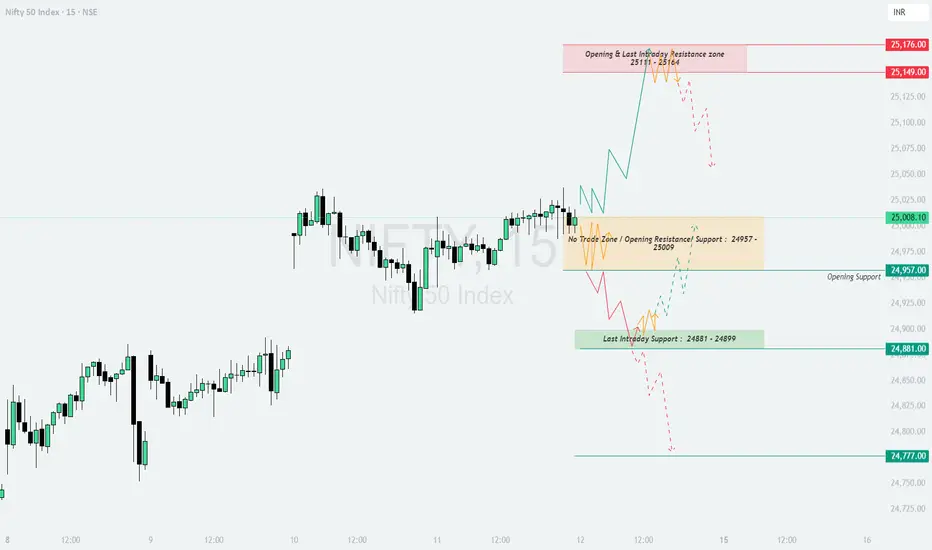
NIFTY : Trading levels and plan for 12-Sep-2025NIFTY TRADING PLAN – 12-Sep-2025
📈 Current Spot: 25,008
🔑 Key Levels to Watch:
Opening & Last Intraday Resistance Zone: 25,111 – 25,124
Intermediate Resistance: 25,176
No Trade Zone / Neutral Area: 24,957 – 25,009
Opening Support: 24,957
Last Intraday Support: 24,881 – 24,899
Major Support: 24,777
🔹 Scenario 1: Gap-Up Opening (100+ Points above 25,108)
If Nifty opens above 25,108, it will directly test the Resistance Zone 25,111 – 25,124 .
Sustaining above this zone with strong momentum can extend the rally toward 25,176, which will be a crucial profit-booking zone.
Failure to hold above 25,111 – 25,124 may trigger a pullback back into the No Trade Zone (25,009 – 24,957).
📌 Educational Insight: Large gap-ups near resistance often trap late buyers. Smart traders wait for confirmation of strength above resistance before entering long trades.
🚨 Risk Tip: In case of a failed breakout, switch to defensive mode and avoid averaging calls. Focus on reversals toward support zones for better entries.
🔹 Scenario 2: Flat Opening (Between 24,957 – 25,009)
If Nifty opens flat in the No Trade Zone, wait for a breakout or breakdown to confirm direction.
A breakout above 25,009 opens the door to test 25,111 – 25,124 resistance, and eventually 25,176 if strength persists.
A breakdown below 24,957 will shift focus to 24,881 – 24,899, where buyers may attempt to defend.
📌 Educational Insight: Sideways openings are best handled with patience. Overtrading in the “No Trade Zone” often results in whipsaws.
🚨 Risk Tip: Use smaller position sizes and strict stop-loss when trading flat openings. Better to wait for clear breakouts than to force trades.
🔹 Scenario 3: Gap-Down Opening (100+ Points below 24,908)
If Nifty opens below 24,908, it will put pressure on the Last Intraday Support Zone (24,881 – 24,899).
Breaking below this zone decisively can drag prices toward the next strong support at 24,777.
If the index defends 24,881 – 24,899 and rebounds, a short-covering move back toward 24,957 – 25,009 is possible.
📌 Educational Insight: Gap-downs into strong support zones often create oversold bounces. Always look for confirmation before entering short trades.
🚨 Risk Tip: Instead of naked put buying after gap-downs, consider spreads (Bear Put Spread) to balance premium decay.
📝 Summary & Conclusion
Bullish above: 25,111 → Targets: 25,124 / 25,176
Neutral Zone: 24,957 – 25,009 (avoid overtrading)
Bearish below: 24,881 → Next support: 24,777
📌 Focus on the Resistance Zone 25,111 – 25,124 for bullish breakouts and Support Zone 24,881 – 24,899 for bearish breakdowns.
💡 Options Tip: Always align with the trend. Avoid OTM strikes in choppy zones; prefer ATM/ITM for directional moves.
⚠️ Disclaimer: I am not a SEBI-registered analyst. This plan is for educational purposes only. Please do your own analysis or consult a financial advisor before making any trading decisions.
Nifty needs a follow up move Even with such a good technical setup yesterday, NSE:NIFTY didn’t give us any sharp move. But that’s fine – if the market always moved exactly the way we wanted, then what fun would trading be?
So no complaints – we are all just students, and the market is supreme.
However, the buyers’ volume we noticed yesterday reflected today, and the market closed above 25000 with a bullish tone.
Nifty may not have given a sharp move yesterday, but today the chart made it clear – a decisive uptrend has begun. Now what we need is just a follow-up move that can break the 25100 resistance in the coming days.
Let’s see what today’s Nifty data says:
1. Retail index up
2. Trend up
3. Momentum up
4. Buyers’ volume – 22 million
5. Pivot up – 24994
6. Market breadth – Negative
7. Close above 25000 resistance
So, 6 positives and 1 negative = bullish day with a pullback probability. Support will be at 24970 tomorrow if a pullback comes.
Today liquidity was stronger in FnO stocks compared to cash, so tomorrow FnO stocks should perform better.
Sector to focus on – Pharma
📊 Levels at a glance:
Support: 24970
Resistance: 25100
Pivot: 24994
Bias: Bullish (pullback possible)
Sector Focus: Pharma
That's all for the day. Take care. Have a profitable tomorrow.

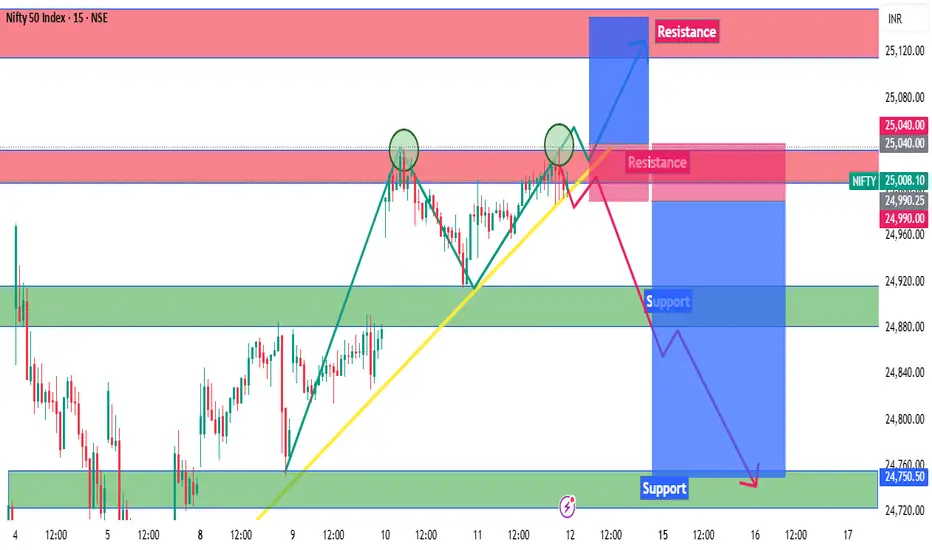
Nifty Intraday Levels : 12-Sep-25Nifty near the resistance level and formed double top and taken trend line support breakout above resistance up side move and if break trendline and reject from resistance zone may see downfall
Bearish < 24990
Bullish > 25040
Wait for Proper Rejection/Pattern :
Support : Bullish
Resistance : Bearish
Use Sl Trailing to reduce Risk
*All views for educational purpose only
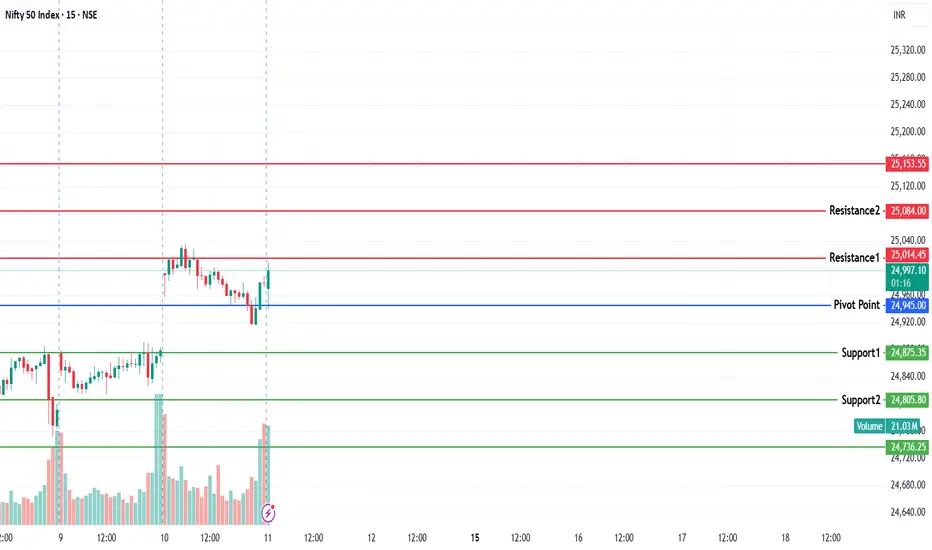
NIFTY KEY LEVELS FOR 11.09.2025NIFTY KEY LEVELS FOR 11.09.2025
RTF: 3 Minutes
If the candle stays above the pivot point, it is considered a bullish bias; if it remains below, it indicates a bearish bias. Price may reverse near Resistance 1 or Support 1. If it moves further, the next potential reversal zone is near Resistance 2 or Support 2. If these levels are also broken, we can expect the trend.
If the range(R2-S2) is narrow, the market may become volatile or trend strongly. If the range is wide, the market is more likely to remain sideways
📢 Disclaimer
I am not a SEBI-registered financial adviser.
The information, views, and ideas shared here are purely for educational and informational purposes only. They are not intended as investment advice or a recommendation to buy, sell, or hold any financial instruments.
Please consult with your SEBI-registered financial advisor before making any trading or investment decisions.
Trading and investing in the stock market involves risk, and you should do your own research and analysis. You are solely responsible for any decisions made based on this research.
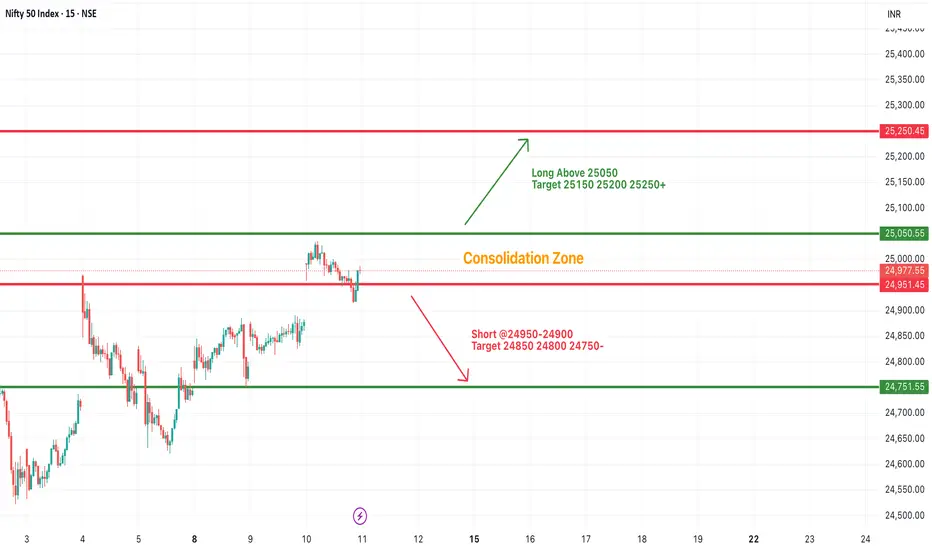
#NIFTY Intraday Support and Resistance Levels - 11/09/2025Nifty is expected to witness a slightly gap up opening, signaling stability after recent sessions of consolidation. The index is trading within a well-defined zone, and a breakout in either direction will set the tone for intraday movement.
On the upside, if Nifty sustains above the 25,050 level, it may trigger fresh buying momentum. This could push the index towards 25,150, 25,200, and 25,250+, where higher resistance is placed. A decisive close above 25,250 will strengthen the bullish sentiment and may invite further upside in the short term.
On the downside, if Nifty slips below 24,950–24,900, selling pressure may dominate the session. This can lead to a move towards 24,850, 24,800, and 24,750 levels, where immediate support lies. A break below 24,750 could extend the decline and keep the index under pressure.
Overall, Nifty remains in a consolidation phase with both bullish and bearish opportunities depending on how it reacts around the breakout levels. Traders should focus on key support and resistance levels while maintaining strict stop-losses for risk management.
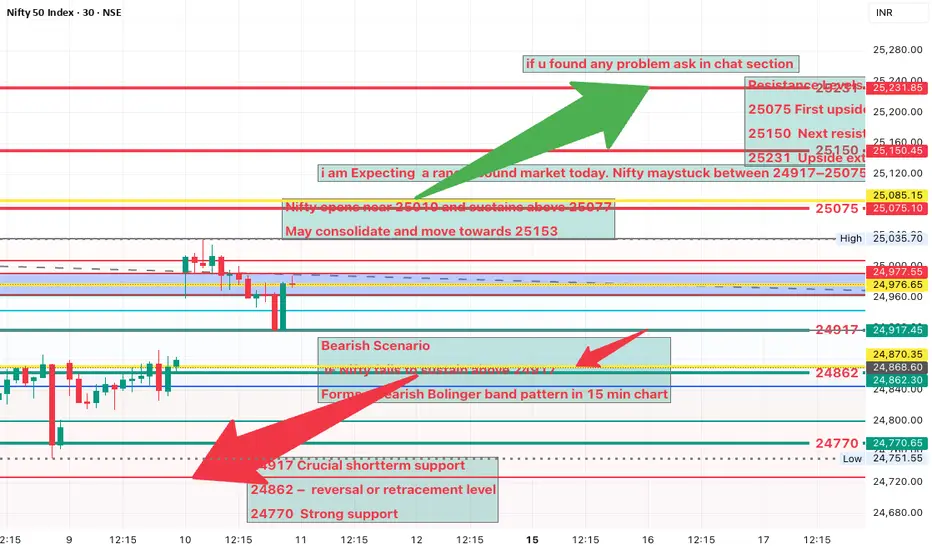
NIFTY Analysis 11 SEPTEMBER, 2025 ,Daily Morning update at 9 amResistance Levels
25075 First upside target(very important level)profit booking or short covering
25150 Next resistance if Nifty sustains above 25077
25231 Upside extension if Bank Nifty supports Nifty’s move
Nifty opens near 25010 and sustains above 25077
May consolidate and move towards 25153
Bearish Scenario
IF Nifty fails to sustain above 24917
Forms a bearish Bolinger band pattern in 15 min chart
24917 Crucial shortterm support
24862 reversal or retracement level
24770 Strong support
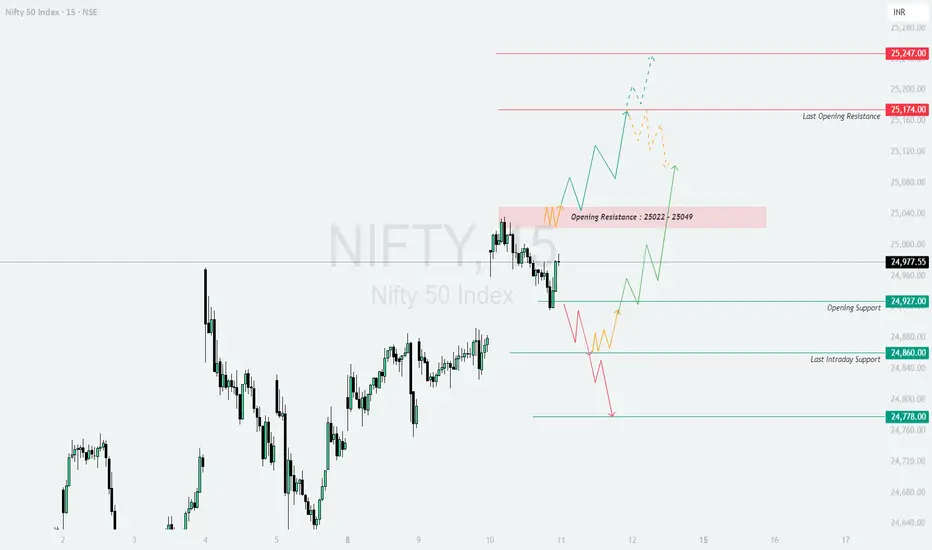
NIFTY : Trading levels and plan for 11-Sep-2025NIFTY TRADING PLAN – 11-Sep-2025
📈 Current Spot: 24,977
🔑 Key Levels:
Opening Resistance: 25,022 – 25,049
Last Opening Resistance: 25,174
Major Resistance: 25,247
Opening Support: 24,927
Last Intraday Support: 24,860
Major Support: 24,778
🔹 Scenario 1: Gap-Up Opening (100+ Points above 25,077)
If Nifty opens above 25,077, it directly enters near the resistance zone 25,022 – 25,049. Early buying pressure may push prices toward 25,174.
If momentum sustains above 25,174, a rally towards 25,247 can be expected, which will act as a strong profit-booking zone.
However, if the index fails to sustain above the opening resistance and slips below 25,049, we may see consolidation or a pullback toward 24,977 – 24,927.
📌 Educational Insight: Gap-ups near resistance often invite profit booking. Traders must confirm sustainability with at least a 15-minute candle close before entering long positions.
🚨 Risk Tip: Avoid chasing calls after a big gap-up; instead, look for retracements near support zones for better risk-reward.
🔹 Scenario 2: Flat Opening (Around 24,950 – 25,050)
If Nifty opens flat within 24,950 – 25,050, the focus should be on the Opening Resistance (25,022–25,049) and Opening Support (24,927).
A breakout above 25,049 can push prices toward 25,174, while a breakdown below 24,927 can drag the index toward 24,860.
If the market trades sideways within 24,927 – 25,049, intraday traders may prefer quick scalps with strict stop-losses.
📌 Educational Insight: Flat openings provide clarity on whether buyers or sellers dominate. Wait for a clear breakout/breakdown to avoid getting trapped in false moves.
🚨 Risk Tip: In a flat open, premiums in options decay faster. Stick to ATM/ITM options with strict SLs to protect capital.
🔹 Scenario 3: Gap-Down Opening (100+ Points below 24,877)
A gap-down below 24,877 will bring immediate focus on the key support zones 24,860 and 24,778.
Sustaining below 24,860 increases the probability of further weakness toward 24,778, where buyers may attempt a rebound.
If the index defends 24,860 – 24,778, a sharp short-covering rally toward 24,927 – 24,977 may unfold.
📌 Educational Insight: Gap-downs near strong supports often create oversold conditions, leading to short-covering bounces. Confirmation is essential before entering trades.
🚨 Risk Tip: Avoid aggressive put buying after a gap-down; instead, consider spreads (Bear Put Spread) to reduce time decay risk.
📝 Summary & Conclusion
Bullish above: 25,049 → Targets: 25,174 / 25,247
Neutral Zone: 24,927 – 25,049 (sideways chop likely)
Bearish below: 24,860 → Next support: 24,778
📌 Focus on price action around Opening Resistance (25,022–25,049) and Opening Support (24,927) for directional trades.
💡 Options Tip: Always keep a hedge or reduce position size before major resistance/support to avoid sudden reversals.
⚠️ Disclaimer: I am not a SEBI-registered analyst. This trading plan is shared purely for educational purposes. Please do your own analysis or consult your financial advisor before taking any trading decision.
A pullback with Bullish tone in Nifty So, NSE:NIFTY finally closed above 24800 and also achieved its target.
Everything went exactly as planned, which means the market is stable and the environment is positive.
Let’s check today’s Nifty checklist:
1. Buyers’ volume higher by 16 million
2. Retail index up
3. Trend up
4. Momentum up
5. Pivot up – 24974
6. Market breadth positive
7. Close below our resistance and target 25050 (negative)
That means 6 points are positive and only 1 is negative = a pullback with a bullish tone. In short, the market can dip to test 24900 support and then climb back up in the second half.
Pivot percentile is super tight – 0.01% – hence the chances of a sharp move tomorrow are even higher.
Today we saw good liquidity in both equity and equity options, so tomorrow should be a strong day for intraday traders. Stocks are likely to perform well.
Talking about sectors, momentum is expected in textiles and defense tomorrow.
📊 Levels at a glance:
Nifty Pivot: 24974
Support: 24900
Resistance: 25050
Pivot Percentile: 0.01% (hint of sharp move)
Bias: Pullback with bullish tone
Sectors on radar: Textiles, Defense
That’s all for today. Take care and have a profitable tomorrow.

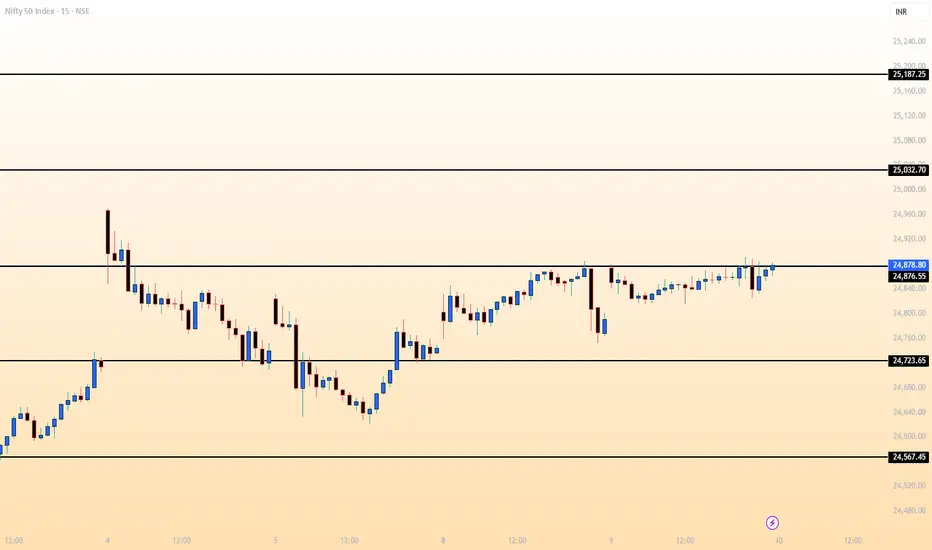
NIFTY MATHEMATICAL LEVELSThese Levels are based on purely mathematical calculations.
Validity of levels are upto expiry of current week.
How to use these levels :-
* Mark these levels on your chart.
* Safe players Can use 15 min Time Frame
* Risky Traders Can use 5 min. Time Frame
* When Candle give Breakout / Breakdown to any level we have to enter with High/Low of that breaking candle.
* Targets will be another level marked on chart
* Stop Loss will be Low/High of that Breaking Candle.
* Trail your SL with every candle.
* Avoid Big Candles as SL will be high then.
* This is one of the Best Risk Reward Setup.
For Educational purpose only
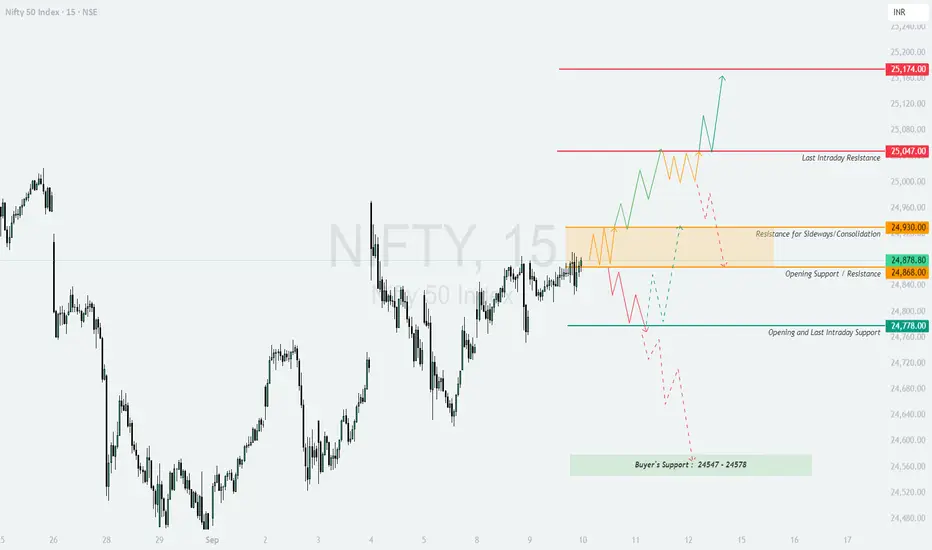
NIFTY : Trading levels and Plan for 10-Sep-2025NIFTY TRADING PLAN – 10-Sep-2025
(Levels derived from chart structure, psychological supports/resistances, and intraday flow)
📈 Gap-Up Opening (100+ points above 24,978)
If Nifty opens with a strong gap-up above 24,978, it will directly enter the resistance/consolidation zone near 24,930 – 25,047. In this case:
Early buying may face resistance around 25,047 (Last Intraday Resistance).
If price sustains above 25,047, momentum buying can extend towards 25,174, which is the next upside target.
However, if rejection occurs near 25,047, expect sideways-to-downward price action, leading back towards 24,930 – 24,868 zone.
👉 Strategy: Look for buying opportunities only if price sustains above 25,047 with volume confirmation. Otherwise, shorting on rejection near the resistance zone may provide a better risk-reward.
📊 Flat Opening (Around 24,868 – 24,930 zone)
A flat start around the Opening Support/Resistance Zone (24,868 – 24,930) indicates market indecision. This is the most crucial zone for the day.
If Nifty sustains above 24,930, strength may build toward 25,047.
If it trades below 24,868, weakness could pull prices toward 24,778 (Intraday Support).
This area will likely see sideways consolidation, so wait for a clear breakout or breakdown before taking fresh positions.
👉 Strategy: Patience is key here. Avoid aggressive trades in the first 30 minutes. Allow the market to settle and then ride the breakout either above 24,930 or below 24,868.
📉 Gap-Down Opening (100+ points below 24,778)
If Nifty opens below 24,778, it directly enters a weak territory. The next key zone will be Buyer’s Support at 24,547 – 24,578.
A sharp gap-down can trigger panic selling, extending weakness towards the Buyer’s Support Zone.
This support zone is crucial – if it holds, expect a possible bounce.
If it breaks decisively, then the market can extend deeper towards 24,480 levels.
👉 Strategy: Look for quick shorting opportunities on breakdowns below 24,778. For positional traders, monitor the 24,547 – 24,578 zone for potential reversal plays.
🛡️ Risk Management Tips for Options Traders
Do not chase option premiums after a strong gap-up or gap-down; wait for retests.
Use hourly candle close as a filter for stop-loss to avoid whipsaws.
Avoid over-leveraging; size positions according to capital and risk tolerance.
Always trade with a predefined stop-loss to protect capital.
Book partial profits at nearby resistance/support zones to lock in gains.
📌 Summary & Conclusion
Above 25,047, trend can extend bullishly towards 25,174.
Below 24,868, weakness may drag prices to 24,778, and further to 24,547 – 24,578 if broken.
Flat openings demand patience; breakout from consolidation zone will define the trend.
Watch the market’s first 30 minutes for clear signals before committing large positions.
⚠️ Disclaimer
I am not a SEBI-registered analyst . This trading plan is for educational purposes only. Please consult with your financial advisor or do your own analysis before taking any trades.
Bulls to roar tomorrow So, just like we planned, the market stayed sideways today with a bullish tone. NSE:NIFTY moved within a 90-point range and closed in the green.
1. Retail index is down
2. Pivot is up
3. Momentum is up
4. Trend is up
5. Buyers’ volume is 3 million higher than sellers
6. Market breadth is positive
That means 5 points are positive and only 1 point is negative. So, the view is positive for tomorrow.
Nifty pivot is at 24858 and pivot percentile is 0.04 – this hints that a sharp move may come tomorrow.
But remember – any long position should only be opened after 24890 is broken. Support is at 24850. Target can be 25050+.
One more reminder – the market is still in a relief rally from the previous downtrend. A short-term bullish setup is building, but until Nifty closes decisively above 25000, no long-term positions should be taken.
Today we saw good liquidity in index options, so tomorrow is a good day for index option trading. Equities will also perform well.
Momentum is building in computer parts & software, auto parts, and pharma sectors.
My recent picks performed well today:
1. NSE:ATHERENERG – up 10%+
2. NSE:HIRECT – up 5%
📊 Levels at a glance:
Nifty Pivot: 24858
Support: 24850
Resistance: 24890 (long entry after breakout)
Target: 25050+
Pivot Percentile: 0.04 (hinting sharp move)
Bias: Short-term bullish, long-term cautious until close above 25000
Sectors to watch: Computer parts & software, NSE:CNXAUTO , NSE:CNXPHARMA
That’s all for today. Take care and have a profitable tomorrow.

NIFTY Analysis 9 SEPTEMBER, 2025 ,Daily Morning update at 9 amNifty 50 is showing short covering from the oversold zone (very important)
Nifty has closed near the fake 42.6% level, signaling a possible flat opening.
Expected opening zone today near 24805
Sustaining above 24805 may lead to consolidation
First breakout zone to watch. 24860.(very important)
If sustained above 24860, next upside move 24950.
Beyond 24950, the move may extend towards 24987 and 25137
If unable to sustain above 24752, risk of downside pressure increases
On 15-min chart, watch for a bearish bb band below side
If formed, Nifty may slip towards 24699
Breaking below 24699 may extend weakness to 24643
Further breakdown could test 24560.
Focus on 4-hour ,45 minut and 15- min patterns for clarity.high,low and closing is very important of last day

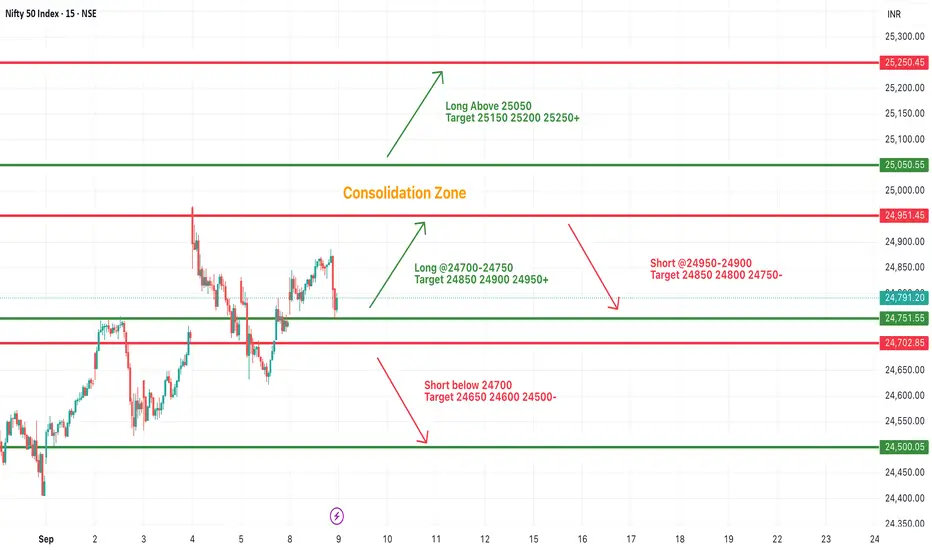
#NIFTY Intraday Support and Resistance Levels - 09/09/2025Nifty is expected to see a gap up opening near the 24,900 zone, reflecting positive sentiment in the early trade. The index continues to move within a consolidation range, and today’s levels will play a crucial role in defining intraday momentum.
On the upside, if Nifty sustains in the 24,700–24,750 range, buying interest may build up, with upside targets at 24,850, 24,900, and 24,950+. A strong breakout above the 25,050 mark will further strengthen the bullish momentum, potentially opening room for higher levels around 25,150, 25,200, and even 25,250+.
On the downside, caution is advised if Nifty slips below 24,700. In that case, a short opportunity could emerge with downside targets at 24,650, 24,600, and 24,500. Further weakness below these levels may lead to deeper correction.
Currently, Nifty is in a consolidation zone, and traders should remain patient for a clear breakout or breakdown. Directional trades can be initiated only after price sustains above 25,050 for a bullish trend or below 24,700 for a bearish move. Maintaining strict stop-loss levels will be important to manage risk effectively.