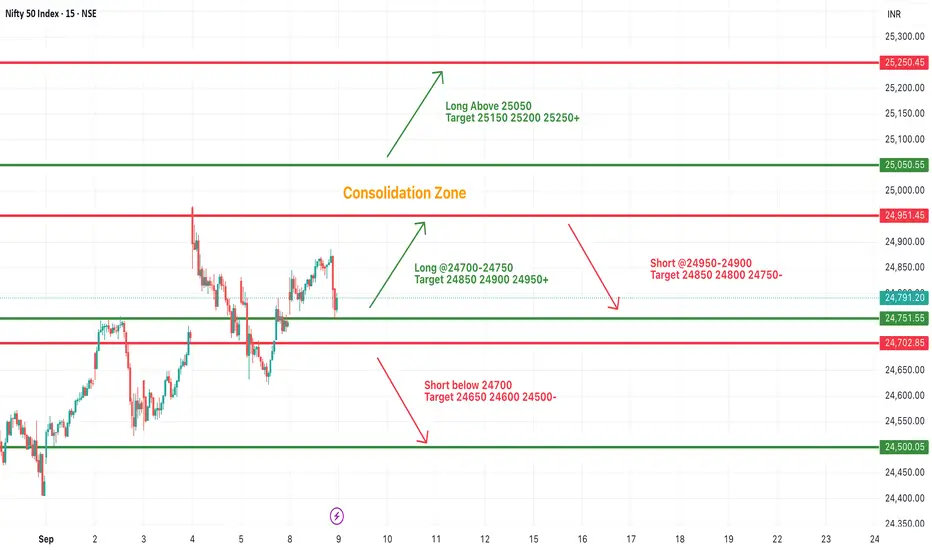
#NIFTY Intraday Support and Resistance Levels - 09/09/2025Nifty is expected to see a gap up opening near the 24,900 zone, reflecting positive sentiment in the early trade. The index continues to move within a consolidation range, and today’s levels will play a crucial role in defining intraday momentum.
On the upside, if Nifty sustains in the 24,700–24,750 range, buying interest may build up, with upside targets at 24,850, 24,900, and 24,950+. A strong breakout above the 25,050 mark will further strengthen the bullish momentum, potentially opening room for higher levels around 25,150, 25,200, and even 25,250+.
On the downside, caution is advised if Nifty slips below 24,700. In that case, a short opportunity could emerge with downside targets at 24,650, 24,600, and 24,500. Further weakness below these levels may lead to deeper correction.
Currently, Nifty is in a consolidation zone, and traders should remain patient for a clear breakout or breakdown. Directional trades can be initiated only after price sustains above 25,050 for a bullish trend or below 24,700 for a bearish move. Maintaining strict stop-loss levels will be important to manage risk effectively.
Niftyprediction
Nifty Macro View & Context Weekly Outlook: Analysts expect rangMacro View & Context
Weekly Outlook: Analysts expect range-bound trading with continued consolidation under 25,000. Nifty rebounded from ~24,400 recently, but a breakout above 25,000 remains elusive. Toby-heavy cues are looking modestly optimistic, supported by domestic macro trends and auto sector strength.
F&O Expiry Dynamics: Weekly options now expire on Tuesday, meaning Monday becomes the new "expiry eve"—a day often marked by increased spot-vol vs. thin volumes and elevated theta (time decay) impact.
Recommended strategy: With limited move expected, options plays like short strangles can capitalize on low directional movement and theta decay.
Technicals Across Timeframes
1-Day (Daily Chart)
Overall tone: Neutral-to-cautious. Price is consolidating; indicators (like RSI & MACD) are flat—no strong directional bias.
4-Hour Chart
Current structure: Sideways rectangular consolidation, roughly between 24,400–25,000.
A breakout either way could define the weekly closing trend.
1-Hour Chart
Short-term setup: 70% of moving averages (20/50/100/200) show bullish bias, although some very short-term (5/10 MA) signals remain mixed — indicating stabilization above mid-range.
Pivot analysis shows key resistance near 24,852–24,875, and support near 24,750–24,730.
15-Minute Action Plan for Tomorrow (Expiry Eve)
Time-Based Setup (09:00–15:30)
Pre-Open to First 30 Minutes
Observe initial range; likely tight consolidation given expiry eve.
Key zone: 24,750–24,850 (intraday range).
Trade Execution Rules
Long Trade:
Trigger: 15-min candle closes above 24,850 with volume support.
Entry: Next candle's open (~24,860).
Targets: 24,900 → 24,950 → 25,000.
Stop-Loss: ~24,830.
Short Trade:
Trigger: 15-min candle closes below 24,750 with confirmation.
Entry: Next open (~24,740).
Targets: 24,700 → 24,650 → 24,600.
Stop-Loss: ~24,770.
Range Day Strategy (if neither breakout triggers)
Trade within the established 24,750–24,850 range.
Small scalps: buy near 24,760, sell near 24,840; stops tight (~5-10 pts).
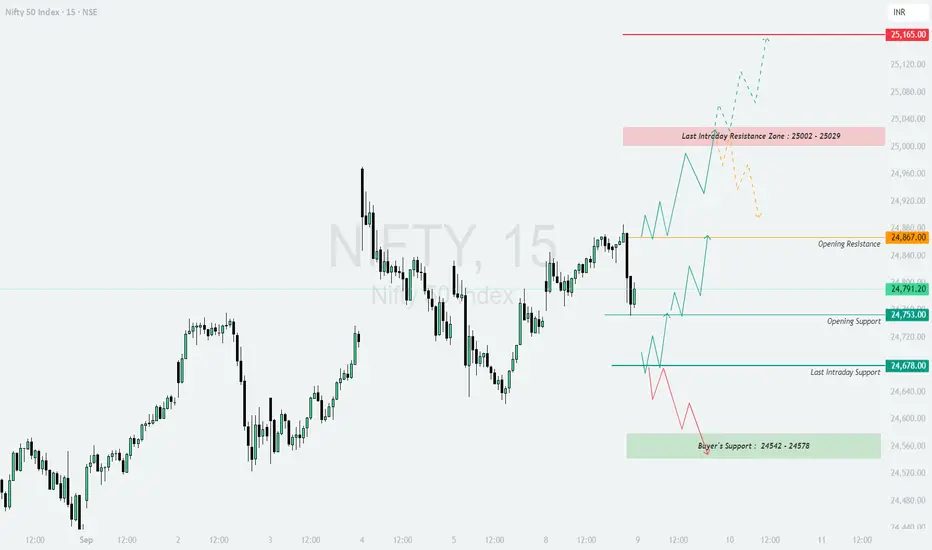
NIFTY : Trading levels and Plan for 09-Sep-2025NIFTY TRADING PLAN – 09-Sep-2025
📌 Key Levels to Watch :
Major Resistance Zone: 25,002 – 25,029
Upside Extension Resistance: 25,165
Opening Resistance: 24,867
Opening Support: 24,753
Last Intraday Support: 24,678
Buyer’s Support Zone: 24,542 – 24,578
The index is currently hovering in a consolidation phase, with clear resistance and support zones that will guide intraday moves. Price action near these levels will determine whether bulls or bears take control.
🔼 1. Gap-Up Opening (100+ points above 24,867)
If Nifty opens above the 24,867 opening resistance, it indicates strong bullish sentiment.
📌 Plan of Action :
Sustaining above 24,867 can push the index into the 25,002 – 25,029 resistance zone.
A breakout and stability above this zone may trigger a rally towards 25,165.
However, early profit booking is likely near 25,002–25,029, so traders must book partial gains and trail stop-losses.
👉 Educational Note: Gap-ups above resistance zones often trap late sellers. Patience is key — wait for at least 15–30 mins of confirmation before adding fresh longs.
➖ 2. Flat Opening (Around 24,750 – 24,820)
A flat opening provides a balanced start, allowing traders to align with early market sentiment.
📌 Plan of Action :
If Nifty sustains above 24,820, expect a move to retest 24,867, and possibly the 25,002–25,029 resistance zone.
Failure to hold 24,753 (opening support) can drag prices to 24,678.
Watch for intraday reversal candles near support zones to gauge whether buyers are defending.
👉 Educational Note: Flat openings are ideal for option writers. Buyers should wait for breakouts or breakdowns to avoid getting stuck in sideways chop.
🔽 3. Gap-Down Opening (100+ points below 24,700)
A gap-down below 24,700 can trigger nervousness among buyers and invite selling pressure.
📌 Plan of Action :
First support lies at 24,678 (last intraday support).
A breakdown below 24,678 could extend selling towards the Buyer’s Support Zone: 24,542–24,578.
If a sharp bounce occurs from this buyer’s zone, short-covering can quickly lift Nifty back to 24,753.
👉 Educational Note: Gap-downs create panic, but disciplined traders look for opportunities near strong supports. Avoid chasing shorts blindly after a big gap-down.
🛡️ Risk Management Tips for Options Traders
Always trade with a strict stop-loss on hourly closing basis.
Limit risk to 1–2% of total capital per trade .
Prefer option spreads (bull call spread / bear put spread) instead of naked calls or puts to reduce time decay impact.
Trail stop-losses as price moves in your favor — never let a winning trade turn into a loss.
Avoid overtrading in choppy zones between 24,753–24,867, as whipsaws are common there.
📌 Summary & Conclusion
🟢 Above 24,867 → Bullish continuation towards 25,002–25,029 and then 25,165 .
🟧 Flat Opening → Range-bound; strength above 24,820, weakness below 24,753 .
🔴 Below 24,700 → Bearish pressure, testing 24,678 and Buyer’s Zone 24,542–24,578 .
⚠️ Critical Zone: 25,002–25,029 (Last Intraday Resistance). Sustaining above this zone can ignite strong upside momentum.
⚠️ Disclaimer: I am not a SEBI-registered analyst. This analysis is for educational purposes only and should not be considered as financial advice. Please consult your financial advisor before making trading decisions.
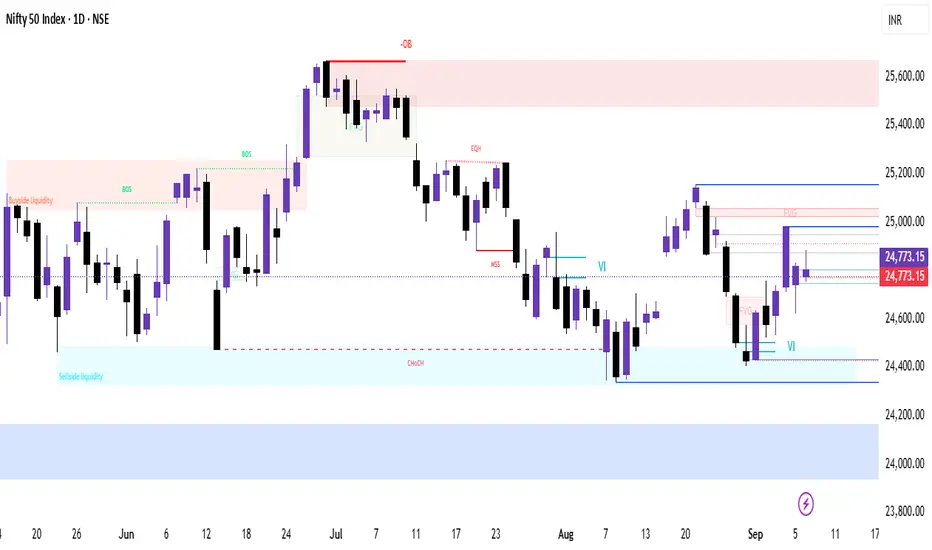
Weekly view (higher-timeframe) / Daily view for NiftyWeekly view (higher-timeframe)
Trend: Consolidation with slight bearish bias — weekly candles have shown limited follow-through above previous highs; failure to hold weekly support would open deeper correction. Use the weekly chart to judge whether weekly close holds above 24.5k
Key weekly levels to watch:
Major support (weekly): 24,150 – 23,775 (secondary targets if 24,500 fails).
Major resistance (weekly): 25,200 – 25,600 (weekly close above this turns bias bullish).
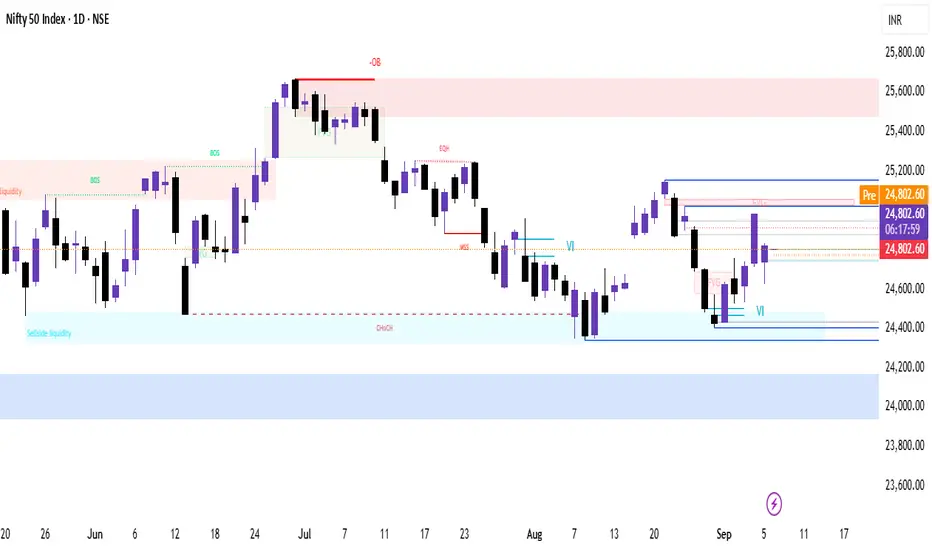
Daily view (what matters for tomorrow’s open)
Bias: Range to bearish unless price decisively gaps/opens above 24,900–25,000 and sustains. Daily momentum indicators referenced in live dashboards show neutral-to-slight-bearish readings (RSI not extremely oversold/overbought), so intraday follow-through matters.
Key intraday levels (actionable):
Immediate support: 24,500 — watch for a probe; below it increases odds of a drop to 24,150 and then 23,950–23,775.
Immediate resistance / bullish pivot: 24,900–25,200 — sustained trade above flips intraday bias toward 25,400+ (short-term targets).
Short setups / playbook for tomorrow (08-Sep-2025)
Bull scenario (momentum long)
Condition: Open/gap above 24,900 and 30-min candle closes above that level with rising volumes.
Plan: look for entries on pullback to 24,900–24,800.
Targets: 25,200 → 25,400.
Stop: close below 24,700 (or 1%–1.5% price-based SL depending on risk).
Bear scenario (momentum short)
Condition: Fails to hold 24,500 on the open or gaps down below 24,500 with follow-through.
Plan: short on retest of 24,500 after breakdown.
Targets: 24,150 → 23,950 → 23,775.
Stop: close above 24,650–24,700 (or 1%–1.5% price-based SL).
Range / neutral day (no trade if uncertain)
If price chops between 24,500–24,900, prefer to stay flat or trade tight intraday scalps with strict stops — higher chance of whipsaw.
Extra checks before market opens
Watch the first 15–30 minutes: the direction of the first 30-min candle + volume will largely determine day’s bias. If you trade, use that as confirmation. (Common intraday rule.)
Monitor macro headlines / premarket flows — anything on GST / policy / global cues may trigger gaps (recent GST news moved markets).
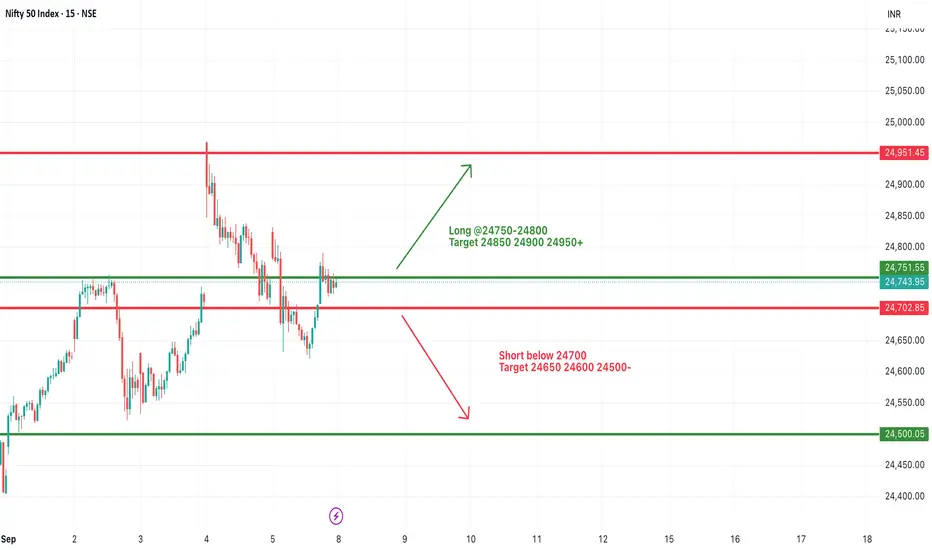
#NIFTY Intraday Support and Resistance Levels - 08/09/2025Nifty is likely to witness a flat opening today, reflecting indecisiveness among traders after recent swings. The index is trading near crucial support and resistance levels, making today’s session important for directional clarity.
On the upside, strength may build if Nifty sustains above 24,750–24,800. A successful move above this zone can trigger a rally toward 24,850, 24,900, and 24,950+. If momentum continues, it could extend further toward the 25,000 psychological mark, strengthening the bullish outlook.
On the downside, if Nifty slips below 24,700, selling pressure may intensify. A breakdown under this level could open the path toward 24,650, 24,600, and 24,500. These supports will be key for traders to watch, as failure to hold could drag the index into deeper weakness.
Overall, with a flat start on the cards, Nifty is expected to remain volatile within this range. Traders should adopt a cautious intraday approach, waiting for a clear breakout above 24,800 or a breakdown below 24,700 to initiate directional trades, while keeping strict stop-losses in place.
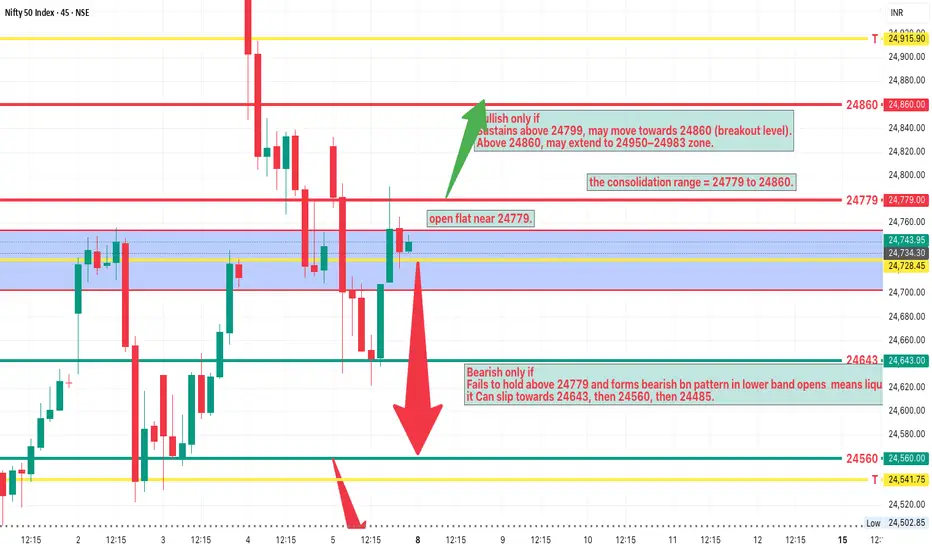
NIFTY Analysis 8 SEPTEMBER, 2025 ,Daily Morning update at 9 amNifty is showing short covering from oversold zone.
Closed below fake levels at 24779.
possible to open flat near 24779.
24779 will act as today’s important level.
Sustaining above 24799 signals bullish buyes active.
First upside level is 24860 (breakout).
Above 24860, next level is 24950 and 24983.
Failure to hold 24779 shifts buyers to bearish.
Watch for bearish bb pattern in 15m chart.
Breakdown may test 24643 first support.
Below 24643, next support is 24560.
Strong support at 24485.
Bullish trades valid only above 24779.
Bearish trades valid below 24779.
Focus on small scalping trades.
Wait for clear pattern confirmation before entry.
Bulls already positioned in the market This week the market moved exactly the way we studied in last week’s commentary.
We saw everything – Bullish moves, Sell-on-Rise, and even a Shakeout.
If you’ve been following my commentary daily, by now you must have realized that the market can be predicted with good accuracy. You can know when to trade and make money and when not to trade so you can avoid unnecessary losses.
The only condition is – you must have a strong will to learn.
If you keep thinking the market is “too difficult to understand”, it will always feel difficult. Change your perspective. Once you know what to look for, everything starts making sense right in front of your eyes.
Now let’s talk about the market.
Just as we planned, this week played out exactly the same. That means the environment is very good.
On Friday, Nifty held strong in the first half but then slipped in the second half. It couldn’t hold above 24800, which was an important resistance. Until Nifty closes above 24800, we will continue to see volatility and shakeouts.
Remember – volatility and shakeouts usually mean institutional players and big money are quietly building positions. They create this “noise” so you can’t see their footprints.
You don’t have to fear this volatility. Instead, find stocks where positions are being built. Focus on sectors showing relative strength or absorbing volatility while charts are showing demand building up.
One such sector is #Finance. I’ll be sharing good swing setups from this space in the swing group today.
Now, let’s analyze Nifty for the coming week:
1. On Friday, buyers’ volume was 6 million higher than sellers.
2. Nifty broke 24650 support and then closed above it – meaning both bulls and bears’ liquidity got absorbed = Shakeout.
3. Resistance of 24950 got broken = path cleared for upside.
4. Sentiment index closed higher compared to last week.
5. Nifty’s Pivot is at 24731 and the index already closed above it.
6. Pivot Percentile is just 0.04 = sharp momentum ahead.
7. Nifty OI buildup is positive = options liquidity is coming in.
So, overall, almost all points are positive. But the key level remains 24800. Until we get a strong closing above it, we shouldn’t build aggressive longs. Even last week, despite positive GST news, we couldn’t close above this level. That’s why Sell-on-Rise is still possible.
However, if today the index opens gap-up above 24777 and breaks 24800, then we can see a sharp move to 25025.
BankNifty also shows positive OI buildup. If it breaks 54500 resistance, then in the next 1–2 weeks we can see a move up to 56600.
For now, focus more on Financials and Auto Parts sector. I’ll share specific stocks in the swing group.
That’s it for today. Take care and have a profitable week ahead.
📊 Levels at a glance:
NSE:NIFTY Pivot: 24731
Support: 24650 / 24700
Resistance: 24800 → 25025 (if breakout)
Pivot Percentile: 0.04 (indicates sharp move)
Bias: Bullish but cautious till 24800 breaks
NSE:BANKNIFTY Support: 53500
BankNifty Resistance: 54500 → 56600 (if breakout)
BankNifty PP: 0.17% (scope of sharp move)
Sectors on Radar: Financials, Auto Parts
That's all for today. Take care. Have a profitable day ahead.

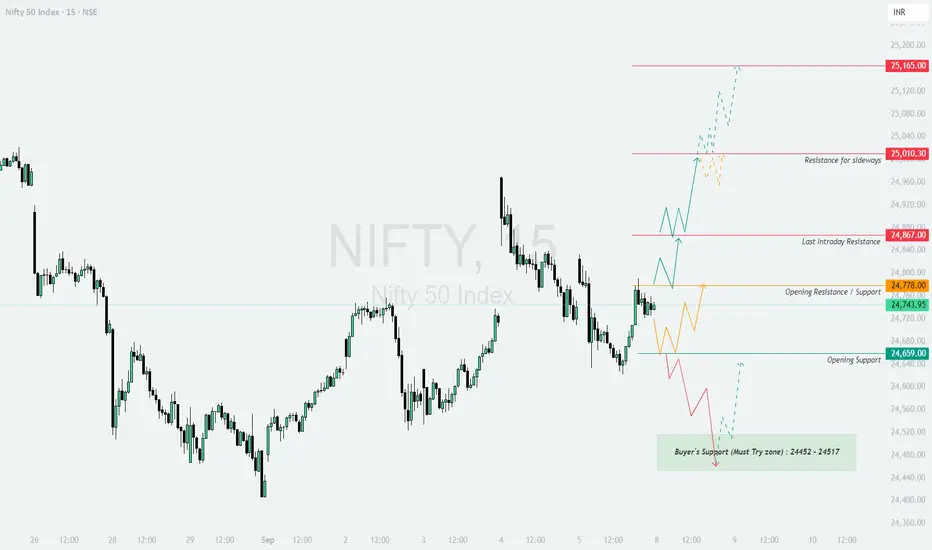
NIFTY : Trading levels and Plan for 08-Sep-2025NIFTY TRADING PLAN – 08-Sep-2025
📌 Key Levels to Watch :
Resistance for sideways: 25,010
Major Resistance: 25,165
Last Intraday Resistance: 24,867
Opening Resistance / Support: 24,778
Opening Support: 24,659
Buyer’s Support (Must Try Zone): 24,452 – 24,517
The market is trading near an inflection zone. The price reaction at these levels will guide the intraday trend.
🔼 1. Gap-Up Opening (100+ points above 24,867)
If Nifty opens strongly above 24,867, bulls will attempt to extend gains towards higher resistances.
📌 Plan of Action :
Sustaining above 24,867 will shift momentum towards 25,010.
A sideways consolidation can occur near 25,010, as it’s a critical resistance.
If Nifty manages to sustain above 25,010, the next big target is 25,165.
👉 Educational Note: Gap-ups near major resistances require confirmation. Always wait for a retest or sustained move before entering long positions.
➖ 2. Flat Opening (Around 24,720 – 24,780)
A flat start near 24,743 – 24,778 indicates indecision, with equal chances for bulls and bears.
📌 Plan of Action :
If Nifty sustains above 24,778, it can push towards 24,867.
A breakout above 24,867 strengthens the bullish momentum towards 25,010.
Failure to hold above 24,743 can drag Nifty back to 24,659 (opening support).
👉 Educational Note: Flat openings provide clarity after the first 30 minutes. Observe how price reacts around the opening resistance/support zone before taking trades.
🔽 3. Gap-Down Opening (100+ points below 24,640)
If Nifty opens with weakness below 24,640, sellers will try to dominate.
📌 Plan of Action :
Immediate test will be at 24,659; if broken, price may fall towards the buyer’s support zone 24,452 – 24,517.
A strong rebound is likely from this buyer’s support zone, as it is marked as a “must-try” level for bulls.
Sustaining below 24,452 will open deeper downside possibilities, turning the sentiment weak.
👉 Educational Note: Gap-downs often trigger panic selling. Instead of chasing the fall, wait for a retest of supports to catch a safer entry.
🛡️ Risk Management Tips for Options Traders
Always define a stop-loss based on hourly close to avoid getting trapped in volatility.
Keep position sizing small (1–2% of capital) in uncertain zones.
For gap-up/gap-down days, prefer directional option buying only after confirmation.
Use hedged strategies (like spreads) if trading near major support/resistance zones.
Book partial profits at intermediate levels to lock in gains.
📌 Summary & Conclusion
🟢 Above 24,867 → Bullish bias towards 25,010 & 25,165 .
🟧 Flat Opening → Watch 24,778 for breakout; above bullish, below weak .
🔴 Below 24,640 → Weakness towards 24,517 & 24,452 buyer’s support zone .
⚠️ Critical Zone: 24,452 – 24,517 (Buyer’s Support). A rebound here is highly probable, but if broken, weakness can accelerate.
⚠️ Disclaimer: I am not a SEBI-registered analyst. This analysis is for educational purposes only and should not be considered as financial advice. Please consult your financial advisor before trading.
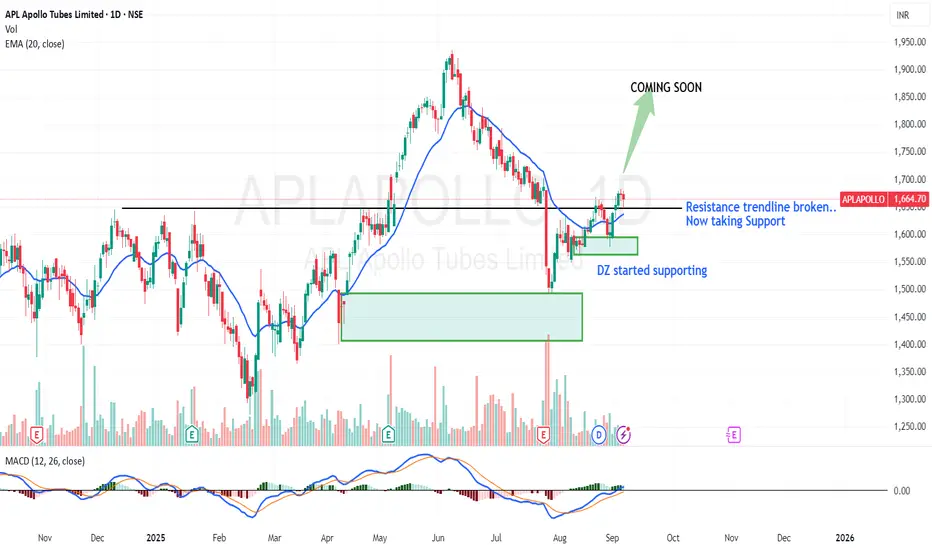
#APLAPOLLO will it be next APOLLOMICRO ??Nearby supply zones are tested and the demand zones started supporting the price as the plaayers are accumulating.. and helping the price to go up...
Resistance trendline is now broken and started supporting
Sellers are now sideways and Buyers are hero now... Just wait the director for ACTION .. will see you guys on SUCCESS PARTY
NIFTY Analysis 5 SEPTEMBER, 2025 ,daily Morning update at 9 amnifty is coming out of an oversold zone with short covering signals
chart structure is improving but not fully bullish yet
Yesterday Nifty failed to stay above 42.6% percent retracement ,based on 45 minuts
Market open flat around 24756 today
First test zone for Nifty is near 24799
The most important level for today is 24800
If Nifty sustains above 24800 bullish momentum can build
Upside targets above 24800 are 24860 and 24983
Watch out for consolidation between 24700 and 24800
If Nifty cannot hold 24701 bears may take control
A bearish bb pattern on 15 minute chart says
Downside levels to watch are 24645 and 24647
Deeper support lies at 24560 and 24485
Immediate resistance zones are 24775 and 24860
Strong resistance is at 24983
Above 24800 is bullish and targets are higher
Below 24701 turns bearish with support targets lower

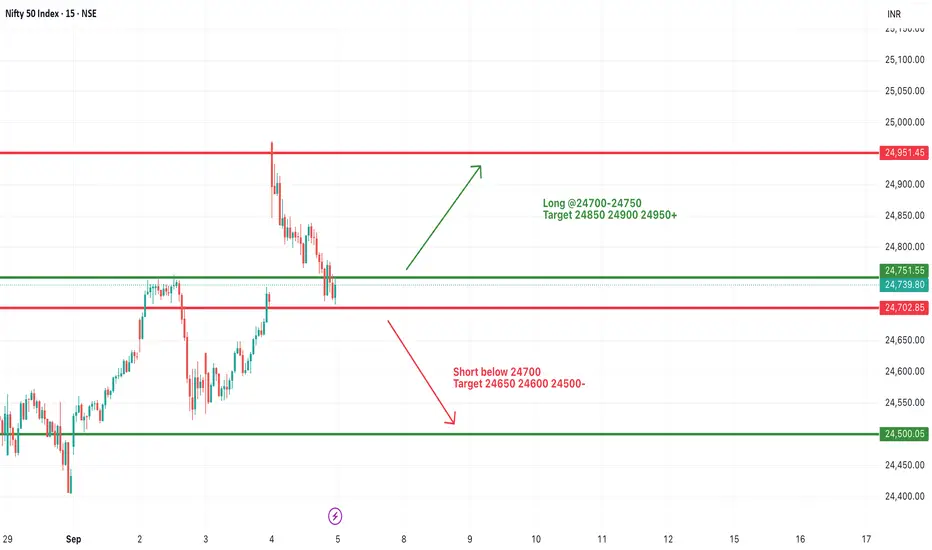
#NIFTY Intraday Support and Resistance Levels - 05/09/2025Nifty is likely to witness a slightly gap up opening, indicating a positive start to the session. The index has been consolidating in a narrow range, and today’s price action will be crucial for a directional move.
On the upside, if Nifty sustains above 24,700–24,750, it may trigger a bullish momentum. Traders can look for long opportunities in this zone with potential targets at 24,850, 24,900, and 24,950+. A breakout above 24,950 could further extend the rally, strengthening the upward bias.
On the downside, weakness may emerge if Nifty slips below the 24,700 level. A sustained move below this support could open the gates for a short opportunity, with downside targets at 24,650, 24,600, and 24,500. These levels will act as strong intraday supports and need to be watched closely.
Overall, with a slightly gap up opening, Nifty remains in a neutral-to-positive zone. A breakout above 24,750 will favor the bulls, while a fall below 24,700 may hand over control to the bears. Traders should remain cautious, trade with confirmation, and maintain proper stop-loss levels.
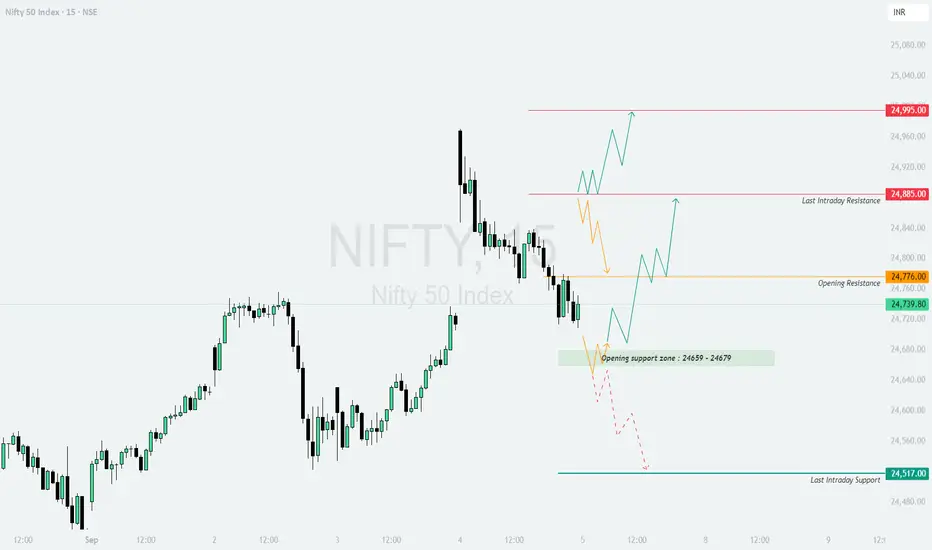
NIFTY : Trading levels and plan for 05-Sep-2025NIFTY TRADING PLAN – 05-Sep-2025
📌 Key Levels to Watch :
Opening Resistance: 24,776
Last Intraday Resistance: 24,885
Major Resistance: 24,995
Opening Support Zone: 24,659 – 24,679
Last Intraday Support: 24,517
The price action shows that Nifty is consolidating between strong support and resistance zones. The reaction around these levels will determine the day’s trend.
🔼 1. Gap-Up Opening (100+ points above 24,840)
If Nifty opens with a strong gap-up above 24,840, it will directly challenge the resistance zones.
📌 Plan of Action :
Sustaining above 24,885 (last intraday resistance) will indicate strength.
First upside target is 24,995, where profit booking could emerge.
If momentum sustains beyond 24,995, expect a breakout rally with strong bullish sentiment.
👉 Educational Note: Gap-ups near resistance require patience. Wait for confirmation candles before entering, as false breakouts are common at these levels.
➖ 2. Flat Opening (Around 24,720 – 24,780)
A flat start near the opening resistance indicates indecision and may lead to range-bound action initially.
📌 Plan of Action :
If Nifty sustains above 24,776, it can attempt to test 24,885.
A breakout above 24,885 strengthens the bullish trend towards 24,995.
Failure to hold above 24,720 can pull the index back into the support zone (24,659–24,679).
👉 Educational Note: Flat openings often provide the best opportunities as they allow traders to position based on the first 30 minutes of price action clarity.
🔽 3. Gap-Down Opening (100+ points below 24,620)
If Nifty opens below the support zone, sellers gain the upper hand.
📌 Plan of Action :
A gap-down below 24,620 will likely drag Nifty to retest 24,517 (last intraday support).
Sustaining below 24,517 may invite further downside pressure with intraday weakness.
Quick rebounds can occur, but unless Nifty reclaims 24,659, the trend remains bearish.
👉 Educational Note: Gap-downs usually trigger fear-driven moves. Avoid chasing the fall; instead, look for a retest of levels to confirm direction.
🛡️ Risk Management Tips for Options Traders
Always use stop losses on an hourly close basis to avoid false moves.
Limit exposure to 1–2% of capital per trade.
For uncertain days, consider deploying neutral strategies like straddles or strangles.
Scale out profits gradually instead of waiting for final targets.
Avoid over-leveraging; keep cash ready for adjustments.
📌 Summary & Conclusion
🟢 Above 24,885 → Bullish bias towards 24,995 and beyond .
🟧 Flat Opening (24,720 – 24,780) → Wait for a breakout above 24,776 for directional clarity .
🔴 Below 24,620 → Weakness towards 24,517 with risk of further downside .
⚠️ Critical Zone: 24,659 – 24,679 (Opening Support). Watch this level closely for intraday cues.
⚠️ Disclaimer: I am not a SEBI-registered analyst. This analysis is purely educational and should not be considered financial advice. Please consult your financial advisor before making any trading decisions.
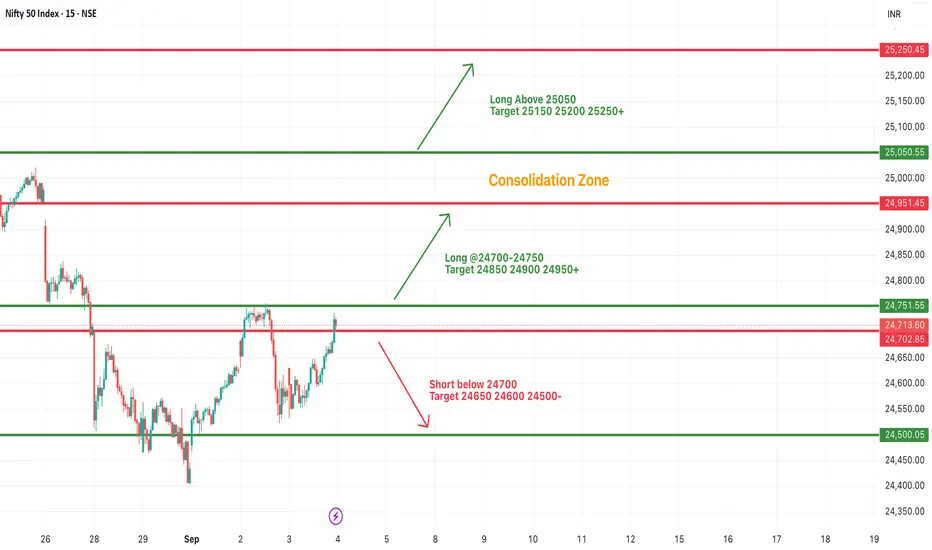
#NIFTY Intraday Support and Resistance Levels - 04/09/2025Nifty is likely to witness a gap up opening near 24,950 levels, indicating a continuation of bullish momentum from the previous sessions. The index has been consolidating in a tight range, and today’s opening could decide the next leg of the trend.
On the upside, if Nifty sustains above the 24,950–25,000 zone, it may lead to a sharp rally. In this scenario, the immediate upside targets are placed at 25,150, 25,200, and 25,250+. A breakout above 25,250 will further strengthen the bullish trend and may open the path for higher levels in the coming sessions.
On the downside, if the index fails to hold above 24,700–24,750 levels, some profit booking may drag Nifty lower. A breakdown below 24,700 could trigger weakness, with downside targets at 24,650, 24,600, and 24,500. Sustained trade below 24,500 may bring more pressure, extending the fall toward 24,350–24,300 zones.
Overall, Nifty is starting the session on a positive note with a gap up opening near 24,950, but it remains in a consolidation zone. Traders should watch for a breakout above resistance levels for bullish confirmation or a breakdown below support zones for a reversal trade. Strict stop-losses are recommended to manage volatility.
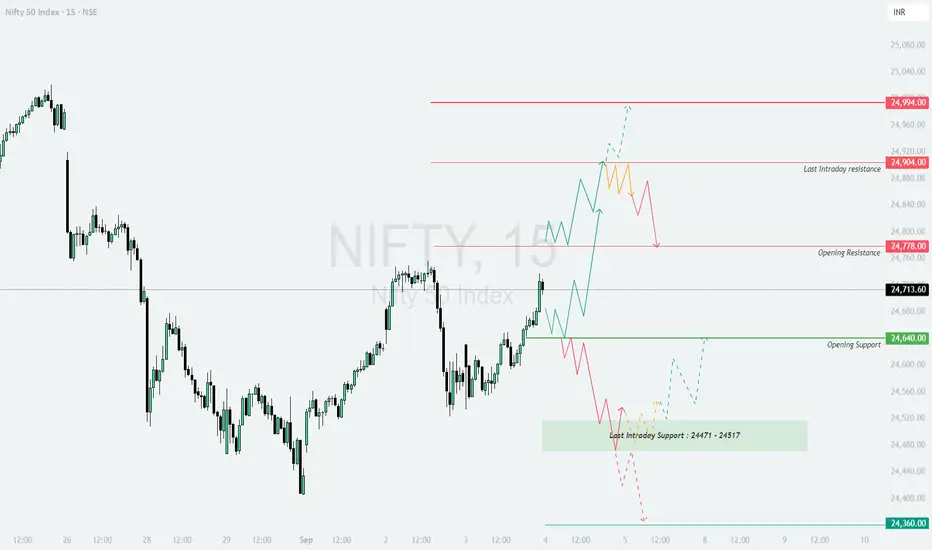
NIFTY : Trading levels and Plan for 04-Sep-2025NIFTY TRADING PLAN – 04-Sep-2025
📌 Key Levels to Watch :
Opening Resistance: 24,778
Last Intraday Resistance: 24,904
Major Resistance: 24,994
Opening Support: 24,640
Last Intraday Support Zone: 24,471 – 24,517
Buyer’s Support: 24,360
These levels will guide intraday trend direction. Let’s break down scenarios.
🔼 1. Gap-Up Opening (100+ points above 24,778)
If Nifty opens above 24,778, bulls will try to push it higher towards 24,904 (Last Intraday Resistance) and eventually test 24,994 (Major Resistance).
📌 Plan of Action :
Sustaining above 24,778 can invite upside momentum. Targets: 24,904 → 24,994.
Near 24,904, expect volatility as sellers may book profits.
If rejection comes from 24,904, price may fall back towards 24,778.
👉 Educational Note: In strong gap-ups, chasing early moves can be risky. Safer entries often come on retests of support levels.
➖ 2. Flat Opening (Around 24,640 – 24,713)
A flat start near the current zone shows balance between buyers and sellers. Price will look for a trigger from support/resistance.
📌 Plan of Action :
Holding above 24,640 (Opening Support) will keep momentum positive, opening path to 24,778 → 24,904.
If it fails to hold 24,640, expect a drift towards Last Intraday Support 24,471 – 24,517.
Avoid trades in the middle zone; clarity comes only when price breaks key levels.
👉 Educational Note: Flat openings usually consolidate in the first 30 minutes; patience helps avoid false breakouts.
🔽 3. Gap-Down Opening (100+ points below 24,640)
If Nifty opens weak below 24,640, sellers may dominate the session.
📌 Plan of Action :
A gap-down below 24,640 will likely test the 24,471 – 24,517 zone.
Breakdown below this zone could extend weakness towards 24,360 (Buyer’s Support).
If 24,360 holds, expect a technical bounce; else, further downside may unfold.
👉 Educational Note: In gap-downs, avoid aggressive longs unless there is a strong reversal confirmation.
🛡️ Risk Management Tips for Options Traders
Always place a stop loss on hourly close basis.
Risk only 1–2% of capital per trade.
Use scaling out strategy (book partial profits at first target, ride balance till next).
Avoid holding OTM options deep into expiry week to reduce time decay risk.
Use option spreads like Bull Call or Bear Put when volatility is high.
📌 Summary & Conclusion
🟢 Above 24,778 → Upside towards 24,904 – 24,994 .
🟧 Flat Opening → Watch 24,640 for support, 24,778 for breakout .
🔴 Below 24,640 → Weakness towards 24,471 – 24,517; next support 24,360 .
⚠️ Key Decision Zone: 24,640 (Opening Support) will act as the pivot.
⚠️ Disclaimer: I am not a SEBI-registered analyst. This analysis is purely for educational purposes and should not be considered investment advice. Please consult your financial advisor before trading.
Nifty key levels for 03.05.2025Nifty key levels for 03.05.2025
If candles are sustain above pivot point then bullish bias orelse bearish bias. Potential reversal zones are R1 R2 or S1 S2.
Disclaimer
This view is for educational purpose only..

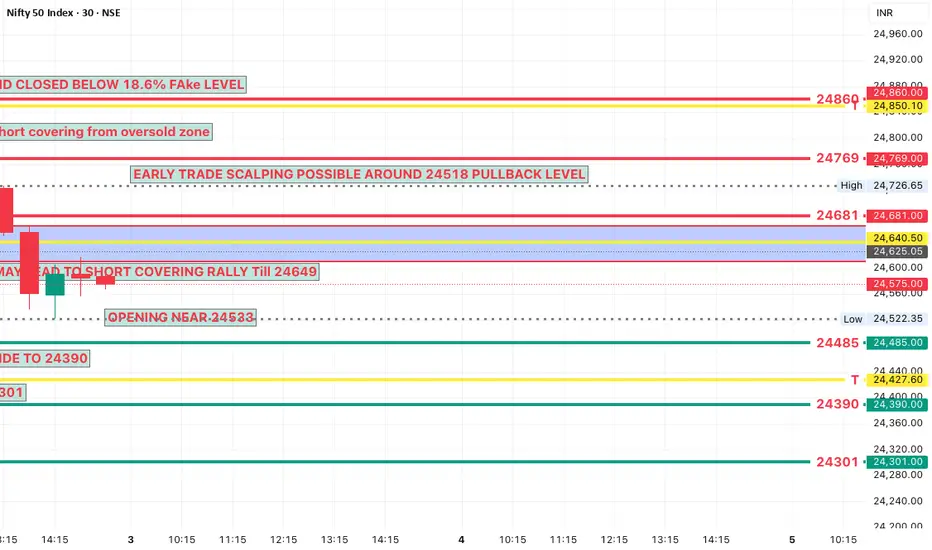
NIFTY Analysis 3 SEPTEMBER, 2025 ,Morning update at 9 am
based on the 4-hour timeframe for nifty spot
short covering from oversold zone observed
downside plan
watch 24498. if nifty fails to sustain above 24498, expect a slide to 24390.
below 24390, next major support lies at 24301.
upside plan
sustaining above 24551-52 with bn pattern formation may lead to short covering rally towards 24649.
if momentum continues, higher resistances are at 24681, 24769, 24860.
wait for clear pattern confirmation.
focus on fake levels for directional bias.
scalping opportunities
between 24485 to 24518, expect small bounces.
use quick entry and exit with strict stoploss.
always trail stoploss once first target is achieved.
exit if false breakout occurs or price fails to sustain above level.
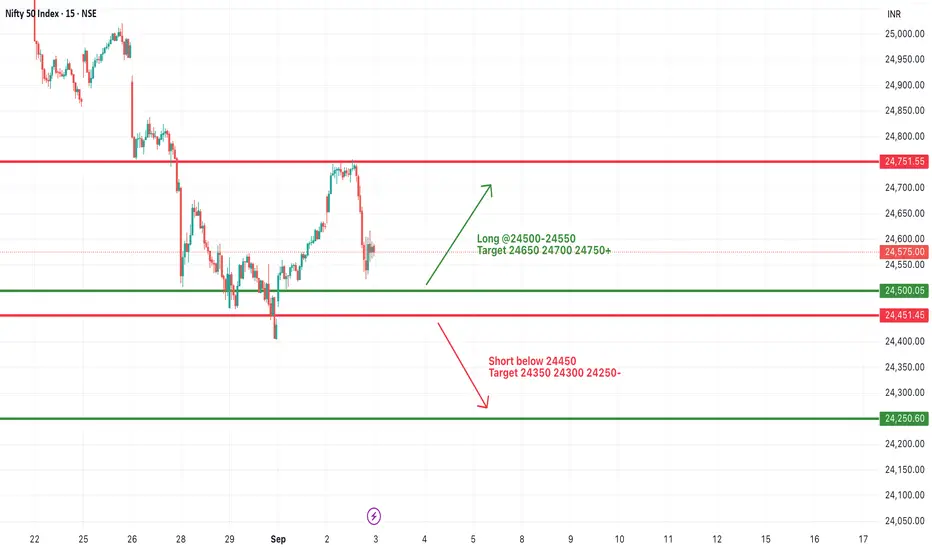
#NIFTY Intraday Support and Resistance Levels - 03/09/2025Nifty is expected to witness a slightly gap down opening today, indicating mild pressure in the index after the recent bounce. The price structure shows that the market is consolidating within a broader range, and today’s opening could set the tone for intraday moves.
On the upside, if Nifty sustains above 24,500–24,550 levels, buying momentum may return. In such a case, the index can move higher toward 24,650, 24,700, and 24,750+. A strong breakout above 24,750 will open the doors for further upward movement, potentially testing 24,850 and beyond.
On the downside, if Nifty slips below 24,450, selling pressure may drag the index lower. Key downside targets in this scenario will be 24,350, 24,300, and 24,250–24,200. Sustained weakness below 24,250 may lead to deeper cuts in the coming sessions.
Overall, today’s session is expected to start with a slightly gap down opening, keeping the index in a range-bound mood. Traders should focus on key levels to identify breakout or breakdown opportunities and maintain strict stop-losses to manage risk effectively.
NIFTY MATHEMATICAL LEVELS FOR THIS EXPIRYThese Levels are based on purely mathematical calculations.
Validity of levels are upto expiry of current week.
How to use these levels :-
* Mark these levels on your chart.
* Safe players Can use 15 min Time Frame
* Risky Traders Can use 5 min. Time Frame
* When Candle give Breakout / Breakdown to any level we have to enter with High/Low of that breaking candle.
* Targets will be another level marked on chart
* Stop Loss will be Low/High of that Breaking Candle.
* Trail your SL with every candle.
* Avoid Big Candles as SL will be high then.
* This is one of the Best Risk Reward Setup.
For Educational purpose only
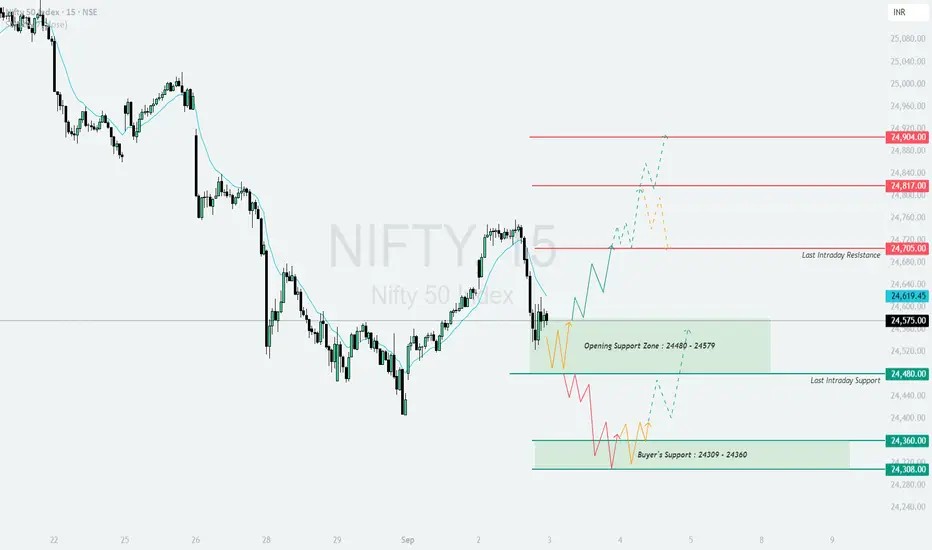
NIFTY : Trading Plan and levels for 03-Sep-2025NIFTY TRADING PLAN – 03-Sep-2025
📌 Key Levels to Watch :
Opening Support Zone: 24,486 – 24,579
Last Intraday Resistance: 24,705
Higher Resistances Above: 24,817 and 24,904
Last Intraday Support: 24,480
Buyer’s Strong Support Zone: 24,309 – 24,360
Major Lower Support: 24,308
These levels will define the intraday path. Staying disciplined around support/resistance is crucial to avoid traps.
🔼 1. Gap-Up Opening (100+ points above 24,705)
If Nifty opens with strength above the last intraday resistance, momentum could build on the upside.
📌 Plan of Action :
Sustaining above 24,705 will attract buyers targeting 24,817 – 24,904 zones.
Quick profit booking may appear near 24,817, so aggressive long traders should trail stop losses.
If Nifty opens high but fails to hold above 24,705, it may slip back to retest the Opening Support Zone (24,486 – 24,579).
👉 Educational Note: In strong gap-ups, waiting for a pullback entry offers better risk-to-reward than chasing at open.
➖ 2. Flat Opening (Around 24,486 – 24,579)
A flat start inside the Opening Support Zone calls for patience and clarity.
📌 Plan of Action :
If Nifty sustains above 24,579, upside targets become 24,705 → 24,817.
Breaking below 24,486 shifts focus to 24,480 (last intraday support) and possibly 24,360.
Avoid taking trades in the middle of the zone — wait for breakout/breakdown confirmation.
👉 Educational Note: Flat openings often lead to sideways action. Let market direction confirm before committing.
🔽 3. Gap-Down Opening (100+ points below 24,480)
If Nifty opens sharply lower, sellers may dominate initially.
📌 Plan of Action :
A gap-down below 24,480 will expose support at 24,309 – 24,360 (Buyer’s zone).
If this support holds, expect a relief bounce back toward 24,480.
If broken, the next downside target lies near 24,308, which is critical for reversal attempts.
👉 Educational Note: Gap-downs tend to trigger panic selling. Avoid buying blindly — let confirmation candles validate reversal attempts.
🛡️ Risk Management Tips for Options Traders
Always follow a strict stop loss — ideally on hourly close basis.
Risk only 1–2% of total capital on a single trade.
Book partial profits at nearby resistance/support to lock gains.
Avoid over-trading in sideways moves inside the support zone.
Use option spreads (Bull Call or Bear Put) to minimize theta decay.
📌 Summary & Conclusion
🟢 Above 24,705 → Upside targets 24,817 – 24,904 .
🟧 Flat Opening → Watch 24,486 – 24,579 zone carefully, trade only on breakout/breakdown .
🔴 Below 24,480 → Weakness towards 24,309 – 24,360 and possibly 24,308 .
⚠️ Key Battle Zone: 24,486 – 24,579 (Opening Support Zone).
⚠️ Disclaimer: I am not a SEBI-registered analyst. This analysis is purely for educational purposes and should not be considered investment advice. Please consult your financial advisor before trading.
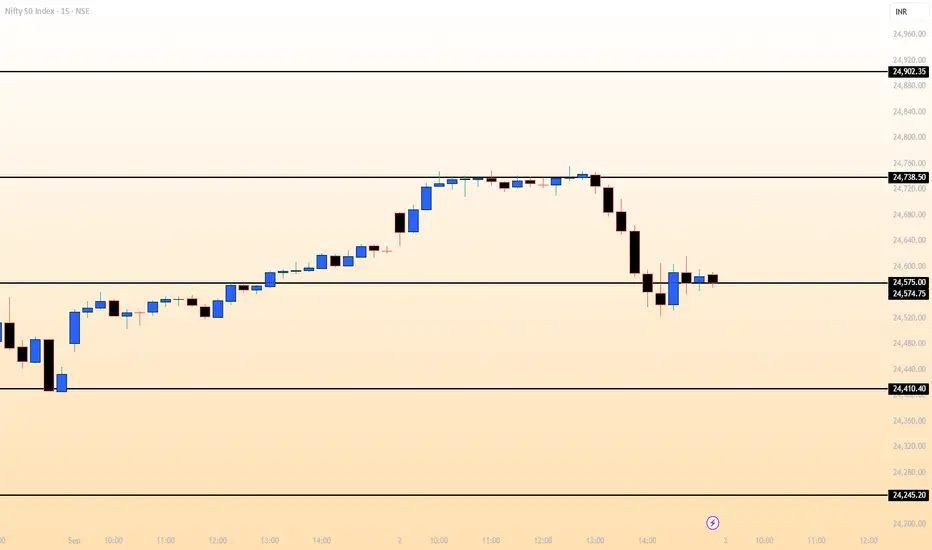
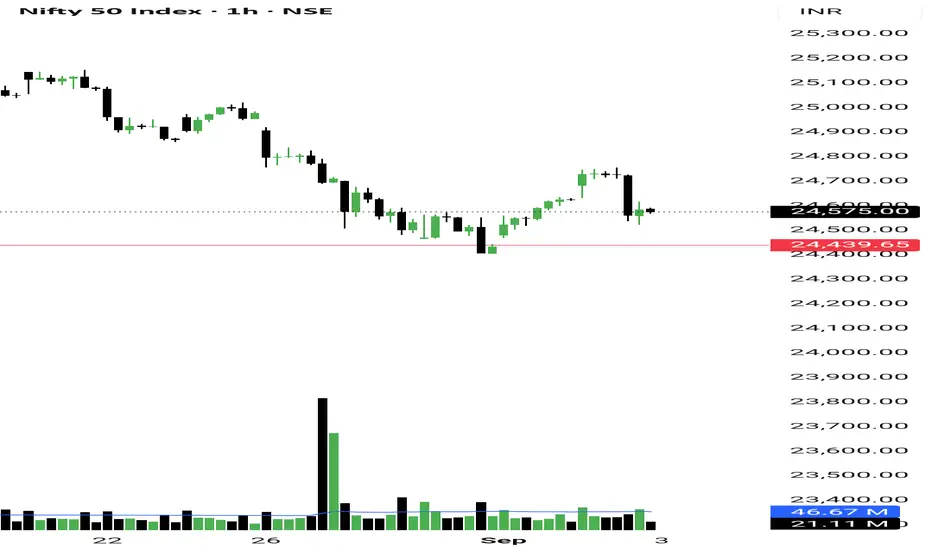
02SEP2025-Nifty 50: A Day of Consolidation and Sudden DeclineIntraday Chart Analysis & Key Data Points (as of September 2, 2025):
Opening and Early Session: The Nifty 50 opened strong, trading with a bullish bias. For the first three hours, the index was in a consolidating range, indicating a tug-of-war between buyers and sellers, but with a slight upward momentum. The intraday high was 24,756.1.
The Breakdown: A significant shift occurred around 1:30 PM. The index broke below its consolidation range, leading to a sharp and rapid decline. This move saw Nifty plummet by over 230 points from its day's high. The index closed at 24,579.6, below the psychologically important 24,600 mark.
FII/DII Activity: The market movement aligns with the FII (Foreign Institutional Investor) and DII (Domestic Institutional Investor) data.
FIIs: Were net sellers in the cash market, offloading shares worth ₹1,652.11 crore. In the derivatives segment, they were net sellers in index options, which confirms their bearish stance.
DIIs: Provided support by being net buyers, absorbing some of the selling pressure from FIIs.
Technical Levels: The sharp sell-off tested crucial support levels. The immediate support zone is identified between 24,300 and 24,200. The day's low of 24,522.35 is also a key level to watch. On the upside, the resistance zone is now around 24,650-24,700.
Derivatives Data: The Put-Call Ratio (PCR) for the day declined to 0.71, indicating a bearish sentiment. A PCR below 1.0 suggests that more puts (bearish bets) were traded than calls, pointing to a negative outlook. Additionally, the India VIX, a volatility index, also showed a slight decline.
Analysis of Conditions and Possibilities:
The market is in a "sell-on-rally" mode. The consolidation followed by a sharp breakdown suggests that institutional players were booking profits, which overpowered the initial bullish sentiment. The FIIs' bearish stance, especially in the derivatives market, is a significant red flag.
Bearish Scenario: If Nifty breaks below the 24,500 level and fails to hold the 24,300-24,250 support zone, it could trigger further selling pressure. The next possible targets on the downside could be 24,150 and potentially 24,000. This scenario is likely if global markets remain weak or if FIIs continue to be aggressive sellers.
Bullish/Consolidation Scenario: A minor bounce or consolidation cannot be ruled out. The heavy short buildup in Nifty stocks could lead to a short-covering rally. If the index manages to hold the 24,500 support and reclaims the 24,650 level, it could signal a temporary reversal. However, given the overall sentiment, any such upward move might be met with selling at higher levels.
Trading Plan for the Next Day:
Given the high volatility and negative sentiment, a cautious approach is recommended.
For Aggressive Traders (Bearish Outlook):
Entry: Look for a breakdown below the day's low of 24,522.35. A short position can be initiated with a stop-loss just above the consolidation range, for instance, around 24,650.
Target: The first target would be the 24,300-24,250 support zone. If this level is breached, the next target would be 24,150.
For Cautious Traders (Wait-and-Watch):
It's best to wait for a clear directional trend to emerge. Avoid initiating long positions until Nifty reclaims and sustains above the 24,700 resistance level.
Alternatively, you can consider a "sell on rise" strategy. If Nifty rallies towards the 24,650-24,700 zone and shows signs of weakness (e.g., bearish candlestick patterns), a short position could be initiated with a tight stop-loss.
Key Takeaways:
The market sentiment has shifted from bullish to bearish.
FIIs are the primary drivers of this bearish trend.
Crucial support levels are at 24,500 and then 24,300-24,250.
Resistance is now at 24,650-24,700.
As a retail trader, it is crucial to manage risk and avoid trading against the prevailing trend. A long position is extremely risky under current conditions.

We are in the 2nd phase in Nifty So the market moved exactly as we planned. NSE:NIFTY hit the 24750 target and then a Sell-on-Rise move dragged it lower into the close.
This is why I mentioned yesterday that my stance would stay ‘Cautiously Bullish’.
- Now, Nifty’s Pivot has shifted up to 24619.
- PP stands at 0.16%.
- Sellers’ volume is heavier than buyers by about 35 million.
If we connect these points, if Nifty opens below Pivot and breaks the 24550 support, then we may see a quick drop towards 24450. If that level also gives way, then 24250 could come into play.
But remember, individual stocks will still perform better. So stay stock-specific this and next week. Don’t chase breakouts, and avoid buying on MTF for now.
This looks like a shakeout phase — needed to bring liquidity before Bulls take control again. Market trends always move in 3 phases:
1. Accumulation
2. Manipulation
3. Distribution
Right now, we are in phase 2 (manipulation). The key is to spot where liquidity is building — that’s where you’ll find the exact bottom.
NSE:BANKNIFTY is still holding support at 23575. If that breaks, 52680 can be expected in the coming days. Resistance sits at 54029.
Sector-wise, construction and sugar look strong for tomorrow.
My Today’s trades and performance:
1. NSE:MOBIKWIK – up 18.23%
2. NSE:VIMTALABS – up 16.83%
Both hit upper circuits, so we booked full profit. Also fully booked $NSE:OLAELEC.
That’s all for today. Take care. Have a profitable tomorrow.
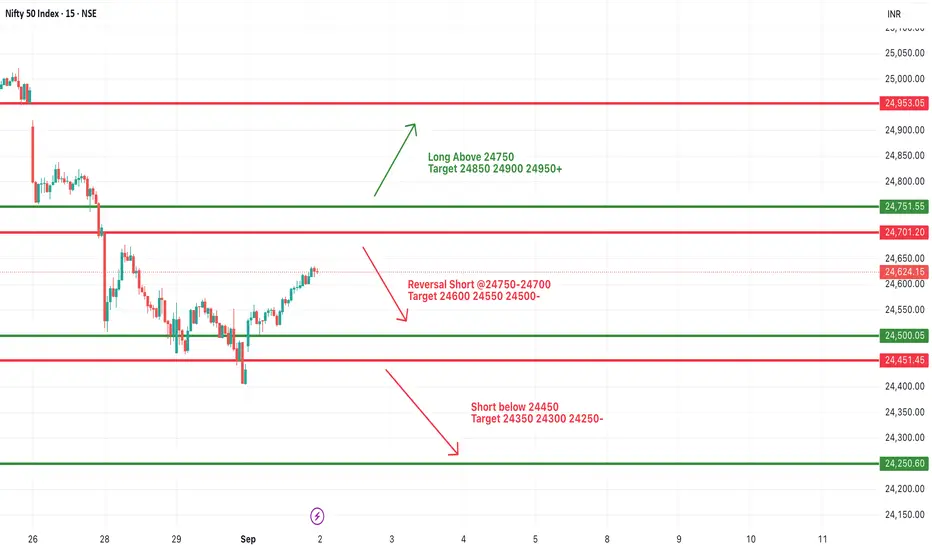
#NIFTY Intraday Support and Resistance Levels - 02/09/2025Nifty is expected to open with a gap up today, likely testing levels above 24,700. This zone will play a crucial role in deciding the intraday direction, as price action near this level may trigger either continuation or reversal moves.
On the upside, if Nifty sustains above the 24,750 mark, a fresh rally can be seen with targets at 24,850, 24,900, and 24,950+. A breakout above 24,950 could further fuel momentum, paving the way for an extended move toward 25,100 levels.
However, if Nifty faces resistance near 24,750–24,700 and fails to hold, a reversal short opportunity may open up. In that case, downside targets would be 24,600, 24,550, and 24,500. A decisive break below 24,450 would further weaken sentiment, dragging the index toward 24,350, 24,300, and 24,250.
NIFTY : Trading levels and plan for 02-Sep-2025NIFTY TRADING PLAN – 02-Sep-2025
📌 Key Levels to Watch :
Opening Support/Resistance Zone (No Trade Zone): 24,593 – 24,640
Last Resistance for Intraday: 24,744 – 24,785
Major Resistance Above: 24,993
Opening Support: 24,519
Last Intraday Support: 24,453
Major Support Below: 24,342
These levels will guide intraday directional moves. Traders must be patient around the “No Trade Zone” as it may create false signals.
🔼 1. Gap-Up Opening (100+ points above 24,640)
If Nifty opens above the Opening Resistance Zone, bulls will attempt to extend the upside move.
📌 Plan of Action :
Sustaining above 24,744 – 24,785 will open the path towards 24,993 where major profit booking can be expected.
If Nifty opens higher but fails to sustain above 24,640 and slips back into the zone, sideways consolidation or selling pressure may develop.
Conservative traders should wait for a retest of the zone before taking fresh positions.
👉 Educational Note: Gap-ups often trap late buyers. Let the first 30 minutes settle before deciding direction.
➖ 2. Flat Opening (Around 24,593 – 24,640)
If Nifty opens flat in the No Trade Zone, the best approach is to stay cautious.
📌 Plan of Action :
Avoid trades directly inside the No Trade Zone to prevent getting caught in whipsaws.
A breakout above 24,640 can extend the move towards 24,744 – 24,785.
A breakdown below 24,593 will shift focus towards 24,519 (opening support).
👉 Educational Note: Flat openings are tricky — discipline and patience are more important than quick entries.
🔽 3. Gap-Down Opening (100+ points below 24,519)
If Nifty opens lower, sellers will likely test supports quickly.
📌 Plan of Action :
A gap-down below 24,519 will expose the market to test 24,453 (last intraday support).
If this zone breaks, expect a further slide towards 24,342, where intraday pullback attempts may emerge.
Buyers should look for confirmation candles before entering reversal trades in such volatile conditions.
👉 Educational Note: Gap-downs create emotional panic. Avoid chasing puts at lows — instead, plan trades around pullbacks into resistance.
🛡️ Risk Management Tips for Options Traders
Always use a strict stop loss (preferably hourly close basis).
Risk only 1–2% of total capital on a single trade.
Avoid trading inside the No Trade Zone (24,593 – 24,640).
Consider using spreads (Bull Call/Bear Put) to control premium decay.
Exit partially at nearby resistance/support zones to secure profits.
📌 Summary & Conclusion
🟢 Above 24,785 → Upside momentum towards 24,993 possible .
🟧 Flat Opening → Avoid trades in 24,593 – 24,640 zone, wait for breakout/breakdown .
🔴 Below 24,519 → Weakness towards 24,453 and possibly 24,342 .
⚠️ Key Battle Zone: 24,593 – 24,640 (No Trade Zone).
⚠️ Disclaimer: I am not a SEBI-registered analyst. This analysis is shared purely for educational purposes and should not be considered investment advice. Please consult your financial advisor before trading.
