12 August 2025 Nifty50 brekout and Breakdown leval
📊 Key Levels & Trade View
24,690 –
Above 10m close: Short Cover Level (CE bullish momentum)
Below 10m: Hold PE in safe zone.
24,523 –
Above 10m: CE buy (entry level)
Below 10m: PE hold (risky zone).
24,423 –
Above 10m: Positive trade view.
Below 10m: Negative trade view.
24,310 –
Above Opening S1: Hold CE.
Below Opening R1: Hold PE.
24,173 (Fib 0.382 Support) –
Watch for reversal or breakdown.
24,110 –
Above 10m: CE buy level.
Below 10m: PE buy level.
23,990 –
Above 10m: CE safe zone level.
Below 10m: Unwinding zone (bearish).
23,711 (Fib 0.5 Support) –
Strong support; breakdown could extend selling.
💡 Trading Bias for Today
Bullish above 24,423 with targets 24,523 → 24,690.
Bearish below 24,310 with targets 24,173 → 24,110 → 23,990.
Avoid trading in between 24,310–24,423 unless there’s strong momentum
Niftyprediction

Accumulation has started in Nifty On Friday, NSE:NIFTY closed with selling pressure and formed a supply candle.
But here’s the interesting part – in that candle, buyers actually beat sellers by 26 million in volume. This means accumulation has already started.
The problem is, the pivot has dropped further to 24428.
If Nifty opens above this pivot, we might see a bounce, but I doubt it will sustain.
If it opens below, it’s a good chance to short with a target of 24200.
There’s also a chance we might directly see a gap-down opening near 24200. If it gaps up, don’t chase it.
Pivot percentile is 0.27, so tomorrow could be volatile. A sustainable move will only come if Nifty holds above 24500, but chances are low right now.
Support is at 24200 and then 24000.
NSE:BANKNIFTY support is at 53590.
In sectors, better to avoid pharma for now.
On Friday, I traded NSE:CUMMINSIND – it gave 5% and we’re still holding.
That’s it for now. Have a profitable tomorrow and a good week ahead.

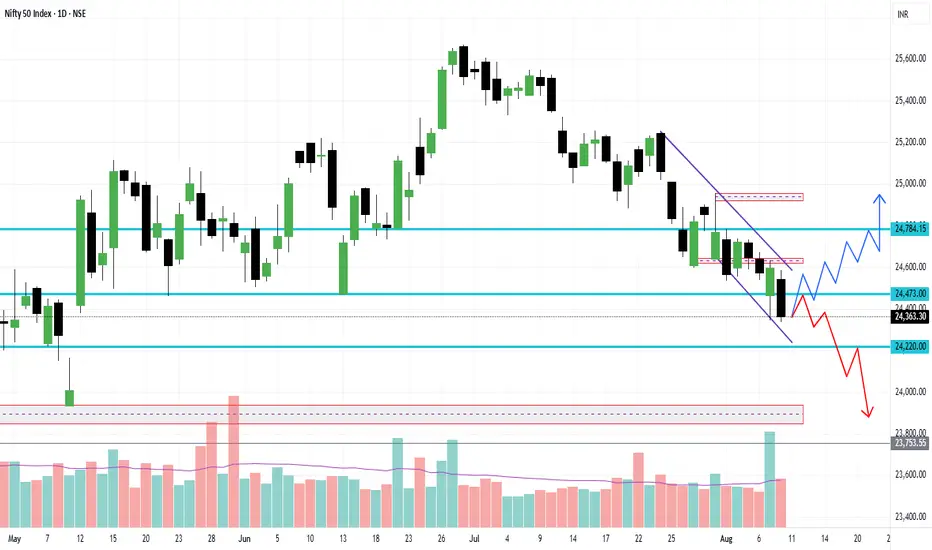
Nifty Levels and Ideas for the Next Week (11th Aug - 14 Aug )Although there was a huge sell off seen on 8th August Friday, But a recovery can be witnessed in Nifty - that too in the case if it strongly surpasses the Resistance levels which have turned stronger now - the 24480 - 24560 - 24640 levels are stacked on above the other - breaking these levels in continuation may not be possible in the current ongoing downtrend market. But nothing is impossible. In contrary some more fall can't be denied - yes but before that an upward retracement can be seen and there might be some Sell on Rise scenarios may occur, which then can take the Nifty towards 2429 and then 24200 levels too. 24150-24200 may act as a good and strong support area.
Let's see how this analysis plays out for the market in upcoming week.
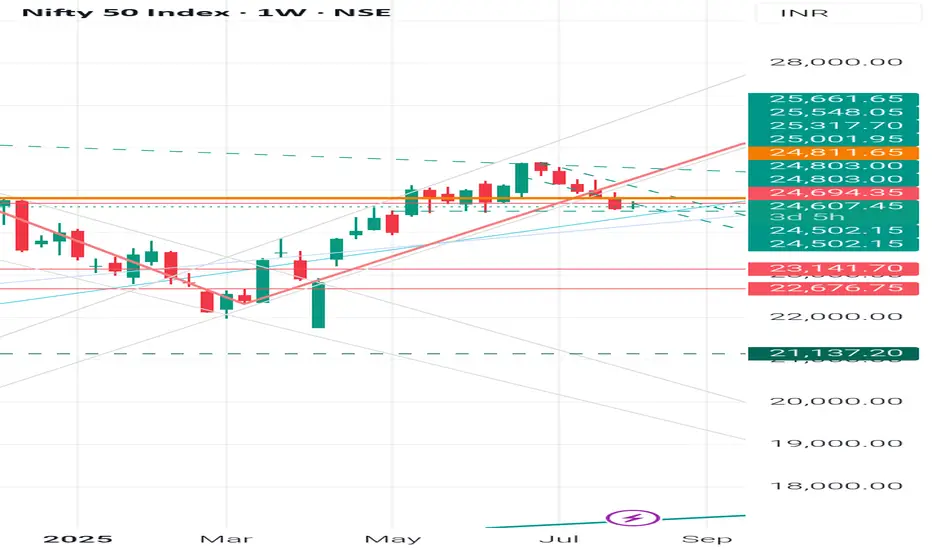
Nifty 50 Weekly Chart- Long-term bullish, short-term correctiveNifty 50 Weekly Chart – Inshort Summary
Trend: Long-term bullish, short-term corrective.
Immediate Support: ₹24,347 – ₹24,395
Key Supports Below: ₹23,141 · ₹22,676 · ₹21,137
Resistance Levels: ₹24,694 · ₹24,811 · ₹25,317 · ₹25,661
Fibonacci Zone: Strong retracement support between ₹23,100 – ₹22,600
Outlook: Possible dip toward ₹22,600–₹23,100, then rebound to ₹25,500+ if support holds.
Disclaimer -
I am not a SEBI-registered analyst or investment advisor. The views, charts, and trading ideas shared are purely for educational and informational purposes only. These do not constitute investment advice or a recommendation to buy/sell any securities. Please consult your SEBI-registered financial advisor before making any investment decisions. Trading and investing involve substantial risk — do your own research (DYOR).

#NIFTY Intraday Support and Resistance Levels - 08/08/2025Nifty is expected to open slightly gap up, indicating a positive start to the session. If the index sustains above the 24,550–24,600 zone, it could extend its upside toward 24,650, 24,700, and 24,750+. On the other hand, a rejection from higher levels, particularly near 24,750–24,700, could trigger a pullback toward 24,650, 24,600, and 24,550-.
A breakdown below 24,500 may invite further weakness, with downside targets at 24,350, 24,300, and 24,250-. Price action near the 24,550–24,600 support-turned-pivot zone will be key for intraday momentum. Traders should maintain strict stop-losses and consider partial profit booking at each milestone level.

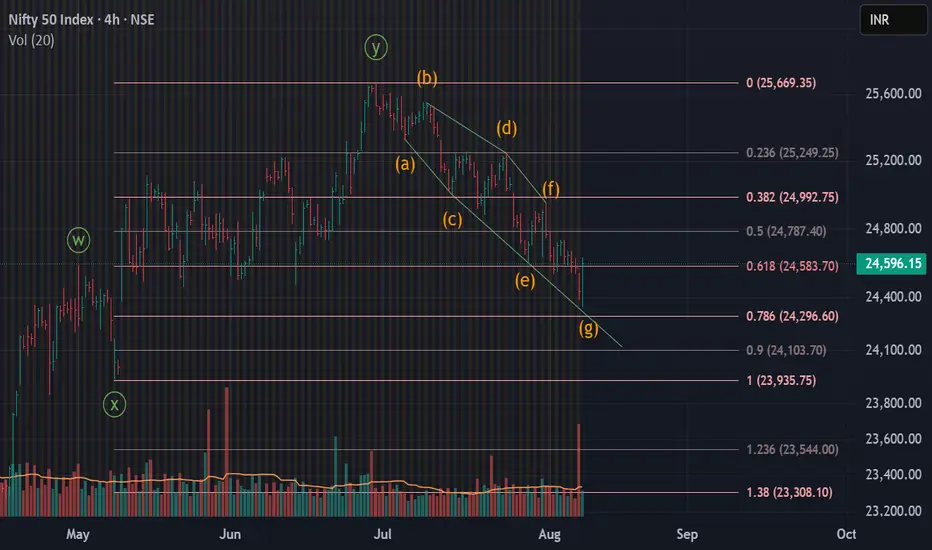
Corrective Rise UpNifty seems to completed the formation of the corrective down pattern which was a Diametric formation.
From here we could expect an up move to take place, which will most likely be a corrective rise too.
The first warning that the downside it still in progress will be price entering the range of around 24290 and a break below the level of 23900 will confirm that this wave was just the starting of a larger correction
Happy Trading!!
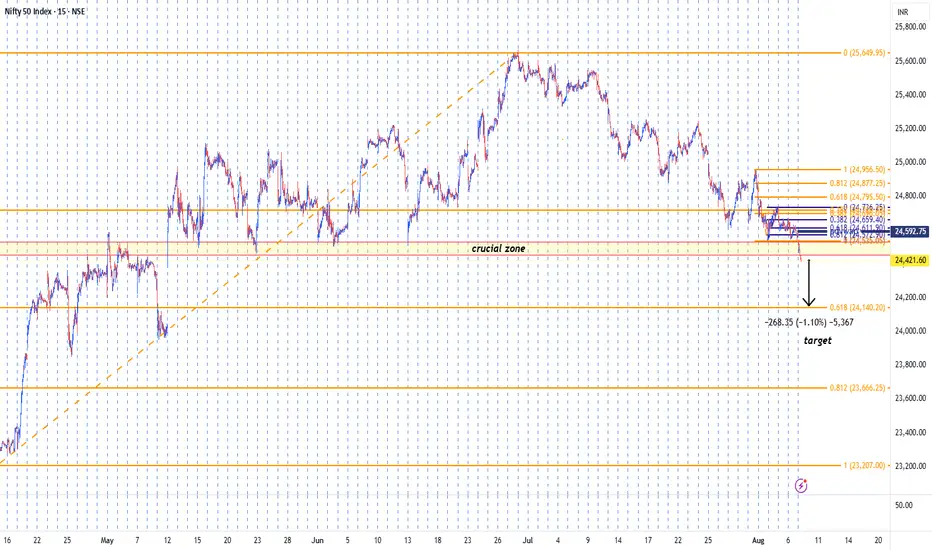
Nifty targetbased on crucial zone break + fibo extention theory
marked target in above chart
#nifty #sankhyainvestment #niftytarget
Nifty 50 Analysis – Key Support Zone HoldsThe Nifty 50 Index is currently testing a critical support zone near the 24,450–24,500 level, which has historically acted as a strong base for multiple reversals. As visible on the chart, price action has formed a series of lower highs and lower lows, but recent candles show buyer defense around this support, hinting at a potential bottom formation.
Structure Breakdown
Over the past few sessions, Nifty has been in a short-term downtrend, trading consistently below the 200 EMA, which confirms the bearish pressure. However, price is now at a make-or-break support level, which has been respected multiple times over the past two months.
A potential W-shaped bottom pattern (double bottom or inverse head & shoulders-like) seems to be forming, which could signal a bullish reversal if the neckline (near 24,850–24,900) breaks convincingly.
Bullish Possibility
If the support holds and price breaks above 24,900, we may see a trend reversal or at least a relief rally. The possible upside targets include:
First Target: 25,100
Second Target: 25,350
Swing Target: 25,600+
The move may be sharp if shorts start covering and fresh buying enters on confirmation. A successful reclaim of the 200 EMA will strengthen the bullish structure.
Bearish Breakdown Possibility
On the flip side, if price fails to hold above 24,450 and we get a candle close below this zone, the bullish reversal setup will get invalidated. This could open room for:
Downside Target 1: 24,200
Downside Target 2: 23,950
Extended Target: 23,700 zone (last swing low)
In this scenario, bears regain full control, and the overall downtrend from July could continue deeper.
Risk Factors for Both Sides
News Event Risk: Any macroeconomic event (like inflation data, RBI policy changes, or geopolitical developments) could trigger volatility and invalidate patterns.
False Breakouts: Watch for fake moves above resistance or below support. Always wait for confirmation candle close.
Gap Open Risk: Overnight global market moves can trigger gap-ups/downs, skipping stop-losses.
Trader Suggestions
- Wait for confirmation before entering long above 24,900 or short below 24,450.
- Use tight stop losses as volatility near key levels can result in whipsaws.
- Avoid heavy positions in this uncertain phase unless breakout or breakdown confirms.
- Keep watching for volume and price momentum for signs of real conviction.
- Option traders may explore straddle/strangle near this tight range, if expecting a sharp move.
Final Word
Nifty is at a crucial turning point. The support zone has worked like a wall so far—but whether it leads to a reversal rally or a breakdown will depend on how price reacts in the next 1–2 sessions. Trade with a clear plan, and adapt quickly based on market behavior.

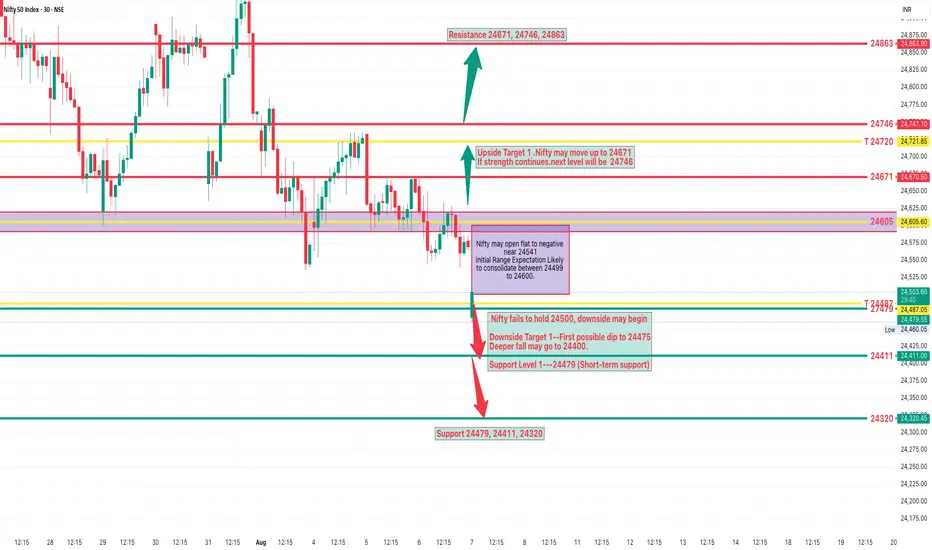
NIFTY Analysis 7 AUGUST, 2025 ,Morning update at 9 amSELL TRADE SETUPS
Trade 1: Breakdown Below 24449
Trigger: Price breaks and sustains below 24500.
Entry: Short below 24490 (after 5-min candle close).
Target 1: 24475
Target 2: 24411
Stop Loss: Above 24520
Trade 2: Breakdown Below 24475
Trigger: Price sustains below 24475.
Entry: Short below 24470
Target 1: 24411
Target 2: 24320
Stop Loss: Above 24490
BUY/LONG TRADE SETUPS
🔺Trade 3: Breakout Above 24600 with BB Pattern
Trigger: BB Pattern confirmed on 5-min chart around 24600
Entry: Buy above 24610
Target 1: 24672
Target 2: 24745
Stop Loss: Below 24585
Trade 4: Breakout Above 24746
Trigger: Strong bullish momentum above 24746
Entry: Buy above 24750
Target: 24863
Stop Loss: Below 24720
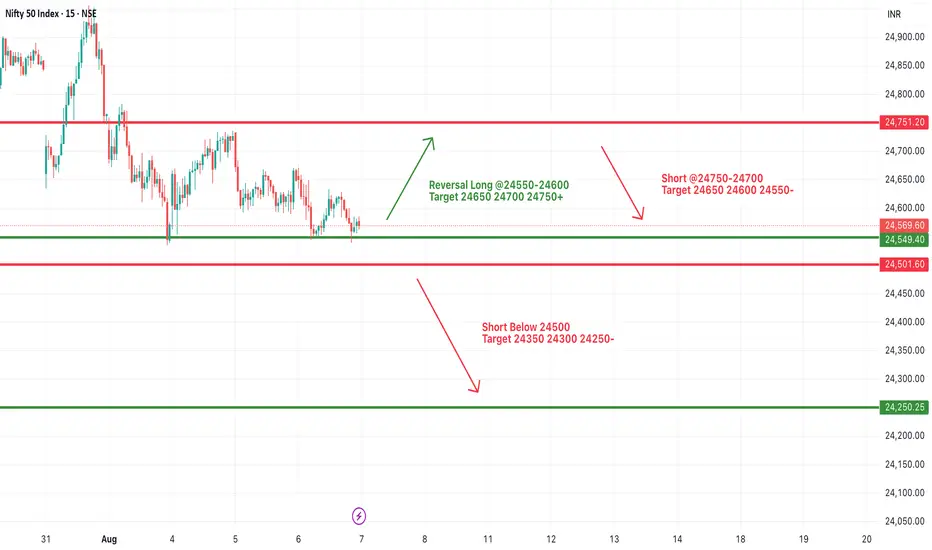
#NIFTY Intraday Support and Resistance Levels - 07/08/2025Nifty is expected to open flat near the 24,550–24,570 range, showing signs of consolidation after recent volatile moves. This zone is likely to act as a key intraday support level, and price action here will be crucial in determining further direction.
If Nifty manages to hold above the 24,550–24,600 level and shows reversal signs, a bounce back can be anticipated. In such a case, the index may move upward toward 24,650, 24,700, and eventually 24,750+. This upside move would indicate strength returning at lower support levels.
However, if Nifty fails to sustain above 24,550 and breaks below the 24,500 level, it could trigger a downward move. A short-side opportunity may emerge below 24,500, with potential targets at 24,350, 24,300, and 24,250-. On the other hand, any bounce near 24,550–24,600 could provide a reversal long setup targeting 24,650, 24,700, and 24,750+.
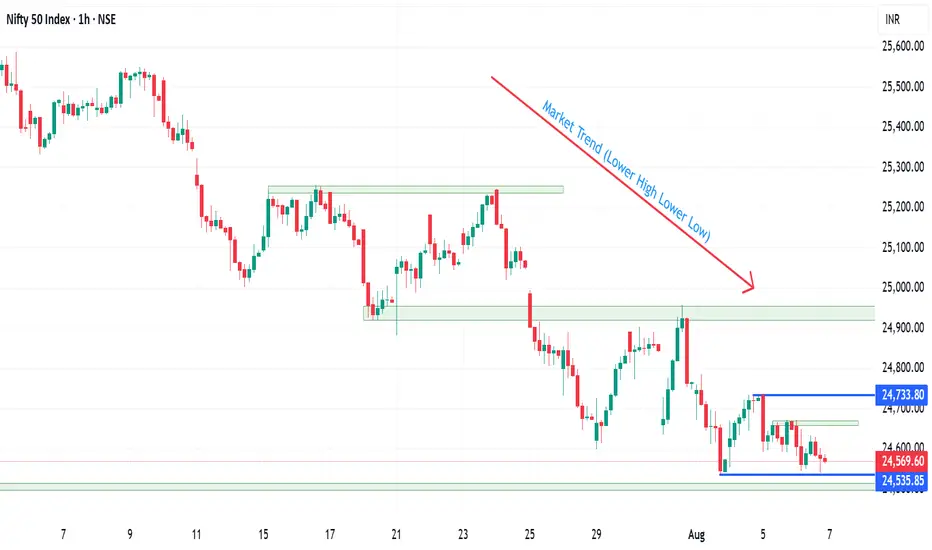
Expecting a nice move on Nifty weekly expiry 07/08/2025.Nifty for the last three days is forming an inside candle, chances of it moving either side is high.
If the market starts trading below 24510, it may test the pervious support around 24230 and another levels below it.
On the higher side, trade can only be initiated only once 24650 levels are taken out.
In case of a gap down wait for the retest of the support zone that will act as the resistance now. Enter trade only once the setup triggers.
Major resistance levels :- 24660, 24733
Support levels :- 24500 (psycological level), 24228
Hourly Moving averages are above the closing price while the Daily 100 EMA is around the closing leves, which can act as the support else it can come to test the 200 EMA (24200).
Wait for the price action near the levels before entering the market.
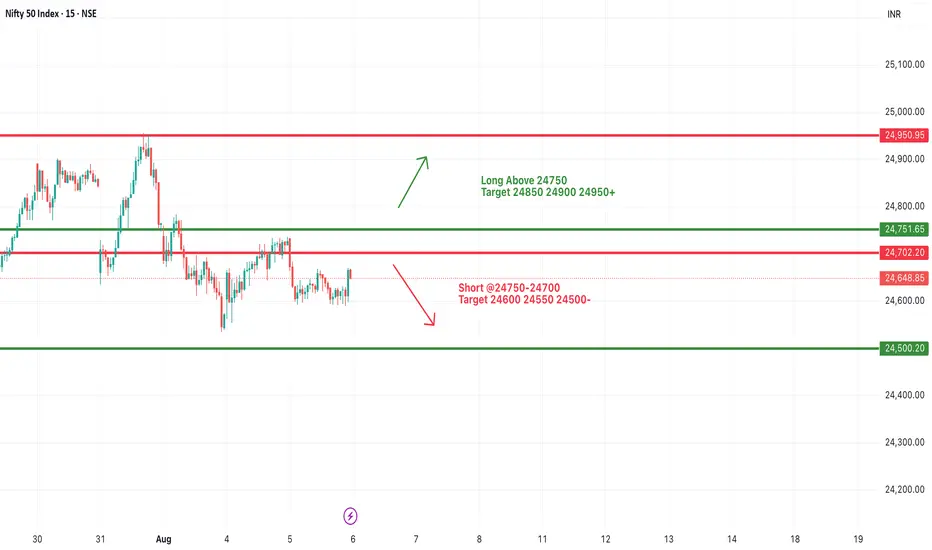
#NIFTY Intraday Support and Resistance Levels - 06/08/2025Nifty is expected to open slightly gap up near the 24,650 level, continuing to consolidate within a defined range. The price action has been forming a tight structure, making directional breakouts crucial for the next move.
On the upside, a long trade can be considered if Nifty sustains above 24,750–24,800, which is the immediate resistance zone. A breakout above this zone could push Nifty toward 24,850, 24,900, and 24,950+ levels intraday.
On the downside, if Nifty fails to hold the 24,750–24,700 level and starts trading below it, a short setup can be activated with potential targets of 24,600, 24,550, and 24,500-. Strong support lies near the 24,500 mark, which will be a critical zone for bulls to defend.
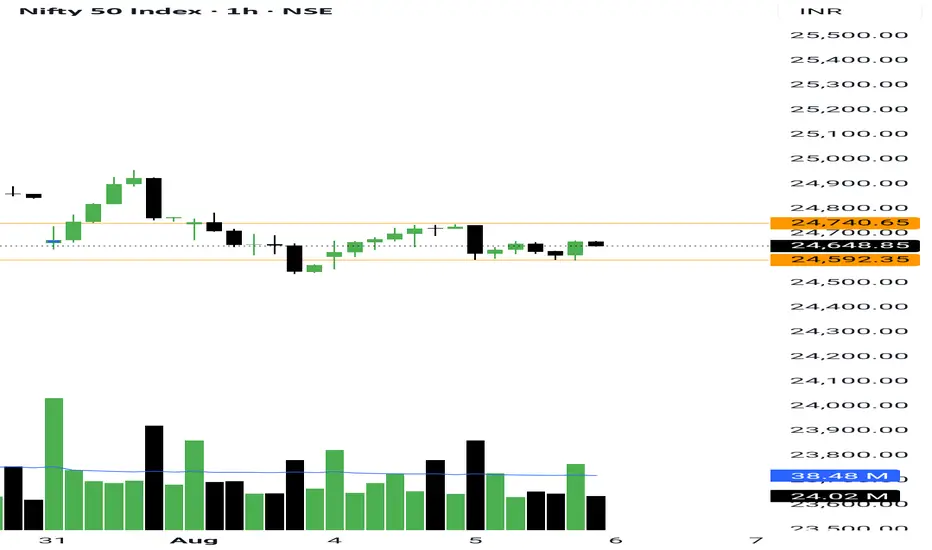
Nifty and Banknifty both giving good sign Yesterday, I spotted stopping volume in NSE:NIFTY — and that’s a good sign.
Nifty gave a strong bounce by the end of the day, which shows buyers stepping in.
Though sellers' volume is still high — above 50 million — the price action looks encouraging.
Today, Nifty’s Pivot is at 24,657
Pivot Percentile is just 0.03%, which means we can expect a trendy move again — either up or down, depending on where it breaks.
Intraday Support: 24,588
Intraday Resistance: 24,733
If the resistance breaks and Nifty holds above it, we might see a strong bounce today.
NSE:BANKNIFTY also looks bounce-ready on the intraday chart.
But only if the support at 55,095 holds well.
Can clearly see stopping volume on the 15-minute chart, which is a positive signal.
Sector Watch:
Yesterday, I saw good movement in NSE:NIFTY_IND_DEFENCE , NSE:CNXAUTO , and Fertilizer sectors. Keep an eye on them for short term trade opportunities.
Yesterday, I traded NSE:FORCEMOT and it gave a move of 4%+.
Still holding the position.
That’s all for today.
Stick to your setup, follow your plan.
Take care and have a profitable day ahead!
NIFTY Intraday Trade Setup 06 Aug 2025NIFTY Intraday Trade Setup 06 Aug 2025
Buy-Above 24750
Invalid-Below 24700
T- 24950
Bearish- Below 24530
Invalid-Above 24580
T- 24335
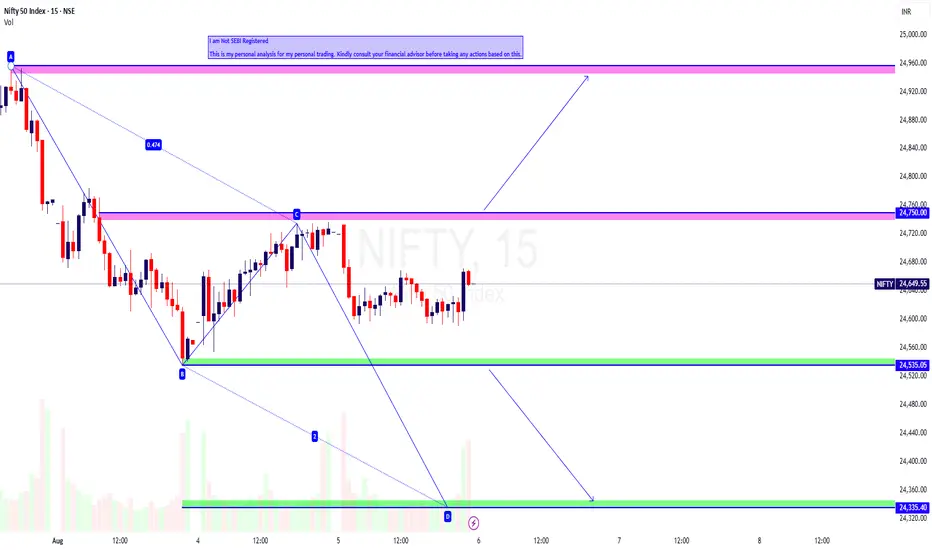
NIFTY has closed on a bearish note with 0.3% cut today. It has made 2 consecutive inside candles in daily TF. 24500 zone will be a confluence zone, due to multiple supports taken earlier. Below 24400 index can escalate, and index may start an impulsive move. On flat opening above 24750 index may give a reversal move towards 25k. Below 24530 index will be simple short towards 24335 zone as per ABCD pattern. Plan on 15 Min candle closing.
In case of a big gap up/down, wait till 10 o'clock and mark the high and low of the trading range (5MIN). Trade on this range breakout.
==========
I am Not SEBI Registered
This is my personal analysis for my personal trading. Kindly consult your financial advisor before taking any actions based on this.
Nifty Bullish Confluence Set up ( Swing+ positional)Hello,
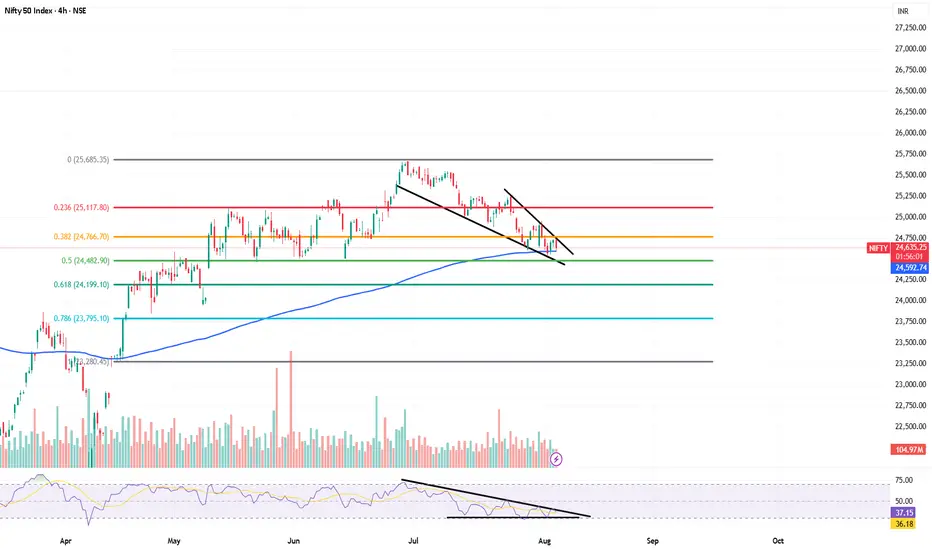
Nifty spot 24610 from low of 21780 made high around 25650 april to june in 2 months now Its retrace to 24600 i.e almost more than 50% retracement another is RSI squezze with bullish divergence in lowertimeframe with EMA 200 support and making pattern of falling wedge .
expecting bullish reversal set up for new lifetime high possibilties in next 2 months
Nifty: open is equal to high 5th Aug25Dear Friends, hope you are healthy and becoming wealthy 🙏
As updated in my recent Ideas on trading view,: The nifty have been making a pattern and in downtrend channel.
Today 5th August 2025: it's open = high and from the opening level it went down,
Weekly charts also shows weakness. Stay cautious while making a position.
Overall weakness can be seen at the charts-
It's major levels are:
Support 24360
Resistance 24980
👉It's only for learning purpose, before making any position please consult your investment advisor.
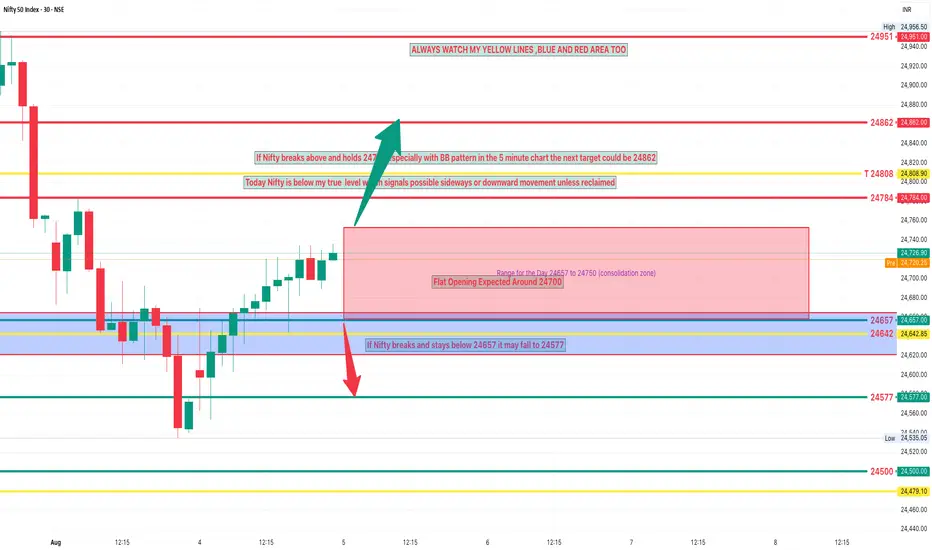
NIFTY Analysis 5 AUGUEST, 2025 ,Morning update at 9 amProfit booking and consolidation in a narrow range
Technical Pattern Indicates weakness above resistance and price struggling to break higher levels
Observe whether Nifty closed below or above the derived my levels
Today Nifty is below my true level which signals possible sideways or downward movement unless reclaimed
Expected Price Action Today
Flat Opening Expected Around 24700
Range for the Day 24657 to 24751 (consolidation zone)
Upside Trigger: If Nifty breaks above and holds 24751 especially with bb pattern in the 5 minute chart the next target could be 24862
Downside Trigger If Nifty breaks and stays below 24657 it may fall to 24577
Support 24657 ,24577 , 24500
Resistance 24784 ,24862 , 24951
if you have any problem too undestanding my levels or in trading msg me.
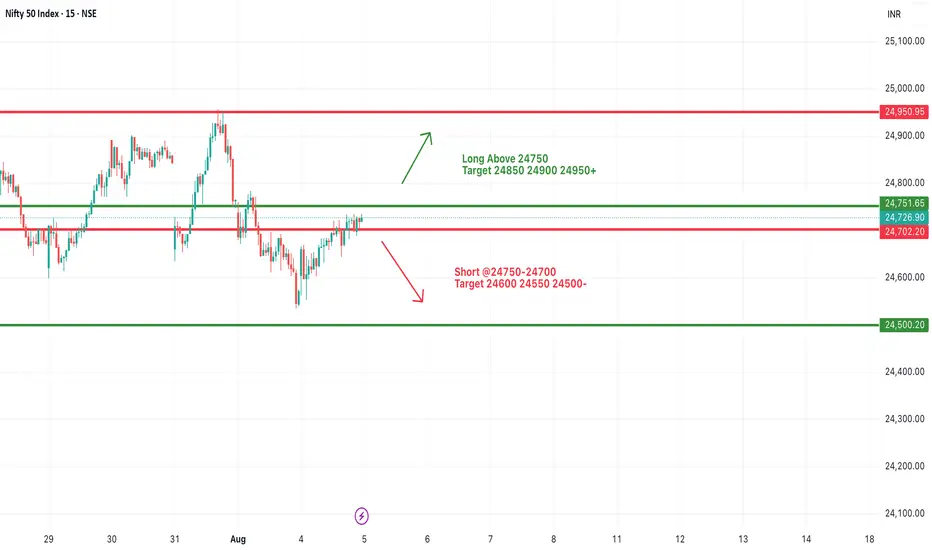
#NIFTY Intraday Support and Resistance Levels - 05/08/2025Nifty is expected to open flat near the 24,720–24,730 zone, showing signs of consolidation within a tight range. The price action remains stuck between the immediate resistance and support levels, and today’s move could be dictated by a breakout from this range.
On the upside, a breakout and sustained move above the 24,750 level may trigger a bullish rally toward 24,850, 24,900, and 24,950+ levels. This area has previously acted as resistance, and a clean breakout could lead to momentum-based buying.
On the downside, if Nifty fails to hold 24,700 and breaks below 24,750–24,700, a short opportunity may arise with potential targets at 24,600, 24,550, and 24,500- levels.
The range between 24,700–24,750 is the intraday decision zone. Traders should wait for confirmation and avoid premature entries. Use tight stop-losses and book partial profits near each level to manage risk effectively.
5th August 2025 trade plan prediction🔼 Bullish Triggers
✅ Above 24,790 = Hold CE by positive trade view
✅ Above 24,920 = Strong bullish breakout (Entry zone for CE)
✅ Above 25,028 = Shot Cover Level → Upside acceleration likely
CE (Call Option) Strategy:
Buy CE above 24,790 for 24,920 / 25,000 targets
Add CE above 25,028 for quick upside move
🔽 Bearish Triggers
🔻 Below 24,700 = Slightly negative bias starts
🔻 Below 24,670 = Below Opening R1 → PE can be bought cautiously
🔻 Below 24,533 = Risk zone → Hold PE by level
🔻 Below 24,433 = UNWINDING zone → Strong bearish momentum
🔻 Below 25,000 = Safe Zone for PE if reversal happens from higher levels
PE (Put Option) Strategy:
Buy PE if breaks 24,670 for 24,533 / 24,433 targets
Add below 24,423 for deeper downside move

Dow Theory Update and Nifty AnalysisIn this video, we have explained the following points -
* A new Dow Top "A1" has been created by Nifty50.
* The significance of the new Dow Top has been explained.
* The current structure of Nifty has been discussed.
* The importance of waiting for the next candle and the current key support level has been highlighted.

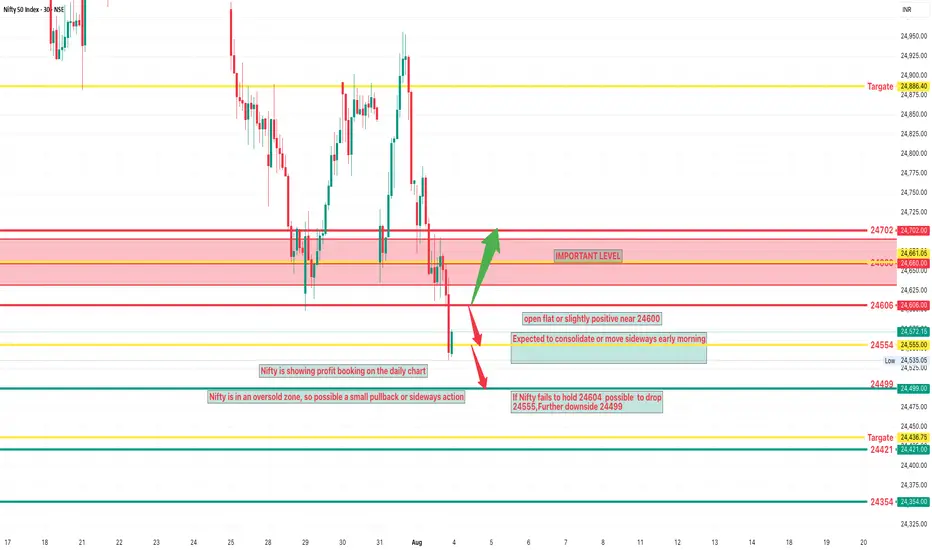
NIFTY Analysis 4 AUGUEST, 2025 ,Morning update at 9 amHowever, Nifty is in an oversold zone, so a small pullback or sideways action is likely.
Opening Expectation:
Likely to open flat or slightly positive near 24600.
Expected to consolidate or move sideways early in the day.
Bullish Scenario:
If a bb pattern forms around 24600 on the 5-min chart expect an upward move.
Potential targets: 24662 and 24702.
Bearish Scenario:
If Nifty fails to hold 24604 likely to drop:
First target: 24554
Further downside: 24499
Key Support & Resistance Levels (Unique & Precise):
Type Levels
Support 24,499 , 24421 ,24354
Resistance 24606 , 24660 , 24702
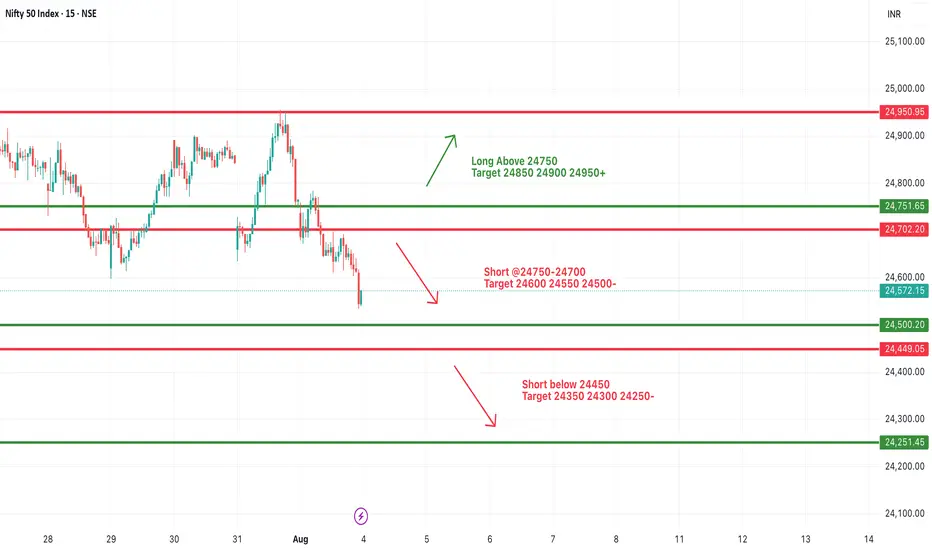
#NIFTY Intraday Support and Resistance Levels - 04/08/2025Nifty is expected to open slightly gap up near the 24,550–24,600 zone. This area is currently acting as a resistance, and price action around it will be crucial to determine directional momentum for the session.
If Nifty sustains above 24,750, a bullish rally may unfold with potential upside targets at 24,850, 24,900, and 24,950+. A breakout above 24,751.65 would confirm strength and may trigger intraday buying interest.
On the downside, if Nifty faces rejection around 24,700 and breaks below the 24,700–24,750 zone, it can lead to a bearish move. A breakdown below this zone opens downside targets at 24,600, 24,550, and 24,500-. Further weakness below 24,450 may lead to an extended fall toward 24,350, 24,300, and 24,250-.
The broader trend remains weak unless Nifty reclaims strength above 24,750. Traders should stay cautious near reversal levels and maintain strict trailing stop-loss to protect profits and manage intraday volatility.
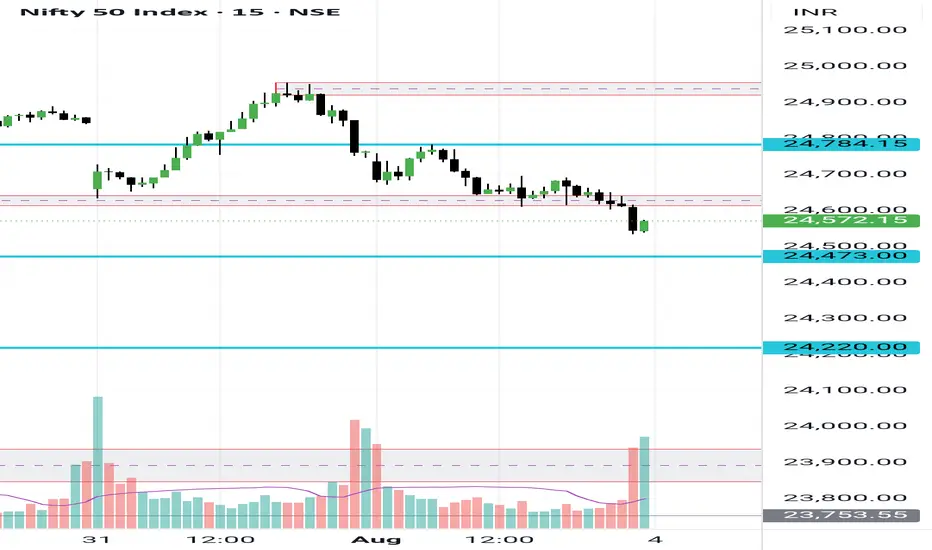
Nifty levels for next week (4th August 2025 onwards)Nifty is in a clear downtrend, important levels are marked on the chart.
A break below 24550 may bring the 24460 level and a break further may show the 24300 levels too on the chart. It may not be seen in a single day but can be visible in few trading sessions.
An up move is possible only above 24630 level that too if price sustains above this level else it may bring more selling from upper levels..
Let's see how it turns out..