NIFTY KEY LEVELS FOR 01.08.2025NIFTY KEY LEVELS FOR 01.08.2025
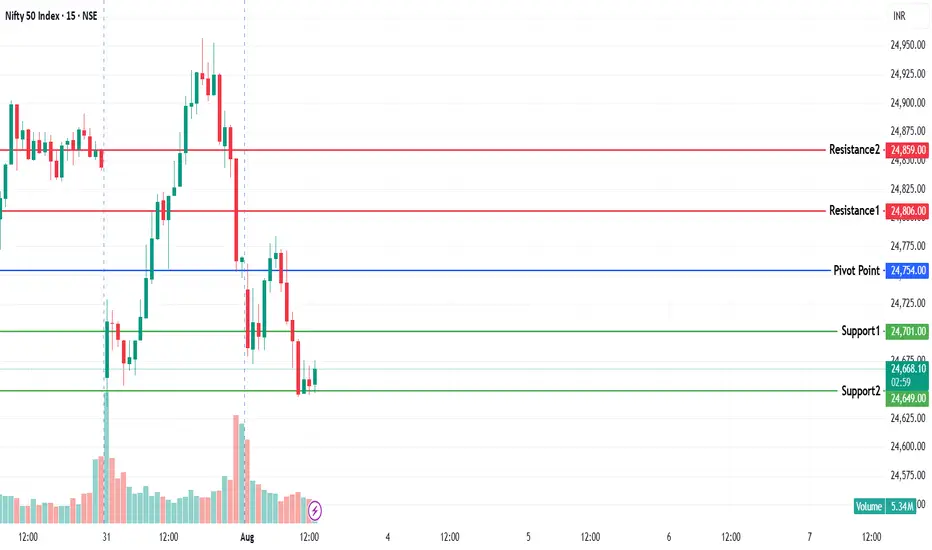
If the candle stays above the pivot point, it is considered a bullish bias; if it remains below, it indicates a bearish bias. Price may reverse near Resistance 1 or Support 1. If it moves further, the next potential reversal zone is near Resistance 2 or Support 2. If these levels are also broken, we can expect the trend.
If the range(R2-S2) is narrow, the market may become volatile or trend strongly. If the range is wide, the market is more likely to remain sideways
📢 Disclaimer
I am not a SEBI-registered financial adviser.
The information, views, and ideas shared here are purely for educational and informational purposes only. They are not intended as investment advice or a recommendation to buy, sell, or hold any financial instruments.
Please consult with your SEBI-registered financial advisor before making any trading or investment decisions.
Trading and investing in the stock market involves risk, and you should do your own research and analysis. You are solely responsible for any decisions made based on this research.
Niftyprediction
NIFTY Analysis 1 AUGUEST, 2025 ,Morning update at 9 amIF YO LIKE THESE LEVEL SAY THANK YOU
Expected Scenarios:
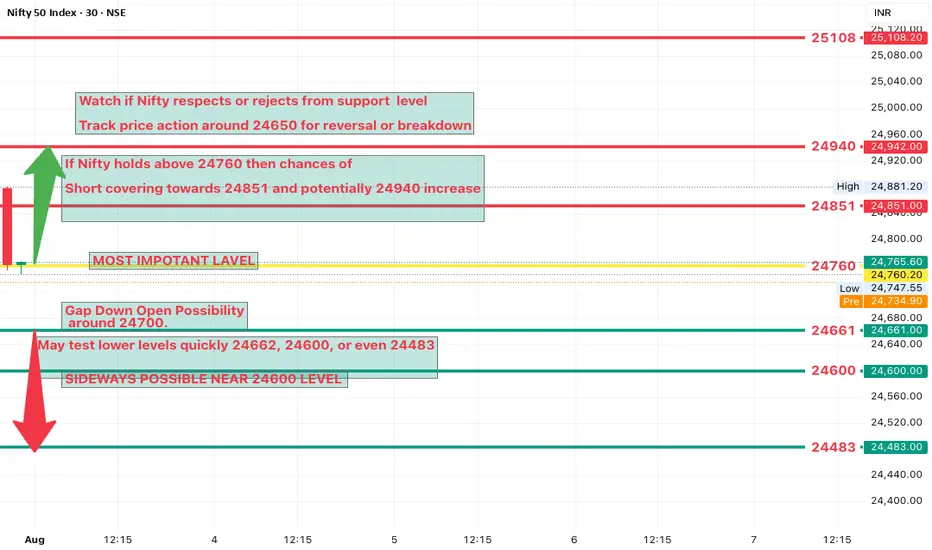
Gap-Down Open Possibility:
Likely around 24700.
May test lower levels quickly: 24662, 24600, or even 24483.
Bearish Setup to Watch:
On the 5-min chart, watch near 24650:
If a Bearish Bottleneck Pattern forms Nifty may slip towards:
24602, and even 24500.
Recovery Watch:
If Nifty holds above 24760 then chances of:
Short covering towards 24851 and potentially 24940 increase.
Critical Levels (Exclusive Support & Resistance):
Support 24661 , 24600 ,24483
Resistance. 24851,24940,25108
Nifty opens below 24700 Wait for 24662 or 24600 test
Bearish bottleneck at 24650 Go short for 24602 24500
Nifty holds above 24760 Look for long towards 24851 24940
Nifty reclaims 24851 with strength Possibility of rally to 25108
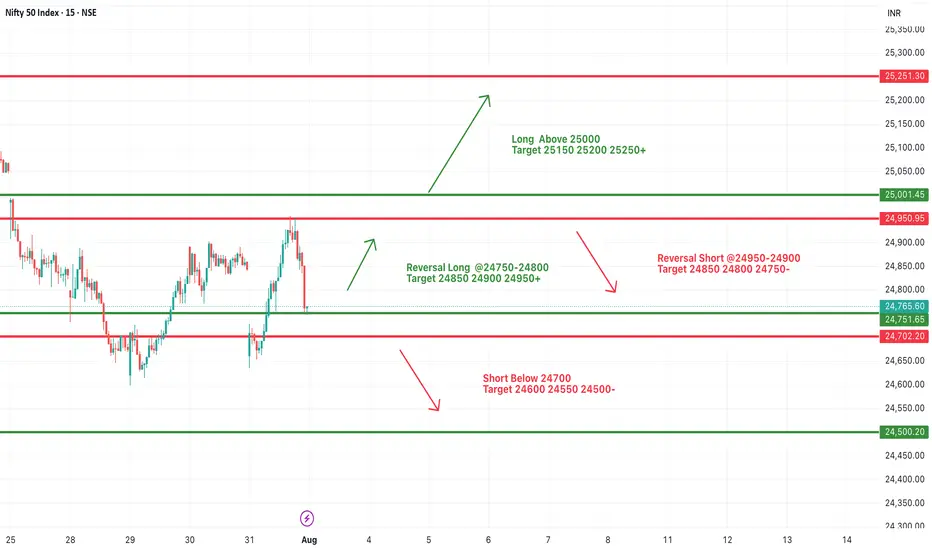
#NIFTY Intraday Support and Resistance Levels - 01/08/2025Nifty is likely to open flat near the 24,750 zone, suggesting a neutral start to the day. Traders should be prepared for a breakout or reversal setup based on how price behaves near key levels.
If Nifty holds the 24,750–24,800 zone and sustains, a reversal long opportunity is valid, with upside targets of 24,850, 24,900, and 24,950+. A breakout above the 25,000 psychological level would trigger a strong rally with higher targets of 25,150, 25,200, and 25,250+.
On the other hand, if Nifty faces resistance near 24,900–24,950, it could reverse sharply. A reversal short from this zone can target 24,850, 24,800, and 24,750. A further breakdown below 24,700 will open up shorting opportunities, targeting 24,600, 24,550, and 24,500.
Today’s flat opening presents a wait-and-watch situation. Price action near the key zones of 24,750–24,800 and 24,900–25,000 will determine directional momentum.
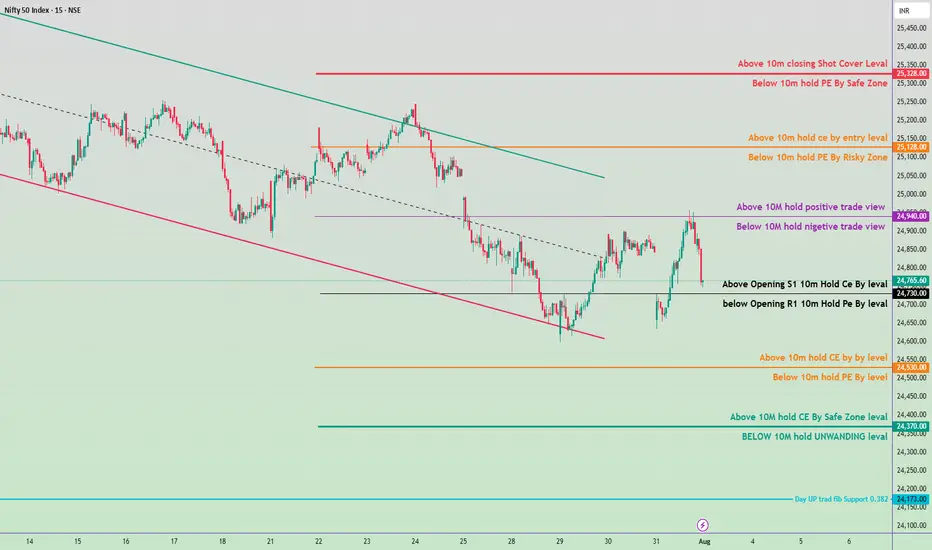
Trade Plan Description for Tomorrow August 1, 2025Bullish Zones & Strategy (Call / CE Levels)
Above 24,765 (Opening S1):
If price sustains above this, bias may shift positive.
🔹 Buy CE (Call) above this level with stop below S1.
Key Upside Resistance Levels:
24,940 – Above this, positive trade view builds (Strong CE Hold).
25,100 - 25,150 – CE entry & momentum zone.
25,350 - 25,382 – Shot Cover Zone (Strong resistance, book profit or expect reversal).
🔻 Bearish Zones & Strategy (Put / PE Levels)
Below 24,765:
Stay cautious – move toward bearish bias if price sustains below.
🔸 Buy PE (Put) below this level with stop above.
Key Downside Support Levels:
24,708 – R1 level; below this, PE strength increases.
24,550 - 24,500 – PE by-level zone.
24,370 – Safe Zone for PE traders.
24,173 - 24,130 – Unwinding + Fib Support.
NIFTY KEY LEVELS FOR 31.07.2025NIFTY KEY LEVELS FOR 31.07.2025
If the candle stays above the pivot point, it is considered a bullish bias; if it remains below, it indicates a bearish bias. Price may reverse near Resistance 1 or Support 1. If it moves further, the next potential reversal zone is near Resistance 2 or Support 2. If these levels are also broken, we can expect the trend.
If the range(R2-S2) is narrow, the market may become volatile or trend strongly. If the range is wide, the market is more likely to remain sideways
📢 Disclaimer
I am not a SEBI-registered financial adviser.
The information, views, and ideas shared here are purely for educational and informational purposes only. They are not intended as investment advice or a recommendation to buy, sell, or hold any financial instruments.
Please consult with your SEBI-registered financial advisor before making any trading or investment decisions.
Trading and investing in the stock market involves risk, and you should do your own research and analysis. You are solely responsible for any decisions made based on this research.
NIFTY Analysis – 31 july 2025 ,Morning update at 9 amExpected Market Behavior
Nifty may open gap down near 24757
May slip towards 24620 and then 24481
Around 24620, expect sideways or consolidation
If a Bearish Bottleneck Pattern forms near 24620 (5-min chart), then Nifty may fall further toward 24450 to 24500
If Nifty sustains above 24922, it may trigger short covering toward 24995 and possibly 25097
Support
24757
24620
24481
Resistance
24922
24995
25097
Tariff news increases volatility
Causes gap-down openings or weak recovery
Top Sectors Affected by U.S. Tariffs on India
1. Pharmaceuticals
India is one of the largest exporters of generic drugs to the U.S.
Impact: U.S. tariffs can reduce competitiveness and margins
Key Stocks Affected:
Sun Pharma
Cipla
Dr. Reddy’s Labs
Lupin
Aurobindo Pharma
2. Textiles & Apparel
A large chunk of India’s textile exports (clothing, home textiles) go to the U.S.
Impact: High price due to tariffs = loss to competitors like Bangladesh, Vietnam
Key Stocks Affected:
Welspun India
Arvind
Raymond
Vardhman Textiles
KPR Mill
3. 💻 Information Technology (IT) Services
Though services usually aren’t taxed directly like goods, indirect restrictions (like visa issues or regulatory controls) can affect business.
Impact: If IT services are restricted, contract flow from U.S. reduces
Key Stocks Affected:
TCS
Infosys
Wipro
HCL Tech
Tech Mahindra
4. Steel & Metal Exports
U.S. often imposes duties on Indian steel and aluminum for protectionism.
Impact: Steel exports drop, prices fall
Key Stocks Affected:
Tata Steel
JSW Steel
Jindal Steel & Power
5. Auto Components
India exports automotive parts to U.S. automakers.
Impact: Higher cost for U.S. buyers may reduce demand
Key Stocks Affected:
Motherson Sumi
Bharat Forge
Sundaram Fasteners
6. Chemical & Specialty Chemical
India is a big player in specialty chemicals, also impacted by tariff or import restrictions.
Key Stocks Affected:
SRF
PI Industries
Aarti Industries
Navin Fluorine

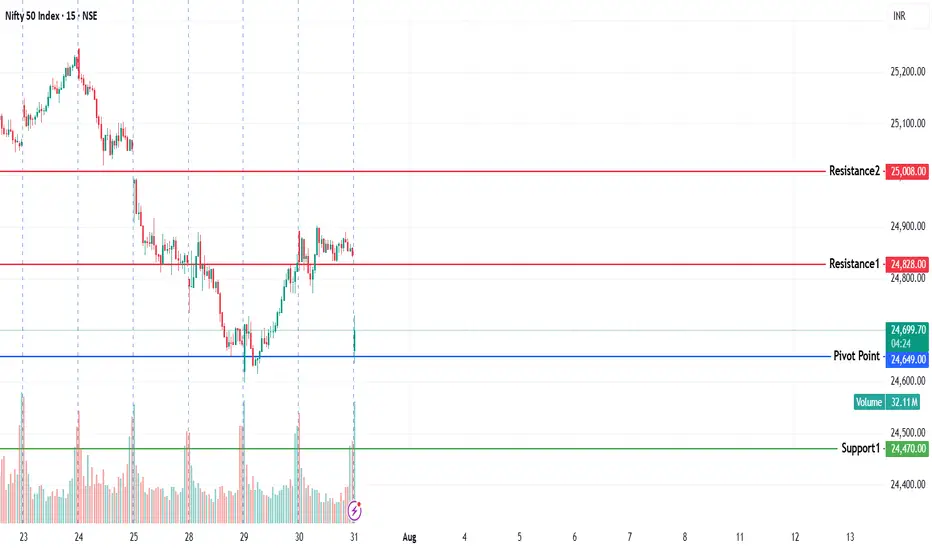
#NIFTY Intraday Support and Resistance Levels - 31/07/2025Today, Nifty is expected to open with a gap-down below the 24,700 level, signaling potential early weakness in the session. The market is hovering around a critical support zone, and price action near the opening will set the tone for intraday moves.
If Nifty sustains below the 24,700–24,750 zone, it may trigger a short opportunity. A break and close below this level can lead to a downside move towards 24,600, 24,550, and possibly 24,500. Continued pressure could further drag the index toward 24,450, and if that breaks, we may see deeper levels near 24,350, 24,300, or even 24,250.
On the flip side, if the index shows a reversal from the 24,700–24,750 zone and sustains above 24,750, a reversal long setup may activate. This could push the index higher toward 24,850, 24,900, and 24,950+, where it may face significant resistance.

Will 25 percent TARIFF put NIFTY under pressure!!??As we can see NIFTY remained sideways which was well anticipated as it is in a tight range. Now that POTUS TRUMP has announced 25 percent tariff with penalty that will be effective from AUG 1 can put NIFTY under pressure as much like CHINA's delay of tariff implementation, it was anticipated that INDIA's tariff might be delayed but its implemetation can create havoc in the market and that very havoc can give buying opportunity to many. IF NIFTY opens very weak, it is likely that it would start recovering from important demand zones. It would be better to stay away and watch market for tomorrow as it can decide further move so keep watching cautiously.

NIFTY doesnt looks at this level NIFTY will have to sustain above 24880 levels for a upward breakout , otherwise it's a possibiliy of testing 24500 levels..in coming next days..
NIFTY KEY LEVELS FOR 30.07.2025NIFTY KEY LEVELS FOR 30.07.2025
If the candle stays above the pivot point, it is considered a bullish bias; if it remains below, it indicates a bearish bias. Price may reverse near Resistance 1 or Support 1. If it moves further, the next potential reversal zone is near Resistance 2 or Support 2. If these levels are also broken, we can expect the trend.
If the range(R2-S2) is narrow, the market may become volatile or trend strongly. If the range is wide, the market is more likely to remain sideways
📢 Disclaimer
I am not a SEBI-registered financial adviser.
The information, views, and ideas shared here are purely for educational and informational purposes only. They are not intended as investment advice or a recommendation to buy, sell, or hold any financial instruments.
Please consult with your SEBI-registered financial advisor before making any trading or investment decisions.
Trading and investing in the stock market involves risk, and you should do your own research and analysis. You are solely responsible for any decisions made based on this research.
NIFTY Analysis – 30 july 2025 ,Morning update at 9 amMay open flat/negative and enter sideways consolidation.
Watchpoints:
Above 24846: Could trigger short covering up to 24920.
Bearish setup near 24777 (5-min chart): Could lead to a drop towards 24638.
Key Levels for Today:
Type Levels
Support 24756, 24639, 24555
Resistance 24846, 24920, 24997
Opening Scenario Handling:
If Nifty opens flat or slightly negative but holds above 24847, look for long (buy on dip) with targets 24920 to 24997.
If price action stays below 24777 and forms a Bearish Bottleneck on the 5-min chart, then sell on rise for targets 24638 to 24556.

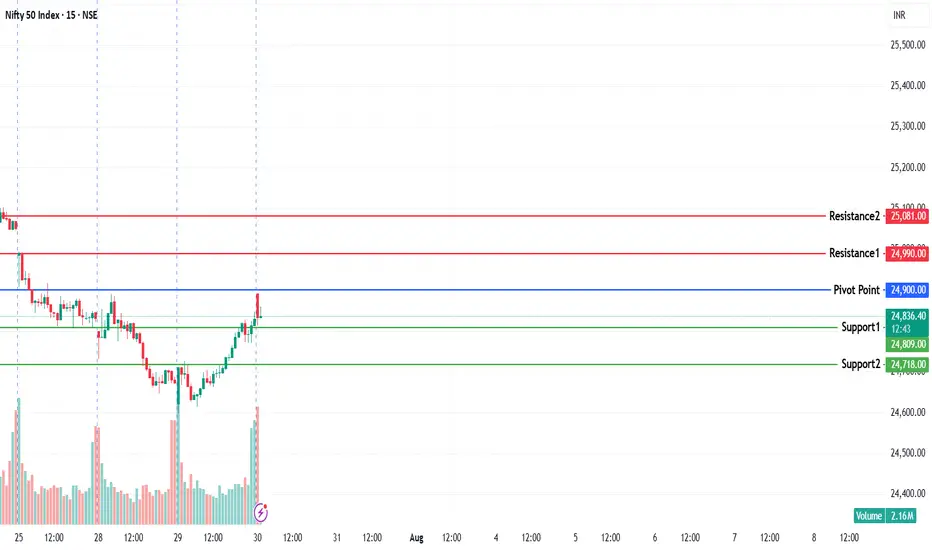
#NIFTY Intraday Support and Resistance Levels - 30/07/2025After a strong recovery from recent lows, Nifty is expected to open flat today and may continue its upward momentum if key resistance levels are breached. The index is currently hovering near the upper end of its reversal zone.
Upside Levels:
A breakout above 25,000 could trigger bullish continuation.
If sustained, we can expect targets at 25,150, 25,200, and 25,250+.
This level is crucial for short-term trend reversal confirmation.
Reversal Buy Opportunity:
If Nifty takes support around 24,750–24,800, a reversal long can be initiated.
Expected targets for this setup: 24,850, 24,900, 24,950+.
Keep strict trailing stop loss as volatility may increase near upper resistance zones.
Reversal Short Setup:
If price fails to sustain above 24,900–24,950, a short opportunity may arise.
Expected downside targets: 24,850, 24,800, 24,750-.
This zone may act as a reversal point for sellers.
Breakdown Short Setup:
If Nifty breaks below 24,700, a strong downside move may begin.
In that case, expect targets at 24,600, 24,550, and 24,500-.
Summary:
Today’s session could turn directional after consolidation around key levels. Wait for confirmation near reversal zones before entering trades. Follow partial profit booking and trailing stop loss for intraday trades.

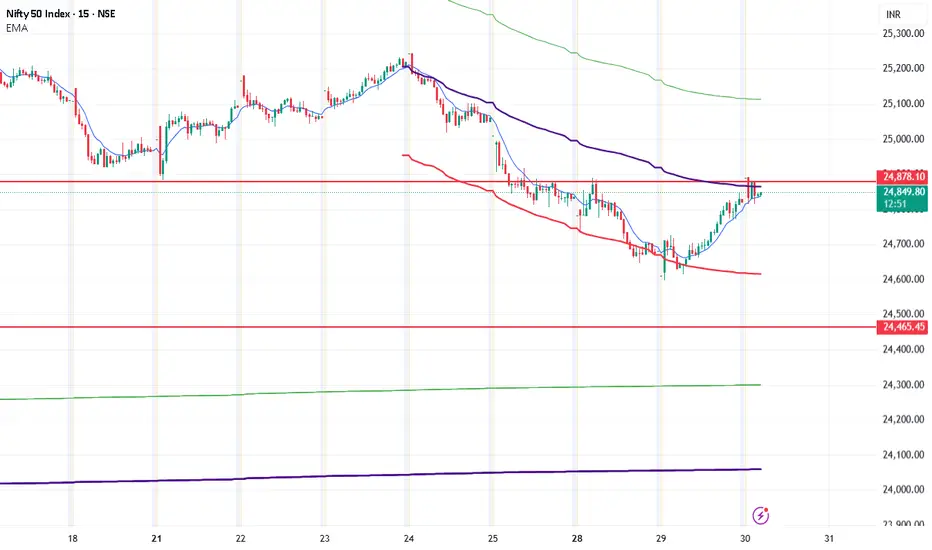
Nifty AnalysisNifty formed Bullish engulfing candle and moved above key EMAs.
Call may be entered after retracement of 61.8% of recent swing.
Stoploss just below 38.2%.
Target till 25th July Gap down.
This gives 1:3 risk reward ratio.
Timeframe 1-5 days.

Nifty is Bullish but not Fully. Waiting for Confirmation move So just like we anticipated, Nifty opened with a gap down — and gave a beautiful bounce right from the start. NSE:CNXPHARMA led the charge exactly as we discussed yesterday, proving once again how preparation beats prediction.
Nifty's Pivot has now shifted to 24755, and the Pivot Percentile has climbed to 0.26 — clear sign that we may see another directional move tomorrow. The market is heating up again.
Today's candle on NSE:NIFTY is a classic liquidity grab — trapped shorts at the bottom and a clean reversal. That has flipped the intraday trend to the upside. From here, any dip should be seen as a buying opportunity — but only with a strict stoploss.
Support for Nifty stands strong at 24800, while the key resistance remains at 25000. If momentum holds, we might just test that level tomorrow.
Now coming to NSE:BANKNIFTY — the pivot is at 56120 with support around 56000. This index also looks bullish on the intraday timeframe, showing signs of strength building up.
Remember clearly that the market is just bouncy on intraday and a clear bullish sign is still not visible. So trade with that in mind. Use tight Stoploss.
On the sectoral front, #Fertilizer and NSE:NIFTY_MS_IT_TELCM stocks are catching our attention. Both showing solid accumulation patterns and might lead the next leg of momentum.
As for trades, today was another green day. Here's how the setups I traded recently played out:
1. NSE:HIRECT – locked 19.99%
2. NSE:PARADEEP – up 8.57%
3. NSE:TATACHEM – added 7.03%
4. #DHANUKA – 6.01% in the green
5. #JBCHEPHARMA – gave a clean 5%
6. #IXIGO – hit 5% upside
7. #PRIVISCL – moved more than 5%
Another day of solid execution following my Earnings Pivot Strategy.
That’s it for today. Rest well, manage your risk, and let’s get ready for tomorrow.
Stay sharp and trade safe.
NIFTY KEY LEVELS FOR 29.07.2025NIFTY KEY LEVELS FOR 29.07.2025
If the candle stays above the pivot point, it is considered a bullish bias; if it remains below, it indicates a bearish bias. Price may reverse near Resistance 1 or Support 1. If it moves further, the next potential reversal zone is near Resistance 2 or Support 2. If these levels are also broken, we can expect the trend.
If the range(R2-S2) is narrow, the market may become volatile or trend strongly. If the range is wide, the market is more likely to remain sideways
📢 Disclaimer
I am not a SEBI-registered financial adviser.
The information, views, and ideas shared here are purely for educational and informational purposes only. They are not intended as investment advice or a recommendation to buy, sell, or hold any financial instruments.
Please consult with your SEBI-registered financial advisor before making any trading or investment decisions.
Trading and investing in the stock market involves risk, and you should do your own research and analysis. You are solely responsible for any decisions made based on this research.
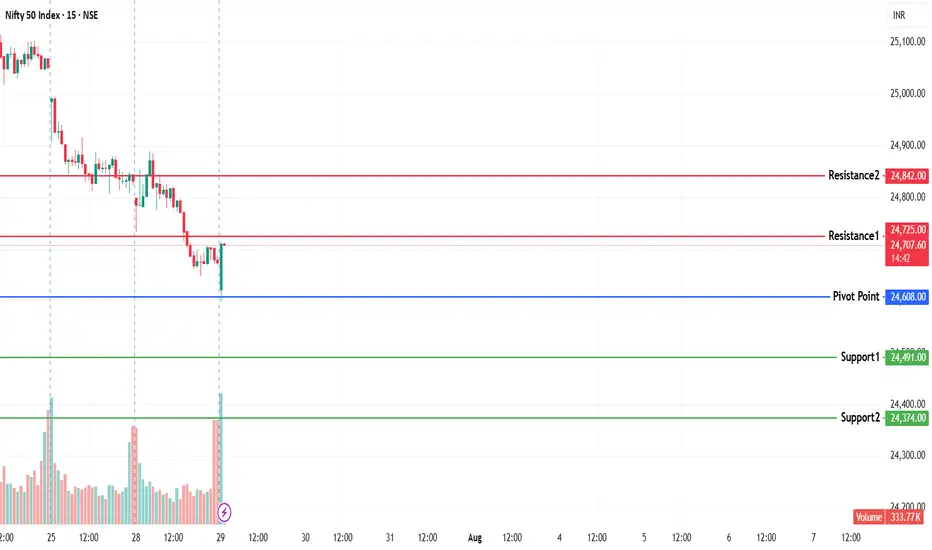
NIFTY Analysis – 29 july 2025 ,Morning update at 9 amMarket View
Likely to open flat negative near 24650
May dip initially towards 24608
If Bearish Bottleneck forms on the 5-min chart, then it may further slip towards 24531
if Bearish Trend Continues
Possible downside extension: 24531 → 24449
If Market Holds or Reverses
If Nifty consolidates or holds above 24650, then short covering may occur
Possible upside targets: 24765, then 24841, and finally 24900
ifty is already in an oversold zone, hence:
First dip may happen early
Monitor for reversal signs around 24608–24531
Don’t short aggressively after the first move

Now is not a good idea to short the market! Sometimes, the best trade is no trade at all. Even if you spot further downside from here, avoid shorting the market — especially if we open with a gap down tomorrow. In fact, a gap-down open might just set the stage for a better opportunity on the upside.
NSE:NIFTY has formed a clear supply candle and closed below the key support of 24710. With this break, 24500 now becomes the next immediate support.
Interestingly, the pivot has shifted slightly higher — from 24845 to 24885 — and the Pivot Percentile remains steady at 0.19%. That’s a sign we may get another directional move tomorrow.
From a technical standpoint:
First key support sits at 24590
Immediate resistance is near 24800
A breakout above this resistance can trigger short covering and push Nifty toward 25000 levels.
Among all sectors, NSE:CNXPHARMA remains the only one showing resilience. So, if a relief rally is to happen, my bet is it will start from the Pharma space.
On the personal front, I took just one trade today — NSE:STLTECH — and it delivered beautifully, closing over 8% higher. A perfect example of quality over quantity.
I continue to rely solely on my Earnings Pivot Strategy — and days like this validate the discipline.
That’s all for now. Stay focused. Protect your capital. And as always, trade smart.
Wishing you a profitable tomorrow.
NIFTY KEY LEVELS FOR 28.07.2025NIFTY KEY LEVELS FOR 28.07.2025
If the candle stays above the pivot point, it is considered a bullish bias; if it remains below, it indicates a bearish bias. Price may reverse near Resistance 1 or Support 1. If it moves further, the next potential reversal zone is near Resistance 2 or Support 2. If these levels are also broken, we can expect the trend.
If the range is narrow, the market may become volatile or trend strongly. If the range is wide, the market is more likely to remain sideways
📢 Disclaimer
I am not a SEBI-registered financial adviser.
The information, views, and ideas shared here are purely for educational and informational purposes only. They are not intended as investment advice or a recommendation to buy, sell, or hold any financial instruments.
Please consult with your SEBI-registered financial advisor before making any trading or investment decisions.
Trading and investing in the stock market involves risk, and you should do your own research and analysis. You are solely responsible for any decisions made based on this research.

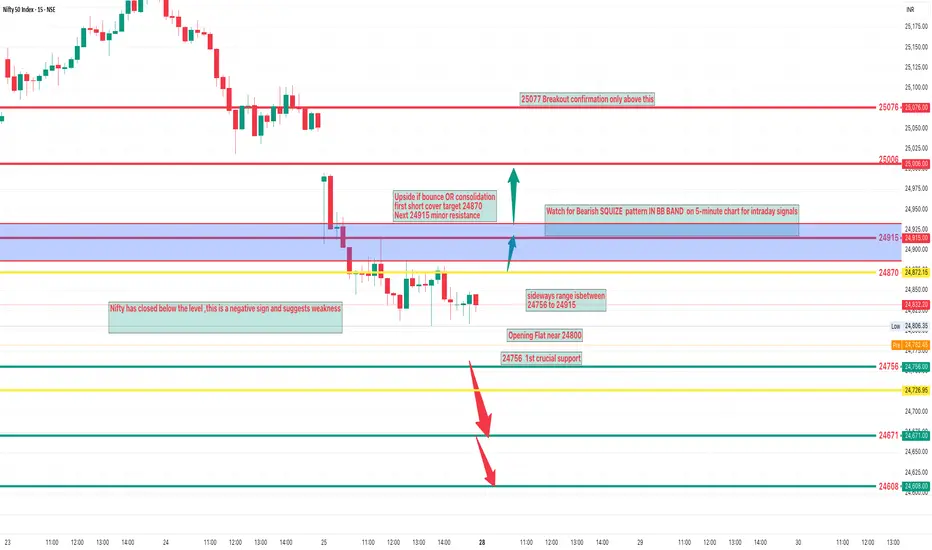
NIFTY Analysis – 28 july 2025 ,Morning update at 9 amExpected Opening & Movement Zones
Likely Opening Flat near 24800.
Immediate Downside Target (if weak)
First: 24756 important support.
Then: 246721– next support.
Upside if bounce or consolidation
First short-cover target: 24870.
Next: 24915 – minor resistance.
24756,Near today's flat open 1st crucial support
24671 If bottleneck confirmed –test this zone
24608 Extended weakness zone
Resistance Levels
24915 Short covering resistance
25,006 Important psychological and swing resistance
25076 Breakout confirmation only above this
the sideways range is likely between
24756 to 24915
Nifty may consolidate in this zone before giving any big move.
Nifty 50 Intraday Trade Plan for tomorrow 28 july 2025📉 Resistance & PE Zones (For Short / PE Trades):
🔴 25,180 – Below 10M Hold PE by Safe Zone
Safe shorting zone if Nifty trades below this after a 10-minute hold.
🔴 25,030 – Below 10M Hold PE by Risky Zone
Entry for PE trades but more risky. Be cautious with volumes and market sentiment.
🟣 24,920 – Below 10M Hold = Negative Trade View
If Nifty holds below this, bias turns negative.
⚫ 24,780 – Below Opening R1 = 10M Hold PE by Level
Below this level, PE trades can be initiated with confirmation.
🟠 24,638 – Below 10M Hold PE by Level
Additional downside continuation level for PE holding.
🟢 24,480 – BELOW 10M Hold = UNWINDING Level
If price sustains below this, expect long unwinding and further decline.
🔵 24,173 – Day UP Trade Fib Support (0.382)
Major Fibonacci support; possible bounce zone or reversal area.
📈 Support & CE Zones (For Long / CE Trades):
🔴 25,200 – Above 10M Closing Shot Cover Level
Short covering possible if Nifty closes above this level.
🟠 25,030 – Above 10M Hold CE by Entry Level
Entry for long trades if 10M hold is confirmed.
🟣 24,920 – Above 10M Hold = Positive Trade View
Holding above this confirms bullish bias.
⚫ 24,800 – Above Opening S1 = 10M Hold CE by Level
Early confirmation level for long trades post opening.
🟠 24,638 – Above 10M Hold CE by Level
Intermediate support if market bounces from lower levels.
🟢 24,500 – Above 10M Hold CE by Safe Zone Level
Safer zone for holding long positions above this point.
✅ Key Levels Summary:
Bullish Above: 24,920 / 25,030 / 25,180
Bearish Below: 24,920 / 24,780 / 24,638 / 24,480
Major Support: 24,173 (Fib level)
Neutral Zone: Between 24,780–24,920 → Wait for breakout

Institutional Trading Strategies🔍 What Is Institutional Trading?
Institutional trading refers to how large financial institutions, such as hedge funds, investment banks, mutual funds, insurance companies, and pension funds, buy and sell large volumes of stocks, options, futures, and other financial instruments in the market.
Unlike retail traders (individual traders), institutions trade with massive capital, often in millions or billions of dollars. Their actions can move the market, and they use advanced tools, data, and strategies to protect their capital and maximize profit.
🏦 Who Are the Institutional Players?
Here are examples of institutional traders:
BlackRock
Vanguard
JP Morgan
Goldman Sachs
Citadel
Morgan Stanley
HDFC AMC / SBI MF (India context)
These entities manage huge portfolios for clients or for themselves and use highly strategic methods to execute trades.
⚙️ Why Are Their Strategies Different?
Institutional traders have several advantages over retail traders:
Access to better data (real-time order flow, economic models)
Advanced technology (high-frequency trading algorithms)
Lower transaction costs (thanks to bulk volume deals)
Connections (direct access to liquidity providers, brokers)
Skilled teams (analysts, quant traders, risk managers)
But there’s a big challenge: Their trades are so large, they can’t buy or sell in one go. If they do, they’ll cause huge price moves (called slippage). So they use smart strategies to enter and exit positions quietly without alerting the market.
🧠 Core Institutional Trading Strategies
Here are the most important trading strategies used by institutions:
1. 📊 Volume-Based Trading (Accumulation & Distribution)
Institutions use a strategy of accumulating large positions over time (buying slowly) and later distributing (selling slowly). This is done to hide their true intent from the market.
Accumulation Phase: Buying gradually in small chunks to avoid price spikes.
Distribution Phase: Selling in a quiet way so they don’t crash the price.
They might accumulate shares for weeks or months, often using dark pools or algorithms to keep their activity hidden.
2. 🏦 Order Flow Analysis / Tape Reading
Institutional traders track real-time order flow — meaning they study the buy/sell pressure using tools like:
Level 2 (market depth)
Time & sales (ticker tape)
Footprint charts
Delta volume
They watch where large orders are being placed, pulled, or spoofed, giving insight into what other big players are doing.
3. 💻 Algorithmic & High-Frequency Trading (HFT)
Institutions use algorithms (algos) to place thousands of trades per second. These bots follow specific rules based on:
Market trends
Arbitrage opportunities
Statistical models
HFT strategies are extremely fast, aiming to profit from tiny price differences in milliseconds.
4. 🧱 Quantitative Trading
Quant funds like Renaissance Technologies or D.E. Shaw use math, coding, and machine learning to create models that predict price movements.
They may build systems that factor in:
Price action history
News sentiment
Economic indicators
Correlation between assets
Volatility, interest rates
These are not human trades – the models execute trades based on data patterns.
5. 🧩 Options-Based Hedging Strategies
Institutions use options to hedge, speculate, or generate income.
Common techniques:
Protective Puts (insurance for falling stocks)
Covered Calls (collect premium for sideways movement)
Calendar Spreads, Iron Condors, etc. (advanced strategies for theta/gamma/vega exposure)
They often create multi-leg options positions to reduce risk and take advantage of implied volatility.
6. 🏰 Dark Pools Trading
Institutions often trade through dark pools, which are private exchanges not visible to the public. These are used to place large orders without revealing size, so other traders don’t front-run their positions.
Example: An institution may buy 1 million shares through a dark pool instead of a public exchange like NSE or NYSE.
7. 📍 Sector Rotation Strategy
Institutions frequently rotate their capital between sectors based on economic cycles.
In recession: move to defensive stocks (FMCG, Pharma)
In recovery: switch to cyclicals (automobile, banking, infrastructure)
They allocate billions of dollars based on macro themes, earnings cycles, and geopolitical shifts.
8. 🔁 Rebalancing Portfolios
Large funds constantly rebalance their portfolios — buying/selling assets to maintain target allocations. This causes monthly/quarterly flows in stocks or ETFs, which can influence price significantly.
Traders often try to anticipate these flows and trade in the same direction.
📉 How Institutional Traders Enter Positions Quietly
Let’s break down a common stealth strategy:
📘 Step-by-Step Accumulation Example:
Stock ABC trades at ₹100.
Institution wants to buy 5 lakh shares.
If they buy all at once, the price may jump to ₹110+.
So they:
Break order into 5,000 share blocks
Buy at different times of day
Use different brokers/accounts to hide volume
Buy some shares in dark pool
Use algorithm to monitor market depth
After 2 weeks, they complete the buy at an average price of ₹101.
Once they have the position, they might release news or earnings upgrades to support the price.
They hold till price hits their target (say ₹130), then start distributing in small blocks again.
👁 How to Spot Institutional Activity as a Retail Trader?
While you can’t directly see them, you can learn to follow the footprints:
🔍 Clues of Smart Money Activity:
Unusual volume on low-news days
Breakout with high volume but small price move
Price holding key levels repeatedly (support/resistance)
Option open interest buildup
Low volatility periods followed by volume spike
Multiple rejections from the same price zone (indicating accumulation/distribution)
🧠 Mindset of Institutional Traders
What makes institutions successful is not just tools or money — it’s their discipline, planning, and patience. Key principles:
Capital preservation first
Risk-to-reward must be favorable
Avoid emotional decisions
Backtesting before executing strategies
Long-term consistency over short-term wins
📌 Summary – What Can We Learn?
Institutional trading is not magic — it’s structured, logical, and data-driven. As a retail trader, you can’t beat them in speed or capital, but you can:
✅ Learn how they operate
✅ Use similar risk management
✅ Follow the smart money
✅ Avoid emotional trades
✅ Focus on long-term skill building
🏁 Final Thought
The goal isn’t to copy institutional trades, but to understand their footprint and align your trades with their flow. Most successful retail traders grow by observing how smart money moves, then reacting wisely.
You don’t need ₹100 crore to trade like an institution — you need a strategic mindset, discipline, and a plan.

NIFTY Intraday Trade Setup For 28 Jul 2025NIFTY Intraday Trade Setup For 28 Jul 2025
Sell_1- From 24990
Invalid-Above 25040
T- 24800
Bearish-Below 24800
Invalid-Above 24850
T- 24620
NIFTY has closed on a bearish note, ended near lowest point of the week. Index has closed below 50 and 21 EMA both. Its sell on rise market till it is below 50 EMA. Support lies near 24150, 24450 will be a confluence zone in between. Following the sell on rise approach, On Monday 25k zone will be a resistance area to plan a short. On flat opening, below 24800 will be a simple short planning towards 24600 zone.
In case of a big gap up/down, wait till 10 o'clock and mark the high and low of the trading range (5MIN). Trade on this range breakout.
==========
I am Not SEBI Registered
This is my personal analysis for my personal trading. Kindly consult your financial advisor before taking any actions based on this.

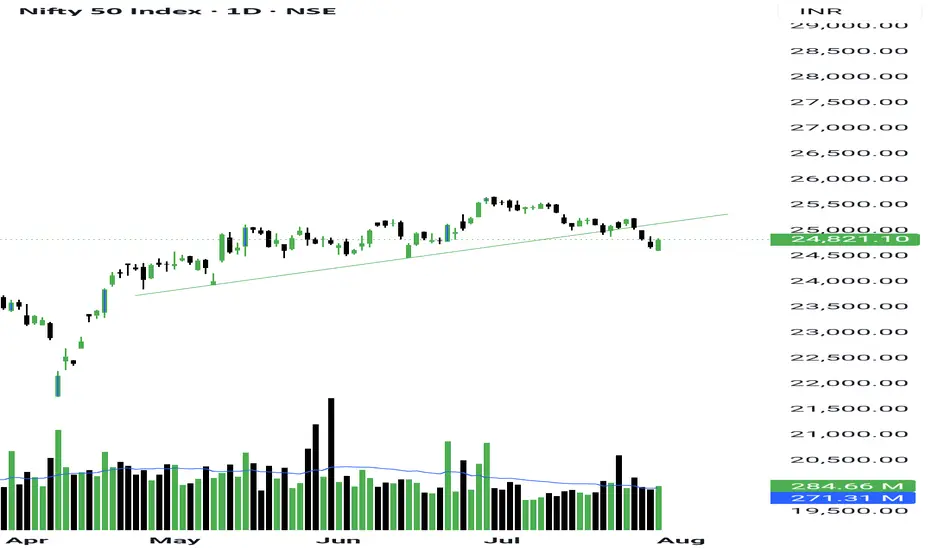
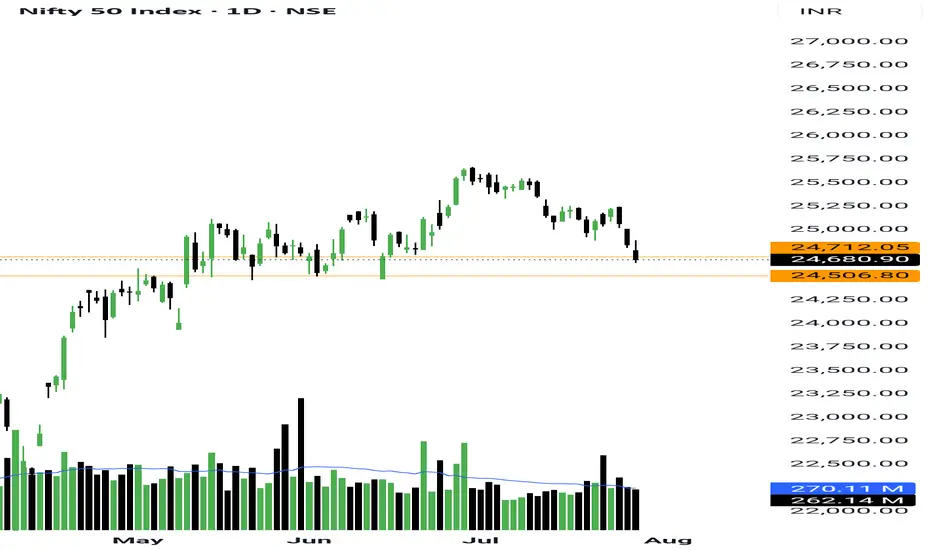
Nifty50 Trend Analysis Daily TFNifty 50 is currently in a corrective phase, forming wave 4 on the daily time frame. Given the long-term bullish outlook of the market, wave 4 is expected to be a shallow correction, potentially ending around 24,821 or 24,311. A deep correction down to 23,898 is also possible, but the probability of this is low—around 10%, unless wave 5 becomes trapped in a complex triple-three corrective pattern.
The direction of Nifty 50 is strongly correlated with Reliance Industries' price movement. If Reliance fails to reverse from the ₹1,373 level, it may drop further to ₹1,332. In that case, Nifty 50 is unlikely to regain bullish momentum and may continue to consolidate sideways until Reliance completes its correction.
Key Levels to Watch:
Nifty 50: 24,821 (shallow correction), 24,311 (support), 23,898 (deep correction - low probability)
Reliance Industries: ₹1,373 (key support), ₹1,332 (deep correction level)
A strong bullish rally in the broader market is likely only if Nifty 50 finds support around 24,821 and Reliance reverses from ₹1,373.
