NIFTY Analysis – 18 july 2025 ,morning update at 9 amTechnical Summary
Daily Candle:
Nifty formed a negative candle after a Doji, indicating potential weakness or indecision turning bearish.
which is a sign of weakness.
Expected Opening:
May open flat near 25143 (critical level).
Upside move possible to 25218, but likely to consolidate.
Key Observation:
If Nifty fails to sustain above 25143, downside possible towards:
25023 (1st support)
24931 (2nd support)
Strategy Advice:
Wait for a clear pattern formation.
Use BOD (Buy on Dip) or SOR (Sell on Rise) strategy.
Scalping preferred due to expected sideways move.
oday's market likely to be range-bound to weak unless strong buying comes above 25143.
Avoid aggressive trades early. Watch for confirmation.
Scalping with tight SL or quick exits is preferred.
What is Sideways or Consolidation?
Sideways market = Price moves between a narrow range without clear direction.
Consolidation = Market takes a pause after a trend (up or down) and moves within a range before the next breakout.
Today's Expected Sideways / Consolidation Range in NIFTY (Spot):
Range Type Price Range (Spot)
Sideways Zone 25143 to 25218
Lower Consolidation Range 25023 to 25143
Expanded Range (if breakout) 24932 to 25278
Niftyprediction

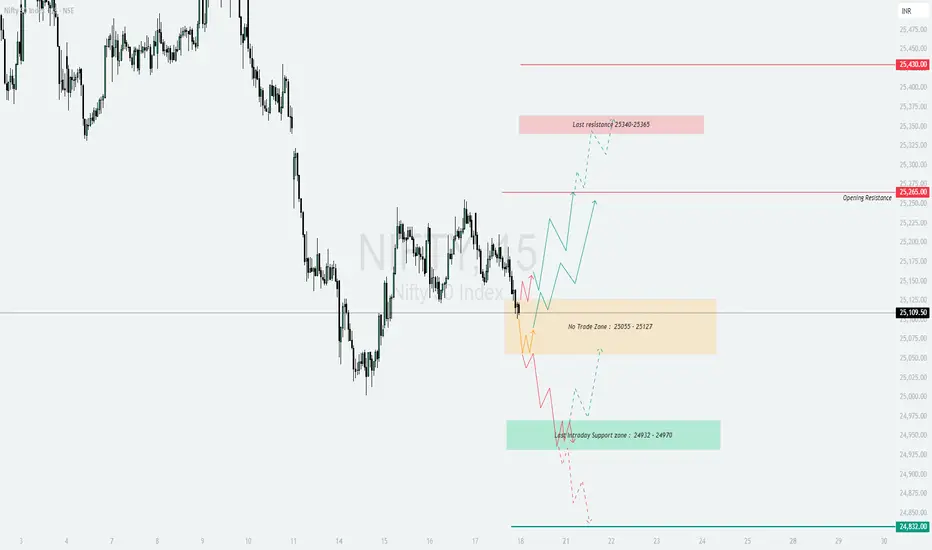
NIFTY - Trading levels and plan for 18-July-2025📊 NIFTY INTRADAY TRADING PLAN – 18-Jul-2025
Gap Opening Consideration: 100+ points from previous close
📍 KEY LEVELS TO MONITOR
🟥 Last Resistance: 25,340 – 25,365
🟥 Major Resistance: 25,430
🟧 Opening Resistance: 25,265
🟨 No Trade Zone: 25,055 – 25,127
🟩 Last Intraday Support Zone: 24,932 – 24,970
🟢 Major Support: 24,832
🚀 SCENARIO 1: GAP-UP OPENING (Above 25,365) 📈
(Gap-up considered as 100+ points above previous close)
If Nifty opens above 25,365 , it indicates bullish strength. Wait for a pullback near 25,340–25,365 for potential long entries.
If price sustains, expect a possible rally toward 25,430+ , which is the next resistance zone.
Avoid chasing entries; use 15–30 min candle confirmation to avoid false breakouts.
Options Strategy: Focus on ATM or slightly OTM Call Options or try a Bull Call Spread for limited risk.
⚖️ SCENARIO 2: FLAT OPENING (Between 25,055 – 25,127) 🟠
(Flat range aligns with the No Trade Zone )
This is a tricky zone with indecision between bulls and bears. Avoid initiating any trade immediately.
If Nifty breaks and sustains above 25,127 , bullish bias may emerge toward 25,265 – 25,340 .
On breakdown below 25,055 , a short trade setup opens targeting 24,932 – 24,970 zone .
Wait for clear hourly close before taking action in either direction.
Options Strategy: Consider Strangle or Iron Fly strategies for range-based volatility exploitation.
📉 SCENARIO 3: GAP-DOWN OPENING (Below 24,932) 🚨
(Gap-down considered below previous close by 100+ points)
If Nifty opens below 24,932 , monitor price action near the 24,832 major support .
If the support fails and prices break down below 24,832 , expect further downside pressure.
However, if price finds buying interest at 24,832 and bounces, you may consider scalping long with tight stop loss.
Options Strategy: Deploy ATM or ITM Put Options or Bear Put Spreads to play downside with defined risk.
💡 RISK MANAGEMENT & OPTIONS TRADING TIPS
🛑 Never risk more than 1–2% of your capital on any single trade.
⏳ Avoid entering trades during the first 15–30 minutes ; let volatility settle.
📉 Use Hourly candle close to determine validity of breakouts/breakdowns.
⚖️ Prefer spread strategies like Bull Call or Bear Put to cap your risk.
🧠 Avoid revenge trading after losses—stick to your trading plan.
📌 SUMMARY & CONCLUSION
Bullish View: Above 25,365, look for long opportunities up to 25,430 with stop-loss below 25,340.
Range-Bound View: Between 25,055–25,127 (No Trade Zone) – wait for breakout/breakdown confirmation.
Bearish View: Below 24,932 – focus on support at 24,832; breach can accelerate fall.
Action Plan: Wait for price behavior near key levels before committing capital.
⚠️ DISCLAIMER: I am not a SEBI-registered analyst. This analysis is for educational and informational purposes only. Please consult your financial advisor before taking any trade or investment decisions.
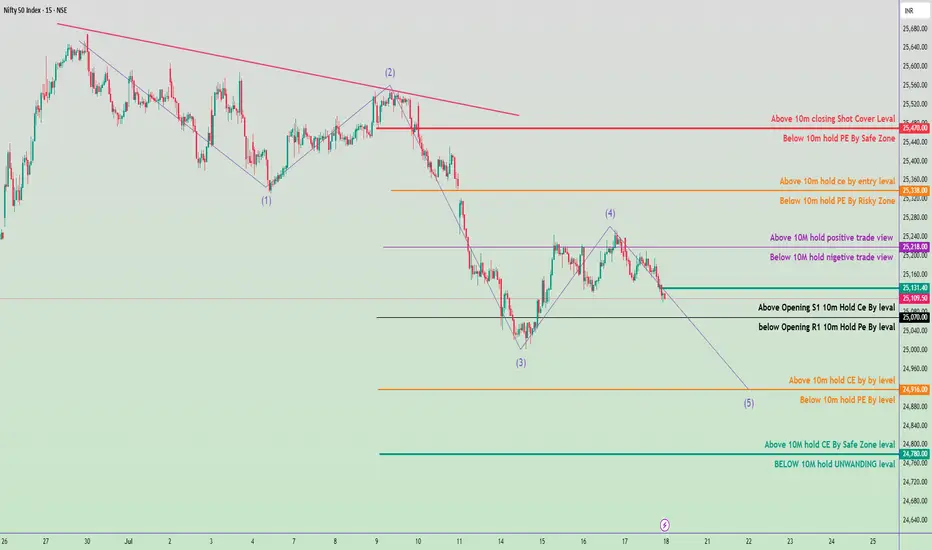
Trade plan for tomorrow (July 18, 2025)📈 Bullish Trade Plan (Alternative Scenario)
✅ S etup 3: Call Option Trade (CE)
Trigger: Price moves above 25,218 with volume
Action: Buy 25,200 CE or 25,300 CE
Target 1: 25,338
Target 2: 25,470
Bearish Trade Plan (Primary Bias)
✅ Setup 1: Directional Put Option Trade (PE)
Trigger: Break below 25,070
Action: Buy 25,000 PE or 24,900 PE
Target 1: 25,000
Target 2: 24,916
Target 3: 24,780
Current Context:
Nifty is forming a classic Elliott Wave pattern, currently likely in Wave (5) down.
Trend: Bearish bias unless 25,218 is reclaimed.
Key Support Zone: 25,070 – 25,000
High Probability Target for Wave (5): Around 24,780–24,760
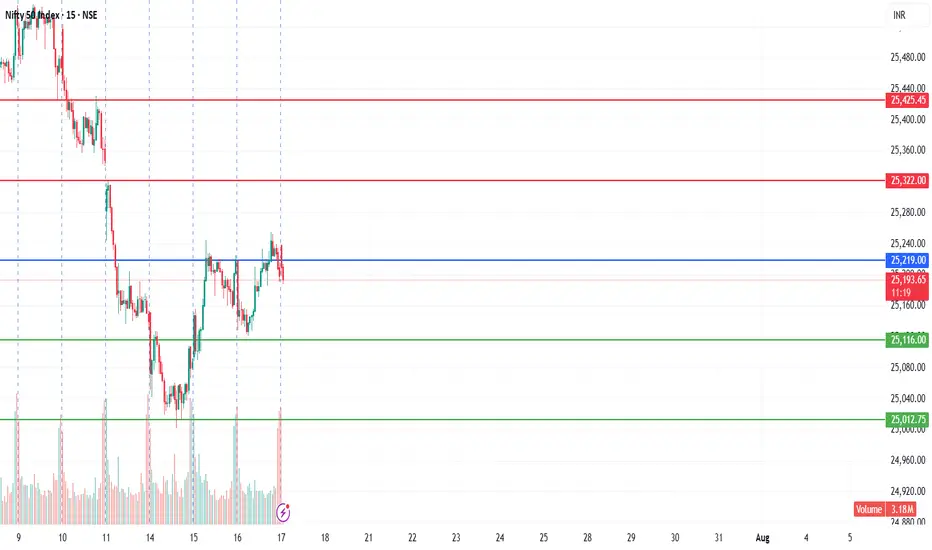
Nifty Key Levels for 17.07.2025Nifty Key Levels for 17.07.2025
If Nifty breaks the upper or lower range, we can expect momentum. The consolidation zone will be favorable for option sellers,while a breakout on either side will benefit option buyers.
Disclaimer:
I'm not a SEBI Registered financial advisor. These views are purely educational in nature. You are solely responsible for any decisions made based on this research.
NIFTY Analysis – 17 july 2025 ,morning update at 9 am1. Chart Pattern Observation
Pattern Formed: Doji candle on the 1-day chart
Interpretation: A Doji signifies indecision in the market; buyers and sellers are at equilibrium. It often indicates a potential reversal or pause in trend.
2. Pre-Market Analysis Strategy
using 1-hour chart
Calculation FEB mark 38.2% false level.
📍 Observation: Nifty closed just below 38.2% level for the 2nd day.
➤ Implication: Indicates reluctance to move higher. Watch closely near open.
🟡 3. Expected Market Behavior Today
Opening Price Expectation: Flat near 25220
Upside Resistance Test: May attempt 25278, with possible sideways consolidation.
Bottleneck Pattern Watch (5-min chart):
If formed → Short covering rally may push Nifty towards 25345
🔴 4. Downside Risk Scenario
Critical Support Level: 25221
If not sustained → Could fall to 25143
Strategy: Wait for confirmation before taking positions.
Scalping Recommended: Only after confirming price action patterns
5. Support & Resistance Levels Today
✅ Support:
25143
25023
24932
✅ Resistance:
25278
25345

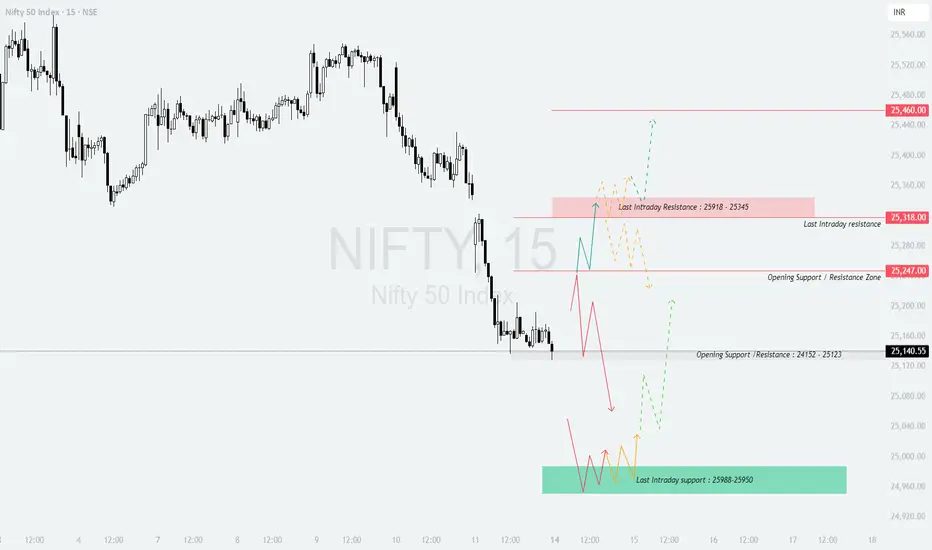
NIFTY : Trading plan and levels for 17-July-2025📊 NIFTY INTRADAY TRADING PLAN – 17-Jul-2025
200+ Points Gap Opening Considered Significant | Educational Structured Trading Plan
📍 KEY ZONES & LEVELS TO MONITOR
🟥 Opening Resistance Zone: 25,376 – 25,340
🔴 Last Intraday Resistance: 25,430
🟧 Opening Support Zone: 25,083 – 25,102
🟩 Last Intraday Support Zone: 24,932 – 24,970
🚀 SCENARIO 1: GAP-UP OPENING (Above 25,376) 📈
If NIFTY opens above 25,376 with 100+ points gap-up, expect buyers to dominate initially, pushing towards 25,430 (Last Intraday Resistance) .
Avoid aggressive longs exactly at the open. Let the first 15-minute candle settle to confirm strength.
If price sustains above 25,430 with volume, look for further upside, but be mindful of exhaustion near round numbers.
Options Tip: Prefer ATM Call Options with tight stop-loss or Bull Call Spread to manage risk better.
📊 SCENARIO 2: FLAT OPENING (Between 25,102 – 25,376) ⚖️
This range marks the consolidation area between Opening Support and Opening Resistance Zone .
Price behavior here is crucial for intraday direction bias.
If price holds above 25,224.40 post-open, bias is slightly bullish towards the Resistance Zone.
If price breaks below 25,102 , sellers may drag it towards Last Intraday Support 24,932 – 24,970 .
Options Tip: Consider Iron Fly or Strangle setups if premiums are attractive. Be patient for breakouts.
📉 SCENARIO 3: GAP-DOWN OPENING (Below 25,083) ⚠️
If NIFTY opens below 25,083 with 100+ points gap-down, expect weakness to persist.
Primary downside target becomes Last Intraday Support Zone: 24,932 – 24,970 .
Sell-on-rise strategy is preferred after 15-minute candle confirmation below 25,083 .
Options Tip: Focus on ATM or ITM Put Options or use Bear Put Spreads for safer execution.
💡 RISK MANAGEMENT TIPS FOR OPTIONS TRADERS
📏 Always risk only 1–2% of total capital per trade.
⏳ Avoid trades during the first 15–30 minutes to let volatility settle.
🔐 Respect Hourly Candle Close stops rather than reacting to wicks.
⚖️ Prefer Spreads and Hedged Strategies in highly volatile or uncertain conditions.
🚫 Avoid over-leveraging especially in expiry week or event-heavy days.
📌 SUMMARY & CONCLUSION
Bullish Bias: Gap-up above 25,376 → Target 25,430
Neutral Range: Between 25,102 – 25,376 → Wait for breakout confirmation
Bearish Bias: Gap-down below 25,083 → Target 24,932 – 24,970
Trade with a calm mindset, respecting the levels and waiting for candle confirmations to reduce false entries.
⚠️ DISCLAIMER: I am not a SEBI-registered analyst. This plan is purely for educational and informational purposes. Always consult your financial advisor before making any investment decisions.

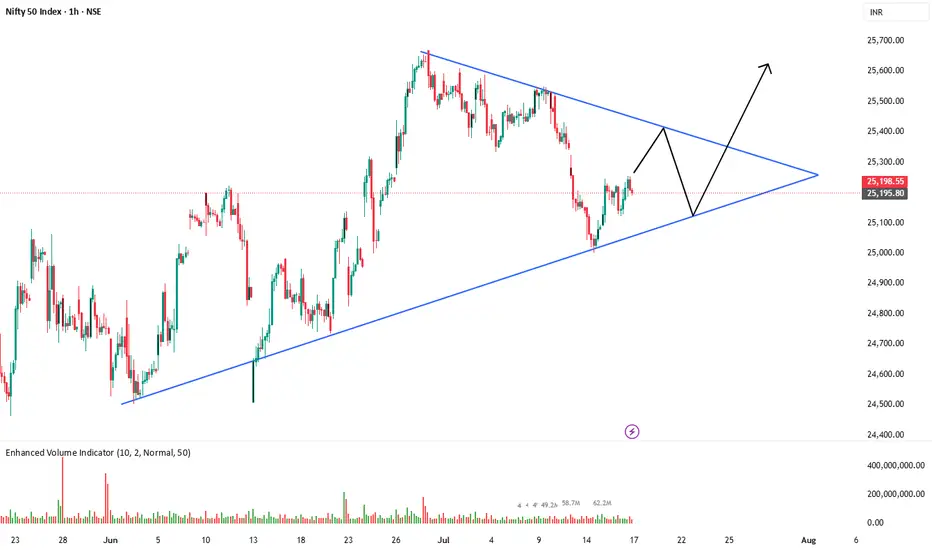
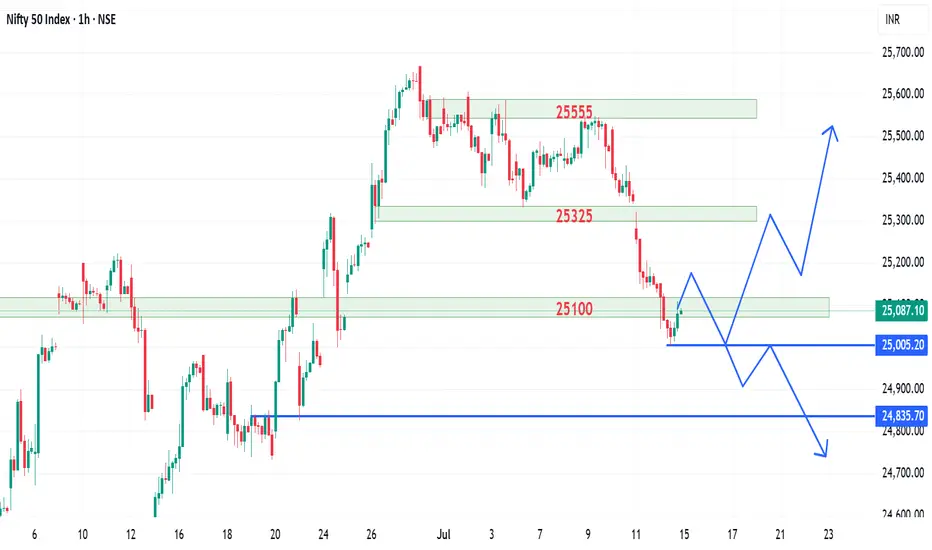
Nifty 50 - Symmetrical Triangle Breakout WatchNifty is currently consolidating within a symmetrical triangle pattern on the 1-hour chart. Price is respecting both the rising support and descending resistance trendlines.
Key observations:
Clear higher lows indicate underlying bullish pressure.
Lower highs show selling pressure near resistance.
Expecting a possible pullback toward the lower trendline before a potential breakout to the upside.
Trade Plan (if breakout occurs):
📈 Bullish breakout above the upper trendline could lead to a sharp rally.
✅ Confirmation needed with strong volume and candle close above resistance.
Invalid if price breaks below the support trendline.
Stay alert for a breakout or breakdown — both scenarios possible, but current structure slightly favors bulls.
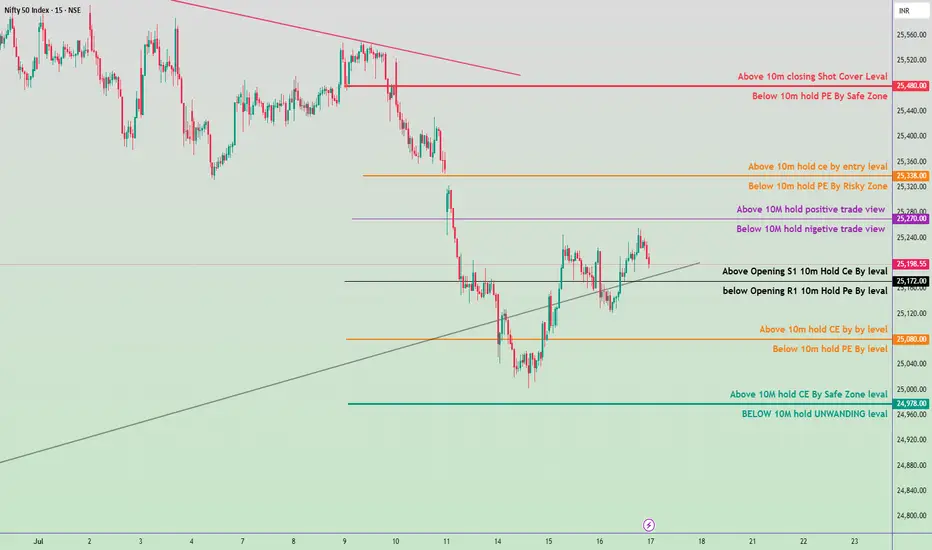
Nifty 50 Intraday Trade Plan - 17 July 2025🔴 Bullish Scenario (CE Buy Zones):
Above 25,480 → Shot Cover Level
→ CE BUY with strong momentum.
Above 25,338 → Entry Level for CE
→ CE BUY possible; moderate conviction.
Above 25,270 → Positive Trade View Starts
→ Start building CE positions cautiously.
Above 25,198.55 (Opening S1 Level)
→ Intraday CE HOLD if already bought.
Above 25,080 → CE by Buy Level
→ Entry-level for CE if market recovers.
Above 24,978 → CE Buy Safe Zone
→ Safer entry for CE, if bounce observed.
🔵 Bearish Scenario (PE Buy Zones):
Below 25,480 → PE by Safe Zone
→ PE can be added gradually.
Below 25,338 → Risky Zone for PE
→ PE buy with risk, SL tight.
Below 25,270 → Negative View Begins
→ Confidence increases in PE position.
Below 25,172 (Opening R1 Level)
→ If breaks this, PE HOLD.
Below 25,080 → PE by Buy Level
Below 24,978 → UNWINDING Level
→ Expect strong selling; PE aggressive buy zone.
🎯 Key Zones to Watch:
Range Bound Zone: Between 25,172 – 25,270
Trend Decider Zone:
Break above 25,270: Bullish Bias
Break below 25,172: Bearish Bias

NIFTY : Trading plan for 16-Jul-2025📊 NIFTY 50 INTRADAY TRADING PLAN – 16-Jul-2025
Strategy prepared with 15-Min chart observation. Gap openings 100+ points considered significant for intraday volatility.
📍 IMPORTANT LEVELS TO WATCH
🟥 Opening / Last Intraday Resistance: 25,340
🟧 Opening Resistance / Support Zone: 25,225
🟧 Opening Support: 25,132 – 25,150
🟩 Last Intraday Support: 25,053
🟩 Buyer’s Support Zone: 24,950 – 24,981
🟥 Profit Booking Zone: 25,408 – 25,430
🚀 SCENARIO 1: GAP-UP OPENING (Above 25,340) 📈
If NIFTY opens above 25,340 , it indicates a strong bullish sentiment. However, watch for immediate profit booking around the Profit Booking Zone 25,408 – 25,430 .
Do not rush into trades immediately. Wait for a 15-minute candle close above 25,340 to confirm continuation.
If it fails to hold 25,340, there can be a quick dip toward 25,225 again.
Options Tip: Prefer ATM or Slightly ITM CE for momentum continuation. Avoid far OTM options due to theta risk on gap-up days.
📊 SCENARIO 2: FLAT OPENING (Between 25,132 – 25,225) 🔄
A flat opening suggests an indecisive mood. Watch how prices behave around Opening Resistance 25,225 and Opening Support 25,132 – 25,150 .
If price sustains above 25,225 with good volume, expect a bullish move toward 25,340 .
If price breaks and sustains below 25,132 , expect weakness toward 25,053 or even 24,950 – 24,981 .
Options Tip: Use ATM Straddles/Strangles if market consolidates between 25,132 – 25,225 for premium decay setups.
📉 SCENARIO 3: GAP-DOWN OPENING (Below 25,053) ⚠️
A gap-down opening below 25,053 creates immediate bearish pressure. First downside support to monitor is 24,950 – 24,981 (Buyer’s Support Zone) .
If this zone holds, expect reversal buying with a stop-loss below 24,950 .
If 24,950 breaks, avoid fresh longs. Downtrend extension possible below this zone.
Options Tip: On gap-down days, prefer Bear Put Spreads or ATM Put Options for controlled risk instead of buying far OTM PEs.
💡 RISK MANAGEMENT TIPS FOR OPTIONS TRADERS
Risk only 1–2% of your capital per trade.
Avoid chasing prices in the first 15 minutes after the opening bell.
Prefer ATM/ITM options for directional trades.
Always mark Stop Loss and Stick to it strictly.
Control position sizing—don’t over-leverage on gap opening days.
📌 SUMMARY & CONCLUSION
Bullish Scenario: Above 25,340 → Target 25,408–25,430.
Range-Bound Scenario: Between 25,132 – 25,225 → Watch consolidation before acting.
Bearish Scenario: Below 25,053 → Target 24,950–24,981.
Always stay disciplined with entries and exits. Risk control should be your primary focus as an options trader.
⚠️ DISCLAIMER: I am not a SEBI-registered analyst. This trading plan is shared purely for educational purposes. Please do your own analysis or consult a certified financial advisor before acting on this information.

Nifty 50 – Intraday Plan for July 16, 2025📊 Intraday Key Levels & Strategy:
🔺 Upside Zones (CE Bias):
25,270 – Above 10M hold = Positive Trade View
25,390 – Above 10m hold CE by entry level
25,478 – Above 10m closing = Shot Cover Level
⚠️ Neutral to Mixed Zones:
25,120 – Above Opening S1: 10m Hold CE Buy Level
25,100 – Below Opening R1: 10m Hold PE Buy Level
25,070 – Below 10M = Negative Trade View
🔻 Downside Zones (PE Bias):
24,990 – Below 10m hold PE by level
24,920 – Below 10m hold PE = Risky Zone
24,880 – Above 10M = CE Safe Zone
24,860 – BELOW 10M = UNWINDING zone.
✅ Suggested Intraday Plan:
Bullish Scenario (CE Trades):
Buy CE above 25,120 (Only if 10 min candle holds).
Add on breakout & hold above 25,270.
Target zone: 25,390–25,478.
SL: Below 25,070.
Bearish Scenario (PE Trades):
Sell/Buy PE below 25,100 (Only if 10 min candle sustains).
Confirm further weakness if below 24,990 or 24,920.
Target zone: 24,880–24,860.
SL: Above 25,120.

Market Analysis and Nifty AnalysisIn this video, I have provided an overall market analysis. :
Although the market is green today, it's important to stay cautious.
Small caps are forming range-bound bullish engulfing candles, but we need to wait for the closing.
Nifty continues to form lower lows on the lower time frame. A reversal can be confirmed once strength appears on the lower time frame and is reflected in the daily chart.

NIFT : INTRADAY TRADING PLAN – 15-Jul-2025📊 NIFTY 50 INTRADAY TRADING PLAN – 15-Jul-2025
Planned according to the provided chart, focusing on Gap Opening 100+ points scenarios
💡 Previous Close: 25,067.10
⏱️ Timeframe: 15-Min Chart
⚙️ Gap Opening Threshold: 100+ Points considered significant
📍 IMPORTANT LEVELS
🟥 Last Intraday Resistance: 25,340
🟥 Opening Resistance: 25,210
🟧 Opening Support Zone: 24,949 – 25,020
🟩 Last Intraday Support: 24,949
🟩 Buyer's Support: 24,774
🚀 SCENARIO 1: GAP-UP OPENING (Above 25,210) 📈
If Nifty opens above 25,210 , it directly enters the resistance zone. Caution: Do not buy blindly on a gap-up as there is a risk of profit booking.
Wait for a 15-minute candle to close above 25,210 for confirmation. Post-confirmation, upside targets are 25,340 and possibly higher.
Failure to hold above 25,210 can lead to a quick reversal towards the Opening Support Zone 24,949 – 25,020 .
Options Tip: Prefer ITM CE options for momentum continuation. Avoid far OTM on gap-ups to manage theta decay risk.
📊 SCENARIO 2: FLAT OPENING (Between 25,020 – 25,210) 🔄
Flat openings near these levels suggest a balance between bulls and bears. Observe price behavior carefully in the first 15–30 minutes.
A sustained move above 25,210 opens room for bullish continuation up to 25,340 .
Failure to hold Opening Support 24,949 indicates weakness. Below this, prices can drift toward the Buyer's Support 24,774 .
Options Tip: Avoid buying options immediately after a flat open. Monitor structure. Focus on ATM Straddles/Strangles for premium selling if prices remain range-bound.
📉 SCENARIO 3: GAP-DOWN OPENING (Below 24,949) ⚠️
Gap-down below 24,949 brings immediate focus on Buyer's Support 24,774 .
If this zone holds, look for reversal buying opportunities with stop-loss below 24,774 .
A breakdown below 24,774 may trigger a larger downside. Be conservative in this scenario; wait for retest/rejection candles.
Options Tip: IV spike expected. Prefer Bear Put Spreads instead of naked PEs to manage risk and avoid premium erosion on rebounds.
💡 RISK MANAGEMENT TIPS FOR OPTIONS TRADERS
Stick to maximum 1–2% risk of total capital per trade.
Always observe the first 15–30 minutes before trading aggressively.
Use ATM/ITM strikes to control theta decay.
Respect key support/resistance zones. Do not overtrade.
Avoid chasing prices; let the market confirm direction post-gap.
📌 SUMMARY & CONCLUSION
Bullish Zone: Above 25,210 → Target 25,340.
Range Zone: 25,020 – 25,210 → Watch for structure clarity.
Bearish Zone: Below 24,949 → Target 24,774.
Trade mindfully and focus on capital preservation before chasing profits.
⚠️ DISCLAIMER: I am not a SEBI-registered analyst. This trading plan is shared for educational purposes only. Please do your own research or consult a qualified financial advisor before trading.

Nifty possible movement for the upcoming trading session.Nifty closed around the support zone forming a long lower tail showing some bullishness today.
Though the market has moved after a long time and can move on the either side.
Levels are marked and possible movements are also plotted.
Wait for the price action and trade accordingly.
Nifty 50 Intraday Trade Plan July 15, 2025🔴 Upper Resistance Levels:
25,430.00
🔺 Above 10m closing: Short Cover Level
🔻 Below 10m: Hold PE (Safe Zone)
25,280.00
🔺 Above 10m: Hold CE (Entry Level)
25,240.00
🔻 Below 10m: Hold PE (Risky Zone)
25,160.00
🔺 Above 10M: Hold Positive Trade View
🔻 Below 10M: Hold Negative Trade View
🟢 Current Zone:
Market is trading near 25,087.10
Watch levels:
25,030.00 – Above Opening S1: Hold CE by level
25,000.00 – Below Opening R1: Hold PE by level
🟠 Lower Support Levels:
24,960.00
🔺 Above 10m: Hold CE by level
24,920.00
🔻 Below 10m: Hold PE by level
24,800.00
🔺 Above 10M: Hold CE by Safe Zone
24,760.00
🔻 Below 10M: UNWINDING Level
🔍 Strategy Suggestions:
✅ Bullish Bias:
If price sustains above 25,160, consider Call Option Buy (CE) or bullish trades.
❌ Bearish Bias:
If price fails below 25,030 or 24,920, consider Put Option Buy (PE) or short positions.

NIFTY : Trading levels and Plan for 14-Jul-2025b]📊 NIFTY 50 INTRADAY PLAN – 14 JULY 2025 (15-Min Chart Study)
Educational insights for all opening scenarios: Gap-Up, Flat, and Gap-Down.
📍 Previous Close: 25,140.55
📌 Gap opening threshold considered: 100+ points
⏱️ Tip: Let the first 15–30 minutes settle before entering trades based on levels.
📌 KEY LEVELS TO MONITOR
Resistance Zone: 25,460
Last Intraday Resistance: 25,318
Opening Support / Resistance Zone: 25,247
Opening Support / Resistance Zone: 25,152 – 25,123
Last Intraday Support Zone: 25,088 – 25,050
🚀 SCENARIO 1: GAP-UP OPENING (Above 25,247) 📈
Bias: Bullish continuation possible
If Nifty opens above 25,247 , watch for continuation towards 25,318 (Last Intraday Resistance) .
Sustainable strength above 25,318 can lead to 25,460 . That’s the upper profit booking zone.
If price shows exhaustion candles near 25,460, avoid fresh longs. Instead, look for selling opportunities with tight stop-loss.
Options Traders: Prefer ATM or slightly ITM calls; avoid chasing far OTM CE after gap-up. Time decay will be sharp in such cases.
📊 SCENARIO 2: FLAT OPENING (Near 25,140 – 25,152) 🔄
Bias: Neutral-to-bearish bias
If the market opens around 25,140 – 25,152 , focus on whether the 25,152 – 25,123 zone holds as support or flips as resistance.
If price holds above 25,152, there’s potential for a bounce towards 25,247.
If price breaks and sustains below 25,123, expect a gradual drift towards the Last Intraday Support: 25,088 – 25,050 .
Avoid quick trades here — observe the first 30 minutes’ range before committing capital.
📉 SCENARIO 3: GAP-DOWN OPENING (Below 25,050) ⚠️
Bias: Bearish with bounce attempt from lower supports
If Nifty opens below 25,050 , immediate attention should be given to Last Intraday Support: 25,088 – 25,050 .
If that zone breaks, next major support becomes psychological round numbers or extreme supports which may form intraday.
Aggressive selling should only be considered if prices show no reaction around this zone. Watch for hammer or reversal patterns before taking contra long trades.
Options Traders: Avoid buying deep OTM puts after a large gap-down as premiums often get inflated due to IV spikes.
💡 OPTIONS TRADING – RISK MANAGEMENT TIPS
Focus on ATM or ITM strikes to reduce theta impact on both CE and PE buying.
Apply Stop-Loss based on 15-minute candle closes instead of absolute price ticks to avoid noise.
If VIX is high, hedge with vertical spreads instead of naked options buying.
Strictly maintain a 1–2% max risk of your capital per trade.
Avoid over-trading after 2:45 PM as theta erosion accelerates in options.
Keep tracking Bank Nifty as well for broader market cues.
📌 SUMMARY & CONCLUSION
Bullish Trigger: Above 25,247 → Target 25,318 – 25,460
Neutral Zone: 25,140 – 25,152 → Wait and watch zone
Bearish Trigger: Below 25,123 → Watch 25,088 – 25,050 for bounce
Keep your discipline intact and avoid emotional trades.
Options premium decay is real — always respect time and structure.
⚠️ DISCLAIMER: I am not a SEBI-registered analyst. This trading plan is for educational purposes only. Please do your own analysis or consult with a financial advisor before making trading decisions.
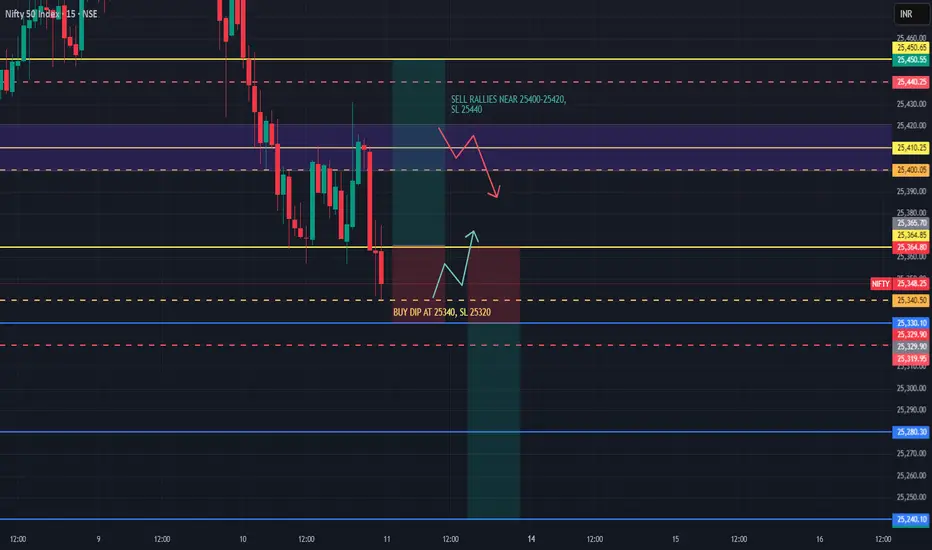
NIFTY INDEX INTRADAY LEVELS ( EDUCATIONAL PURPOSE ) 11/07/2025📈 Nifty 50 Index Intraday Trade Plan – 11 July
🕒 Analysis on 15-min | Trades on 1-min TF
🔍 Market Context:
Nifty is approaching key support zone near 25,340–25,350
If broken, downside momentum expected
If it holds, intraday bounce possible
🟢 BUY Setup (Bounce from Support Zone)
✅ BUY above 25,365
🎯 Target 1: 25,410
🎯 Target 2: 25,450
🛑 Stop Loss: 25,330
🔎 Entry Trigger: Bullish engulfing or strong 1-min green candle after bounce
🔴 SELL Setup (Breakdown of Support)
✅ SELL below 25,330
🎯 Target 1: 25,280
🎯 Target 2: 25,240
🛑 Stop Loss: 25,365
🔎 Entry Trigger: Volume spike on breakdown; avoid first red candle trap
⚠️ Flat Opening (Between 25,340–25,365)
🔄 Range Play until breakout
🔁 Buy dips at 25,340 with SL: 25,320
🔁 Sell rallies near 25,400–25,420 with SL: 25,440
⚙️ 1-Min Scalping Tips
🕔 Wait 5 mins post market open
🚫 Avoid trading in first 1–2 candles unless breakout/breakdown confirmed
🔍 Volume + structure-based confirmation needed
📊 Follow strict 1:2 risk-reward ratio
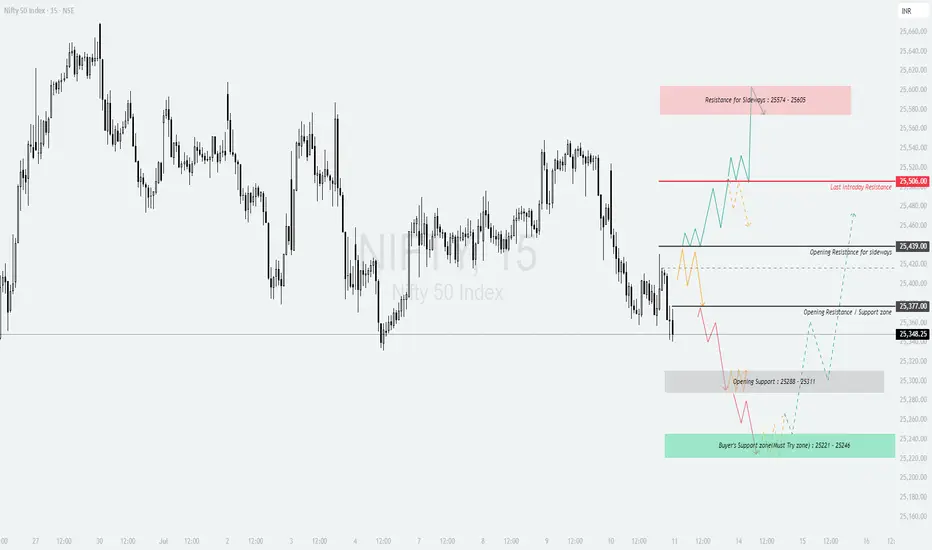
NIFTY: Trading levels and plan for 11-Jul-2025📈 NIFTY INTRADAY PLAN – 11 JULY 2025 (15-min TF)
A level-based, educational breakdown to help traders plan trades across opening scenarios.
📍 Previous Close: 25,348.25
📊 Consider 100+ points for Gap classification
⏱️ Pro Tip: Allow first 15–30 mins of price action to settle and confirm direction before entering trades.
📌 KEY ZONES TO MONITOR
Resistance for Sideways: 25,574 – 25,605
Last Intraday Resistance: 25,506
Opening Resistance for Sideways: 25,439
Opening Resistance/Support Zone: 25,377
Opening Support Zone: 25,288 – 25,311
Buyer's Support Zone (Must Try Zone): 25,221 – 25,246
🚀 SCENARIO 1: GAP-UP OPENING (Above 25,439)
Bias: Bullish but expect sideways to resistance at higher zones
If Nifty opens above 25,439 , it may retest the Last Intraday Resistance: 25,506 quickly.
Sustainable strength above this level can lead to the upper resistance zone between 25,574 – 25,605 , where profit booking is expected.
Avoid fresh CE buying if prices reach the top resistance zone too quickly after open – wait for price cooling or consolidation.
On sharp gap-up days, wait for a pullback to 25,439 to see if it acts as support before continuing higher.
📊 SCENARIO 2: FLAT OPENING (Near 25,348 – 25,377)
Bias: Neutral-to-bearish depending on early structure
If Nifty opens flat between 25,348 – 25,377 , it may face immediate selling pressure.
Support lies around 25,288 – 25,311 ; bulls will try to defend this zone.
Breakdown below this zone can trigger a drift toward Buyer’s Support Zone: 25,221 – 25,246 , which is ideal for reversal trades.
Look for strong reversal candles like hammer or engulfing patterns at buyer's zone to take call side trades.
📉 SCENARIO 3: GAP-DOWN OPENING (Below 25,288)
Bias: Bearish with potential buy-on-dip opportunities
If Nifty opens below 25,288 , initial support comes in the Buyer’s Support Zone: 25,221 – 25,246 .
Watch for price reaction here – if bulls defend this zone, expect a sharp bounce-back move.
If this zone is breached with volume, don’t force counter-trades – wait for re-entry signals above 25,246 again.
On the bounce, target toward 25,311 – 25,377, but trail stop as we approach resistance.
💡 OPTIONS TRADING – RISK MANAGEMENT TIPS
Use ATM or ITM options to reduce the impact of time decay, especially in sideways zones.
Avoid trading aggressively in the first 5-minute candle — let price structure settle.
Stick to 15-min candle SL closing logic to reduce false stop-outs.
Avoid buying both CE & PE (straddle) blindly on volatile days — pick a side with confirmation.
If VIX is high, consider hedged strategies like spreads.
Secure profits early after 2:30 PM – avoid fresh entries late unless very high conviction.
📌 SUMMARY & CONCLUSION
Bullish Pathway: Above 25,439 with target toward 25,605
Neutral Zone: 25,348 – 25,377 (watch for confirmation)
Bearish Trigger: Below 25,288, eyes on reversal from 25,221 – 25,246
Observe volume, candle structure, and overall market tone to validate bias
Discipline and execution with risk control are more important than direction
⚠️ DISCLAIMER: I am not a SEBI-registered analyst. This analysis is for educational purposes only. Please consult your financial advisor before taking trades.
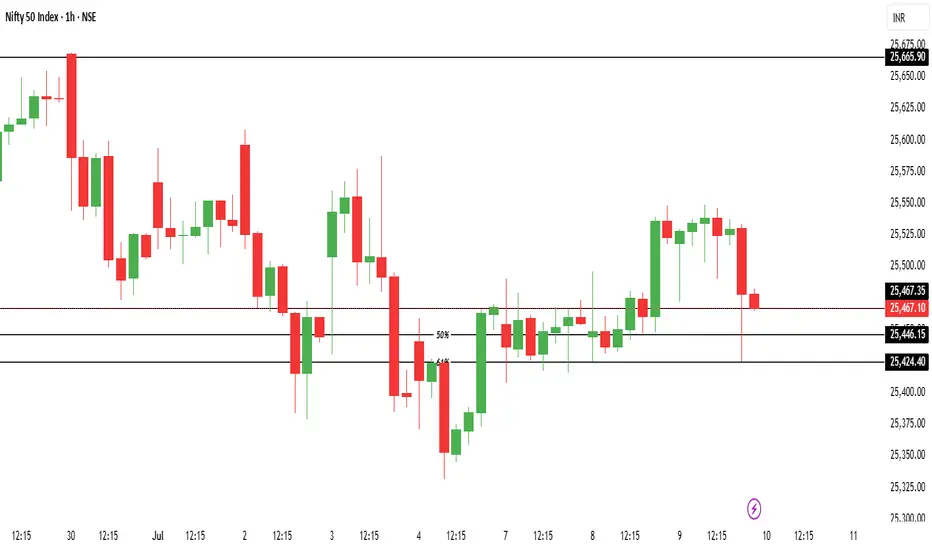
Nifty50 10-07-2025 Trend AnalysisNifty50 analysis 10-07-2025. Regardless the opening, long positions can be created at 25476 (PDC), 25446 or 25424 with swing/intraday potential targets 25665 & 25788.
NIFTY : Trading levels and plan for 10-Jul-2025📊 NIFTY INTRADAY PLAN – 10 JULY 2025 (15min TF)
Educational setup with key intraday levels and directional bias – Based on price behavior and reaction zones
📍 Reference Close: 25,467.10
📈 Consider Gap-up or Gap-down if the opening is 100+ points away from this close.
⏱️ Allow the first 15–30 minutes for volatility to settle before taking directional trades.
🔍 KEY LEVELS TO MONITOR
Opening Resistance: 25,582
Last Intraday Resistance: 25,621 – 25,644
No Trade Zone: 25,439 – 25,491
Last Intraday Support: 25,377
Buyer’s Support (Must Try Zone): 25,196 – 25,229
Major Resistance (Profit Booking Zone): 25,737
📈 SCENARIO 1: GAP-UP OPENING (Above 25,582)
Bias: Bullish to Consolidation at upper resistance
If Nifty opens 100+ points higher and sustains above 25,582 , upside may extend to 25,621–25,644 zone.
Watch for rejection candles or indecision near 25,644 – this is a potential supply zone.
If bullish momentum is strong, price may hit 25,737 , but caution near that level for profit booking.
Shorts only if strong reversal seen at resistance with volume and price failing to hold above 25,621.
📊 SCENARIO 2: FLAT OPENING (Within 25,439 – 25,491 – the No Trade Zone)
Bias: Wait & Watch – Let the market show its hand
Flat openings inside the No Trade Zone (25,439–25,491) often lead to whipsaws and indecisive moves.
Avoid taking trades inside this zone unless price breaks out or breaks down with strength.
Upside breakout above 25,491 should retest 25,582; downside breakdown below 25,439 may lead to support testing at 25,377.
Best strategy is to wait for directional clarity before entering trades.
📉 SCENARIO 3: GAP-DOWN OPENING (Below 25,377)
Bias: Bearish to Neutral – Watch for demand reaction
A 100+ point gap-down opening below 25,377 will take price closer to Buyer’s Support Zone (25,196–25,229) .
Observe buyer activity in this green zone – a bullish engulfing or hammer can provide bounce trades.
Avoid fresh shorts in this area unless there’s a breakdown below 25,195 with volume.
Any recovery from this support can revisit 25,377 or even test No Trade Zone.
💡 OPTIONS RISK MANAGEMENT TIPS:
Avoid directional trades in the first 15 minutes of the market
Don’t trade blindly inside No Trade Zones – wait for breakout confirmation
Use spreads (Bull Call/Bear Put) instead of naked options in choppy markets
Avoid overleveraging, especially around volatile zones like 25,582 and 25,196
Respect time decay – avoid buying weekly options post 2 PM unless clear momentum
Use strict SL (based on 15min candle close) to control emotional trades
📌 SUMMARY – KEY TAKEAWAYS
Bullish above 25,582 – but resistance ahead at 25,644–25,737
Sideways in 25,439–25,491 – best to stay out
Bearish or bounce watch below 25,377 – strong support at 25,196–25,229
Plan the trade, and trade the plan. React, don’t predict.
⚠️ DISCLAIMER: I am not a SEBI-registered analyst. All views shared here are for educational purposes only. Please consult your financial advisor before making any trading decisions.

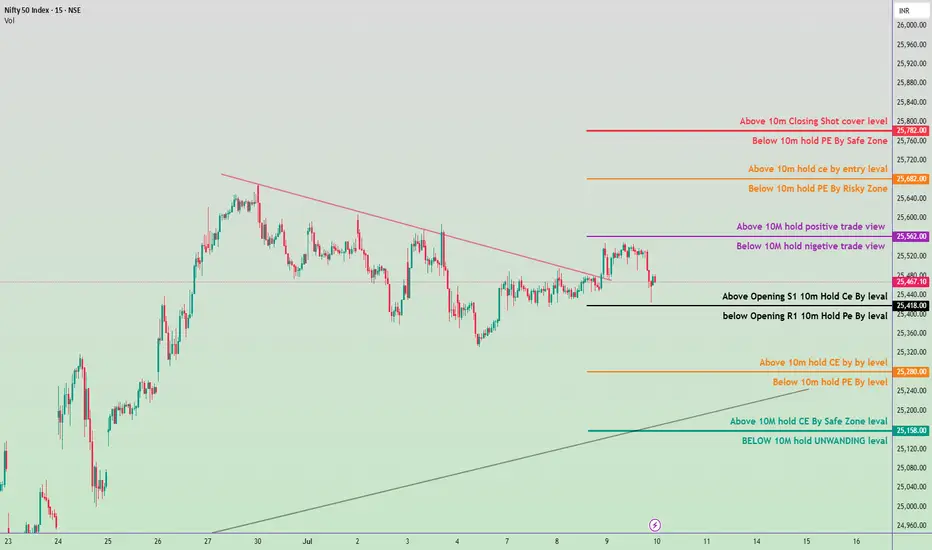
Nifty 50 Intraday Trade Plan 10 july 2025🟣 1. Trend Confirmation Zone (Level: 25,562.00)
Above 25,562.00 → Positive View Active
If Nifty sustains above this level for more than 10 minutes, it indicates bullish momentum. Call Option (CE) traders can stay in the trade or consider new entries.
Below 25,562.00 → Negative View Active
If Nifty stays below this level, bearish momentum is likely. Put Option (PE) trades are favorable.
⚫ 2. Opening Range Levels
Above 25,467.10 (Opening S1) → Hold CE (Call Option)
If the market holds above this after the opening 10-minute candle, you can go long (buy CE).
Below 25,418.00 (Opening R1) → Hold PE (Put Option)
If Nifty breaks this level on the downside, and sustains for 10 mins, it suggests weakness – PE trade is favorable.
🟠 3. Entry-Level Zone
Above 25,682.00 → Entry for CE (Call Option)
Bullish breakout level – good for fresh buying positions if sustained above.
Below 25,682.00 → Risky PE (Put Option) Zone
Aggressive traders may consider short trades, but this is a risky area.
🔴 4. Safe Zone for Positional Traders
Above 25,782.00 → Closing Shot / Cover Level
Indicates overbought or strong bullish continuation – exit PE positions if short.
Below 25,760.00 → Safe Zone for PE
A good place to hold PE (put) positions, as the market is weak below this.
🟠 5. Support Resistance Flip Zone
Above 25,280.00 → CE Hold Level
Support for intraday buyers. A bounce from here can give a CE opportunity.
Below 25,280.00 → PE Hold Level
Breaking this means more downside is likely – favorable for PE.
🟢 6. Strong Support / Breakdown Level
Above 25,158.00 → CE Safe Zone Level
Indicates strong buying support. If held, expect intraday recovery.
Below 25,158.00 → Unwinding Level
Panic selling or unwinding of long positions may start. Avoid CE, prefer PE.
Shukra Pharmaceuticals Ltd – Long Bias Trade SetupShukra Pharmaceuticals is currently showing signs of bullish intent after breaking out of a well-defined consolidation range. The stock formed a series of higher lows, indicating accumulating buying pressure, and recently broke above a key resistance level with strong momentum.
The breakout candle was large and decisive, closing near its high, which signals confidence among buyers. Following the breakout, price has started to establish a new base just above the previous resistance — now acting as support — a classic sign of strength and trend continuation.
Volume during the breakout session was notably higher than recent averages, reinforcing the conviction behind the move. Any shallow pullbacks toward the breakout zone or previous consolidation highs can provide low-risk buying opportunities.
If the current structure continues, the next leg higher may test prior supply zones or unfilled gaps visible on the left side of the chart.

Amara Raja Energy & Mobility Ltd. LongAmara Raja Energy & Mobility Ltd. is currently presenting a strong long trade opportunity, supported by a blend of bullish technical signals and long-term structural tailwinds in the EV and energy storage sectors.
Breakout Confirmation: The stock has recently broken out of a descending trendline that held since early 2024, on the back of above-average volume, signaling institutional interest.
Bullish Structure: A clean higher high, higher low formation is emerging on the Daily timeframe, indicating the early stages of a potential uptrend.
Support Zone: Price is retesting the key demand zone around ₹800–₹820, which acted as a major support-resistance flip level in the past.
Moving Averages:
21 EMA and 50 EMA have crossed bullishly with price holding above both, suggesting short- to medium-term strength.
200 EMA is flat-to-rising, showing long-term strength isn’t compromised.
MACD is turning upward with a fresh bullish crossover near the zero line — a sign of early momentum return.
RSI is comfortably above 55 but not overbought (~60–65), confirming room for upside without exhaustion.
