NIFTY : Trading plan and levels for 21-Jun-2025
\ 📊 NIFTY TRADING PLAN – 21-Jun-2025\
📍 \ Previous Close:\ 25,079.75
📏 \ Gap Threshold:\ 100+ points
🕒 \ Chart Reference:\ 15-minute timeframe
---
\
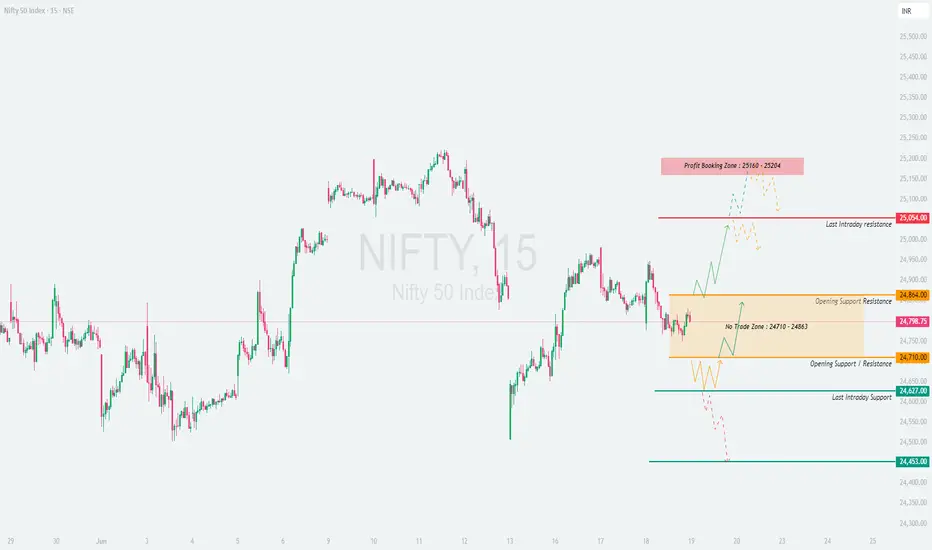
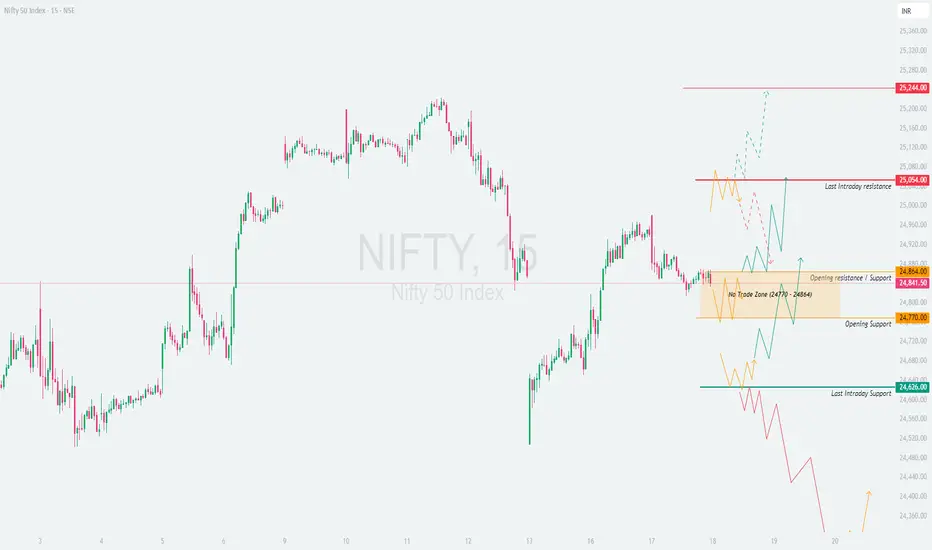
\ \ 🚀 GAP-UP OPENING (Above 25,244):\
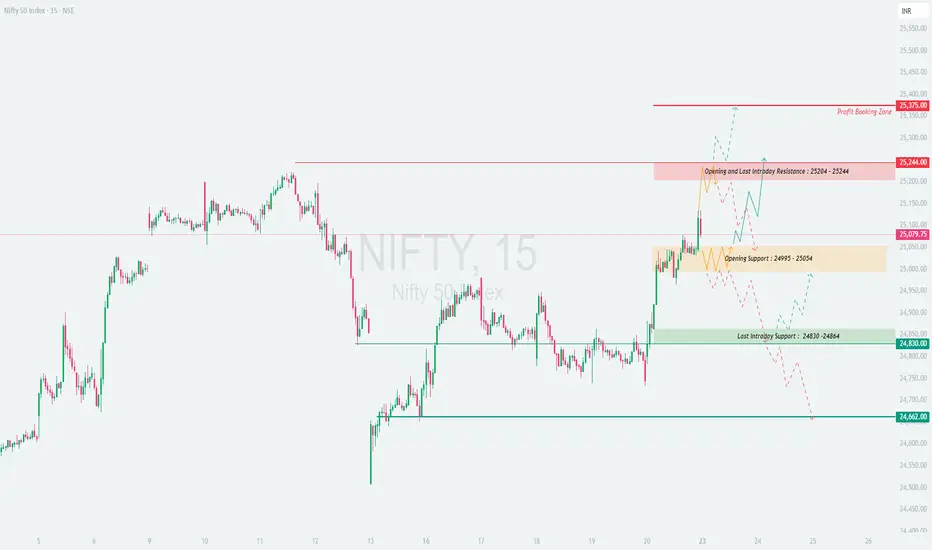
If Nifty opens above 25,244, it would break above the \ Opening & Last Intraday Resistance zone (25,204 – 25,244)\ , entering a profit-booking territory.
✅ \ Plan of Action:\
• Wait for 15–30 minutes for confirmation candles.
• If sustained above 25,244, bullish continuation is likely toward the \ Profit Booking Zone – 25,375+\ .
• However, if the index shows rejection near 25,244, expect a retest of the previous resistance zone.
🎯 \ Trade Setup:\
– Buy on a successful retest or breakout above 25,244
– Stop-loss: below 25,200
– Target: 25,350–25,375
📘 \ Pro Tip:\ Avoid impulsive longs on big gap-ups. Let price digest the gap and give a clear entry.
\ \ 📘 FLAT OPENING (Between 25,054 – 25,204):\
A flat opening places the index in a volatile consolidation zone between \ Opening Support (24,995 – 25,054)\ and resistance.
✅ \ Plan of Action:\
• Avoid trading inside the range of 25,054–25,204 due to fakeouts.
• Trade directional breakout from either side of this box:
– \ Above 25,204\ : Possible bullish breakout toward 25,350
– \ Below 24,995\ : Breakdown can push index to 24,864 or lower
🎯 \ Trade Setup:\
– Buy above 25,204 or sell below 24,995 with confirmation
– Tight SL (20–30 pts) is necessary inside this choppy zone
📘 \ Pro Tip:\ Avoid trading in the orange "Opening Support" zone unless a strong volume-based breakout or breakdown is seen.
\ \ 📉 GAP-DOWN OPENING (Below 24,864):\
A gap-down opening below the \ Last Intraday Support (24,864 – 24,830)\ signals early weakness in the market.
✅ \ Plan of Action:\
• First support to watch: \ 24,662\
• If price bounces from 24,662 with strength, short-covering may lead to a test of 24,864
• A breakdown below 24,662 can open doors to 24,500–24,420 levels
🎯 \ Trade Setup:\
– Short if price sustains below 24,830
– Stop-loss: above 24,880
– Buy only if sharp reversal seen at 24,662
📘 \ Pro Tip:\ Avoid panic selling. Wait for price to stabilize post-gap down and then decide.
---
\ 🛡 RISK MANAGEMENT & OPTIONS TRADING TIPS:\
✅ \ 1. Never chase trades at market open – observe price structure first\
✅ \ 2. For gap-ups, prefer debit spreads instead of naked calls to limit risk\
✅ \ 3. Don’t hold OTM options during range-bound action – decay is rapid\
✅ \ 4. Trail profits – especially after a breakout move hits your first target\
✅ \ 5. Respect volatility – no trade is also a trade in indecision zones\
---
\ 📌 SUMMARY – LEVELS TO WATCH FOR 21-Jun-2025:\
• 🔴 \ Resistance Zone:\ 25,204 – 25,244
• 🎯 \ Profit Booking Zone:\ 25,375
• 🟠 \ Opening Support Zone:\ 24,995 – 25,054
• 🟢 \ Last Intraday Support:\ 24,864 – 24,830
• 🔻 \ Breakdown Support:\ 24,662
💡 \ Summary Recap:\
• 🔼 Above 25,244 = Bullish momentum resumes
• ⏸ Between 25,054–25,204 = Sideways chop, avoid trades
• 🔽 Below 24,864 = Watch for sell pressure and bounce from 24,662
---
\ 📢 DISCLAIMER:\
I am not a SEBI-registered analyst. This trading plan is for educational and informational purposes only. Please consult your financial advisor before taking any market decisions. Trade safe and always manage your risk! ⚖️📉📈
Niftyprediction
NIFTY : Trading Plan and levels for 20-Jun-2025📊 NIFTY TRADING PLAN – 20-Jun-2025
📍 Previous Close: 24,744.70
📏 Gap Opening Threshold: 100+ points
🕰 Chart Timeframe: 15-min
🔼 GAP-UP OPENING (Above 24,852):
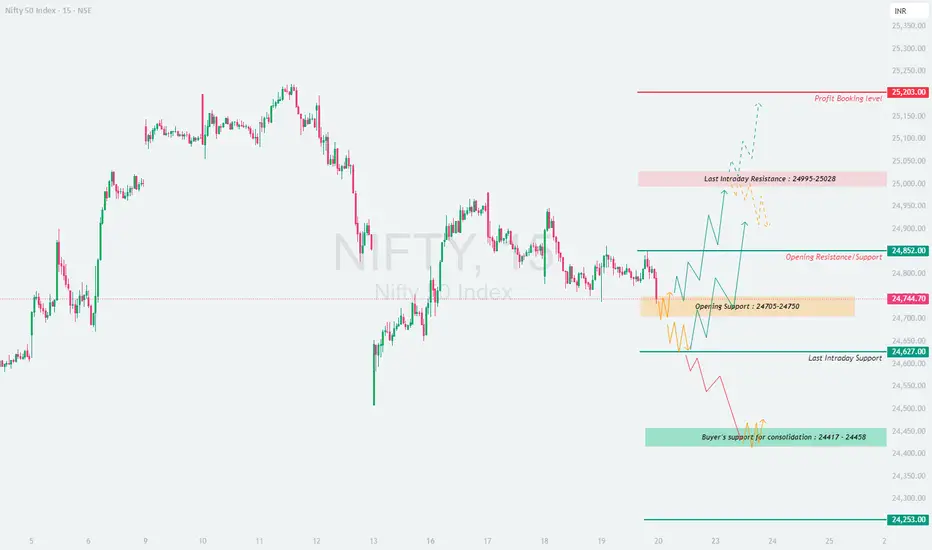
If Nifty opens more than 100 points higher, above the key zone of 24,852 (Opening Resistance/Support) , we step into a potential breakout scenario.
✅ Plan of Action:
• Let the first 15–30 min candles settle — especially if price opens near the Last Intraday Resistance zone (24,995 – 25,028) .
• Break and sustain above 25,028: Long trade possible toward Profit Booking Level – 25,203
• Price rejects 25,028 zone: Prepare for reversal trades back toward 24,852–24,750
• SL for longs can be below 24,950 if breakout sustains; use trailing SL near highs to protect profits.
📘 Educational Tip: On gap-ups, avoid chasing blindly. Wait for price to sustain above prior resistance levels. Confirmation + momentum = higher probability trades .
⚖️ FLAT OPENING (Between 24,705 – 24,852):
This is the decision zone between buyers and sellers. A flat open means market is seeking direction.
✅ Plan of Action:
• If price holds above 24,750 and breaks 24,852: Go long toward 24,995–25,028
• If price breaks below 24,705: Initiate short trades toward 24,627 zone
• Avoid trading inside the tight range of 24,705–24,750 unless volume breaks either side
• Ideal long above 24,852 with SL below 24,800; Ideal short below 24,705 with SL above 24,750
📘 Educational Tip: Flat opens inside narrow zones are best suited for breakout traders – let the market choose direction, then follow with discipline.
🔽 GAP-DOWN OPENING (Below 24,627):
Gap-downs may test the buyer’s patience — but provide clean setups if you’re patient and precise. Key support lies near 24,417 – 24,458 (Buyer’s Support for consolidation) .
✅ Plan of Action:
• If price opens near 24,627 and breaks lower: Short trade till 24,450 zone
• Inside the buyer’s support zone (24,417–24,458), look for reversal signals (hammer, bullish engulfing) for longs
• If price rebounds strongly from 24,417 zone → go long toward 24,627 again
• Only short below 24,417 if high volume breakdown is visible — else expect bounce
📘 Educational Tip: Avoid shorting blindly near major demand zones. Wait for clean breakdown candles with follow-through. This protects against trap-based reversals .
🛡 OPTIONS TRADING RISK MANAGEMENT:
✅ 1. Avoid trades in the first 5-min candle — wait for structure to build
✅ 2. Position sizing = key — don't overleverage due to emotions from gap opens
✅ 3. Time decay is real — exit out-of-money options early if momentum fails
✅ 4. Prefer spreads when IV is high (e.g., Bull Call / Bear Put)
✅ 5. Always keep exit plan ready — use 15-min candle close-based SL
📌 SUMMARY – KEY LEVELS FOR 19-Jun-2025:
• 🟢 Bullish above: 24,852 → Target: 24,995 → 25,028 → 25,203
• 🔴 Bearish below: 24,705 → Target: 24,627 → 24,458 → 24,417
• 🟧 Opening Support Zone: 24,705–24,750
• 🟥 Resistance for Booking: 25,028–25,203
• 🟩 Buyer’s Zone: 24,417–24,458 — expect demand to return
📌 Decision Level: 24,852 — above this, bulls lead; below 24,705, bears gain control.
📢 DISCLAIMER: I am not a SEBI-registered analyst. This plan is created purely for educational purposes based on price action. Please consult your financial advisor before taking any trade or investment action.
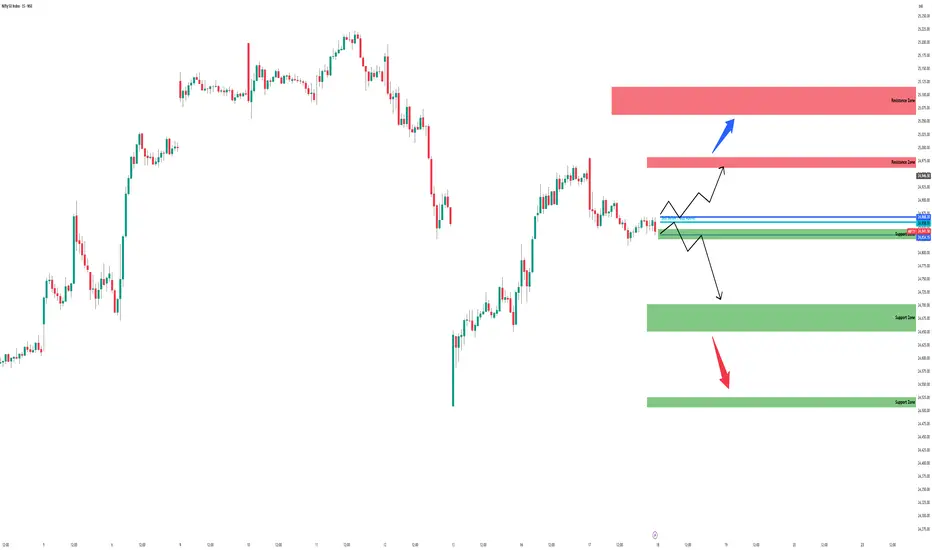
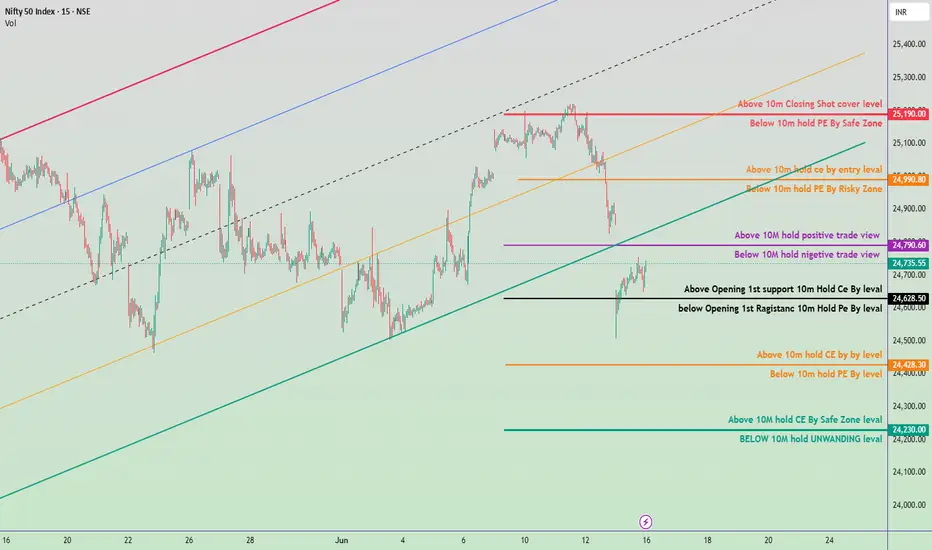
Monday,June 24 Nifty 50 Intraday Trade Plan & kye leves
🔴 Resistance Zones:
25,138 – Crucial Resistance (Above 10M hold = Positive Trade View)
Break & sustain above = bullish continuation
25,330 – Above 10M hold CE by entry level
25,390+ – Closing short-cover zone
🟡 Neutral Zone:
25,100 to 24,970
Sideways/volatility zone between positive and negative trade views
🔵 Support Zones:
24,970 – Opening S1 Hold CE By Level (Important support)
24,740 – 10M hold CE By Level (Demand zone)
24,538 – Safe Zone for CE holding
📌 Trade Plan:
🔼 Bullish Scenario:
If sustains above 25,138 → expect rally towards 25,330 and 25,390+
Entry near 25,110–25,138 zone (on retest) with SL below 25,070
🔽 Bearish Scenario:
If price breaks below 24,970 → watch for decline towards 24,740 and then 24,538
Entry on breakdown with SL above 25,000
🧠 Sentiment Strategy:
Above 25,138 = bullish bias (Buy on dips)
Below 25,100 = neutral
Below 24,970 = bearish sentiment builds up

Nifty 50 Index Intraday Levels(For Educational purpose)20.5.225📉 Downside (Bearish Bias – Preferred Today)
Sell Below: ₹24,740
Entry Condition: A clean 1-minute red candlestick closing below ₹24,740, above-average volume.
Targets:
🎯 Target 1: ₹24,700
🎯 Target 2: ₹24,650
🎯 Target 3: ₹24,580 (if bearish momentum continues)
Stop Loss: ₹24,780–24,800
////📈 Upside (Bullish Reversal – Secondary Setup)
Buy Above: ₹24,820
Entry Condition: A strong 1-minute green candle breaking above ₹24,820 with volume.
Targets:
🎯 Target 1: ₹24,860
🎯 Target 2: ₹24,900
🎯 Target 3: ₹24,940
Stop Loss: ₹24,780
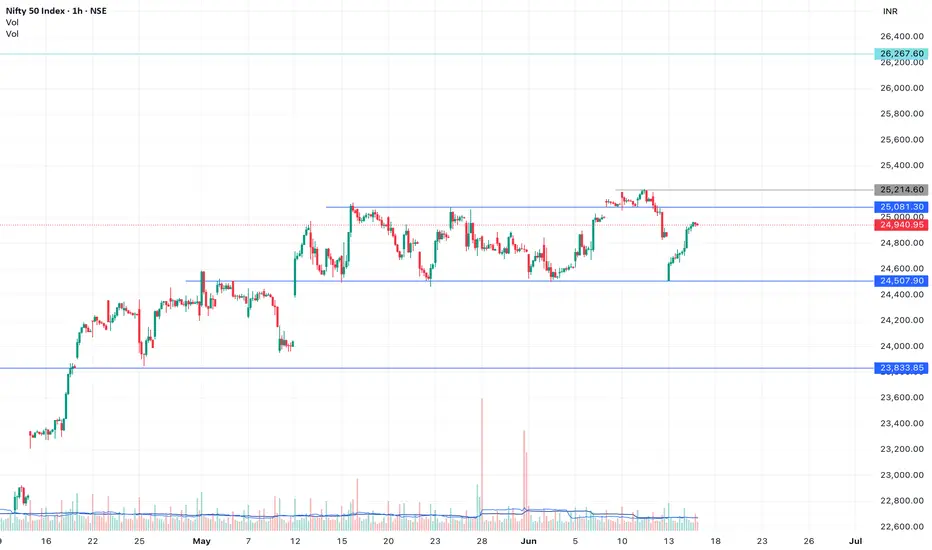
Nifty chart for 20th june 2025Looks like Nifty is making a flag and pole pattern in 1hr chart. It is in a range bound market from 24500 to 25000.
Disclaimer: All information provided here is for educational purposes and not a recommendation, advice, research report, or stock tip of any nature. Analysis Posted here is just our view/personal study method on the stocks, commodities or other instruments and assets.
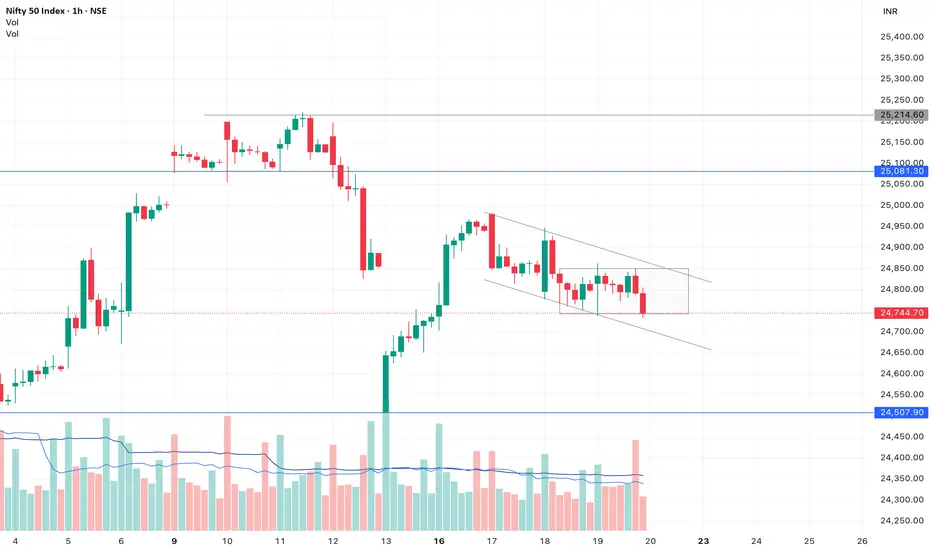
Nifty chart for 19th june 2025Looks like Nifty is making a flag and pole pattern in 1hr chart.
Disclaimer: All information provided here is for educational purposes and not a recommendation, advice, research report, or stock tip of any nature. Analysis Posted here is just our view/personal study method on the stocks, commodities or other instruments and assets.

Nifty may give a little more pullbackSeriously, it was a boring day in already a boring week for many traders.
Market went both ways then ended near the open. Certainly, this shows confusion among market participants. Or we can also say this is just an expiry play. But I don't think it was just an expiry play – because many sectors are in a negative mood. Prices went up but there was no strength to hold them. Most stocks fell at the end of the day.
Market mood is now going into the "fear zone" with short-term bullish undertone intact. For retailers, it's time to panic. For professionals, time to shortlist good stocks at the base. To clear the noise, all you need to do is ask yourself – who am I? A retailer or a pro? And act accordingly.
Today's candle in NSE:NIFTY is clearly a supply candle. Do not think it was a "no activity" day. Many retailers gave up their positions and market lost its dynamic support, creating a supply at the end of the day.
Now, unless 25000 is reclaimed with strong closing, there won't be any upside momentum. Immediate resistance would be at 24888.
Short-term support can be seen at 24500 as per OI data and 24400 as per technicals. But 24000 as per structure. I am not saying the market would be bearish. But from my perspective these levels are important to fill up so that market can have enough liquidity to give a stable rally in the second leg of the trend. I will not be buying anything new until I see a clear reversal from any of these levels.
Immediate support is at 24732.
The beauty of the market is that it can prove you wrong when you are the most certain. So do note that anything written here is not 100% certain but a probability. Do not buy/sell based on anything written here. All I give to educate people. So those who want to learn can have a point of view to analyse the market.
NSE:BANKNIFTY has a good structure and the dip should be an opportunity for traders. It has good support at 54650. Resistance remains at 55550.
Market may give a little more pullback. Brace for the impact. Use that to shortlist good setups. Opportunities are found when market mood is in fear.
No sector is in good condition. So time to be very stock specific. Look for the setups having volume above 50-day average by the factor of 3.
That will be all for today. Have a profitable tomorrow. Do not forget to use SL. Take care.
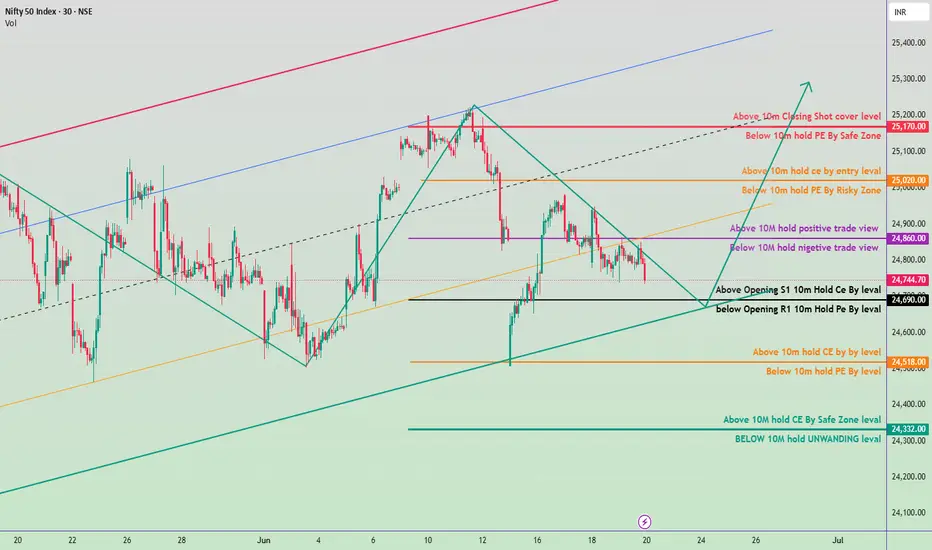
20June Nifty 50 breakdown and brekout levals🟢 Bullish Zones (CE - Call Buyers Support):
Above 25,000 – Entry level for CE
If Nifty sustains above this level, expect aggressive buying.
Target: 25,170 (Safe Zone), then 25,200 (Closing Shot Cover)
24,860 – Positive trade view
Holding above this gives bullish bias; CE can be held with confidence.
Indicates momentum shift toward buyers.
24,744 – Intraday CE Holding Level
Sustaining above this from open = potential move toward 24,860+
24,690 – Opening Support
Above this level for 10 mins = safe for CE traders.
24,518 – Minor CE Holding Zone
CE can be re-entered with small SL.
24,332 – Strong CE Safe Zone
Major support for positional bulls.
🔴 Bearish Zones (PE - Put Buyers Support):
Below 25,000 – Risky Zone for PE
PE entry starts once price fails to sustain above 25k.
Below 24,860 – Negative view
Falling below this adds bearish pressure.
Below 24,690 – Weakness
PE holding possible if sustained below 10 mins.
Below 24,518 – Confirmed PE zone
Can see acceleration downwards.
Below 24,332 – Strong PE momentum
Major breakdown area.
Below 10m Candle UNWINDING Zone – Around 24,200
Heavy PE buyers may dominate below this.
✅ Summary Trade Plan:
Bullish Above: 24,518 →24,720 → 24,860 → 25,000 → 25,170+
Bearish Below: 25,000 →24,860 →24,690 → 24,518 → 24,332
#Nifty50 predictions#nifty50 if not sustain 24800 upside level then soon fall 24550-500
some conflicts stops NIFTY50 to push above or below and if you know behind reason drop a #comment
#stockmarketindia #nfty50 #banknifty #marketfall #niftycrash

Nifty Thought Process and Analysis (Multi-Timeframe Breakdown)🔹 4H Timeframe (Intraday to Short-Term Swing)
Current Price: ~24,807
Price is consolidating inside a liquidity pocket just below a Fair Value Gap (FVG) zone.
Sell-side liquidity has already been swept; signs of accumulation are visible.
Three internal FVGs identified—market is respecting these inefficiencies.
Volume imbalance + EQ (Equal Lows) and previous OB (Order Block) show that price may be building a base.
Market Structure: Minor BOS (Break of Structure) observed, but no new HH yet — compression inside a range.
✅ Bullish Bias IF price breaks above the FVG range and mitigates the supply.
📌 Long Setup Idea:
Entry: Above 24,900
Stop Loss: Below EQ/FVG (~24,650)
Target: 25,200–25,400 (Buy-side liquidity/weak high zone)
📛 Invalidation: Clean break below EQ zone + OB → indicates bearish continuation.
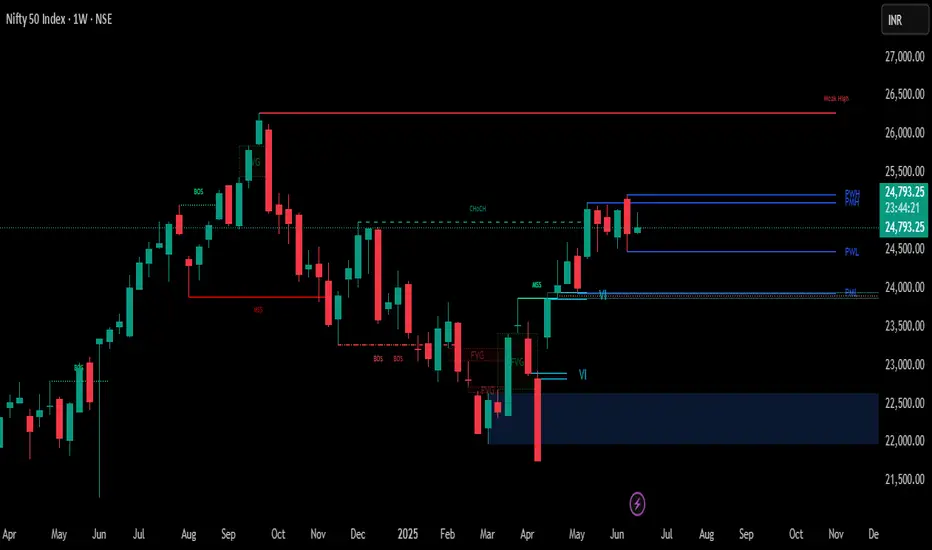
🔹 Daily Timeframe (Swing View)
Price respected the sell-side liquidity grab and is now consolidating within a bearish FVG range.
Minor BOS confirms short-term bullish correction, but macro context is mixed.
PWL (Previous Week Low) has been swept, giving confluence to bullish short-term reversal.
Upper FVG near 25,100–25,200 remains unmitigated.
🧠 Key Observation: Smart money often reverses price after sweeping liquidity → the VI (Volume Imbalance) zone may act as a launchpad.
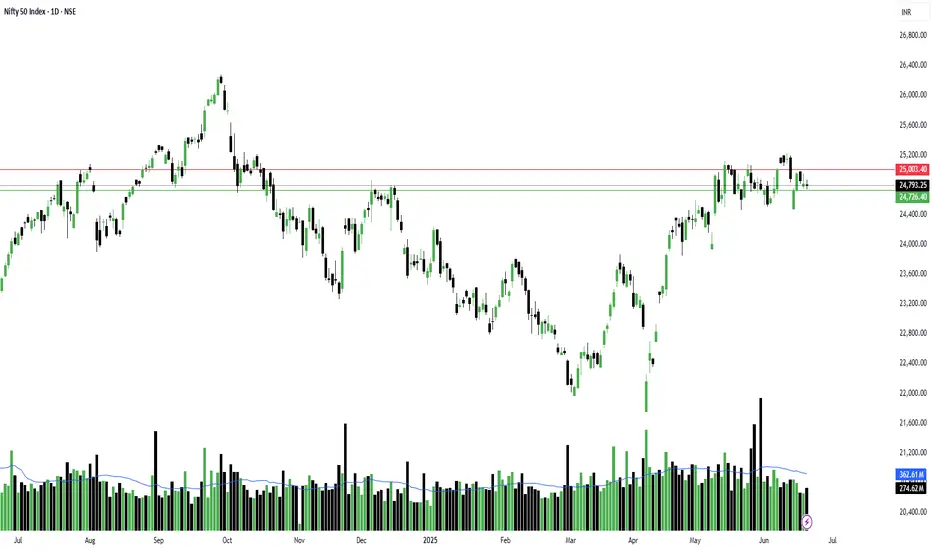
🔹 Weekly Timeframe (Macro Structure)
Structure remains bullish with strong upside momentum since the March-April reversal.
Change of Character (ChoCH) in April is confirmed with multiple BOS candles.
Current price is holding above the weekly FVG + VI.
A large bullish OB sits between 22,400–22,800, indicating massive institutional accumulation.
📈 Weekly Bias: As long as price stays above 24,400, bullish targets of 25,600 are possible in coming weeks.
🧩 Conclusion & Trade Idea Summary (ICT-based)
Bias: Bullish (Short-term accumulation, preparing for expansion)
Entry: Break and close above 24,900 on 4H or Daily
Stop Loss: 24,640 (Below EQ zone/FVG boundary)
TP1: 25,200 (Buy-side liquidity)
TP2: 25,400–25,600 (Weekly premium zone/weak high)
NIFTY : Trading levels and plan for 18-Jun-2025📊 NIFTY TRADING PLAN – 19-June-2025
📍 Previous Close: 24,798.75 | 🕒 Timeframe: 15-min
📏 Gap Threshold Considered: 100+ points for classification
🔼 GAP-UP OPENING (Above 24,964):
If NIFTY opens above 24,964, it breaks out of the "No Trade Zone" (24,710–24,864) and suggests bullish momentum toward upper resistances.
✅ Plan of Action:
• Wait for price to sustain above 25,054 (Last Intraday Resistance).
• If 15-min candle closes strong above 25,054 with volume, initiate long trades toward the Profit Booking Zone: 25,160 – 25,204 .
• Stop-loss: Below 25,000 (15-min candle close basis).
• If prices face rejection at 25,054 or near 25,160 zone, look for short trades for a pullback toward 24,864.
📘 Tip: On gap-up days, avoid chasing the open blindly . Let the first 15–30 minutes define control – buyers vs sellers.
⚖️ FLAT OPENING (Between 24,710 – 24,864):
Opening within the No Trade Zone signifies indecision. This zone needs a breakout for directional trades.
✅ Plan of Action:
• Avoid any aggressive trade within 24,710 – 24,864.
• If price breaks and sustains above 24,864, initiate long trade toward 25,054, with SL below 24,820.
• If price breaks down below 24,710, initiate short trade toward 24,627, SL above 24,750.
• Watch for wick traps — ensure breakout happens with solid volume candle, not just one spike.
📘 Tip: In no-trade zones, your capital is safest when you wait . Let price exit the confusion before entering.
🔽 GAP-DOWN OPENING (Below 24,610):
If NIFTY opens below 24,710 by over 100 points, it’s a gap-down near the Last Intraday Support at 24,627 , which brings weakness into play.
✅ Plan of Action:
• If price breaks and sustains below 24,627, short trades can be taken toward 24,453 (next major support).
• SL for short trades above 24,680.
• If sharp buying emerges from 24,453 – 24,500 zone, look for reversal long trades back toward 24,710.
• Confirm with reversal candles like hammer/morning star on 15-min chart.
📘 Tip: Buyer’s Support zones are best for risk-reward long trades , but confirmation is key — don’t knife-catch.
🛡 OPTIONS TRADING – RISK MANAGEMENT TIPS:
✅ 1. Use Spread Strategies: Vertical spreads (Bull Call/Bear Put) help limit losses on volatile days.
✅ 2. Don’t Enter in the First 5-min Candle: Especially on gap-up/down days, let the initial volatility settle.
✅ 3. Track IV (Implied Volatility): High IV days can erode premiums fast post breakout — consider theta decay risk.
✅ 4. Set SL Based on 15-min Candle Close: Avoid panic exits due to wicks or noise.
✅ 5. Book 50% Profits Early: If your trade moves 50–70% in favor, partial exit helps lock-in gains.
📌 SUMMARY – KEY LEVELS TO WATCH:
🟩 Support Zones:
• Opening Support / Resistance: 24,710
• Last Intraday Support: 24,627
• Strong Buyer’s Support: 24,453
🟥 Resistance Zones:
• Opening Resistance: 24,864
• Last Intraday Resistance: 25,054
• Profit Booking Area: 25,160 – 25,204
⚔️ Battle Zone (No Trade): 24,710 – 24,864
📈 Trend Decision Zones:
• Above 24,864 → Bullish toward 25,160+
• Below 24,710 → Bearish toward 24,453
📢 DISCLAIMER: I am not a SEBI-registered analyst. This plan is prepared purely for educational purposes. Please consult your financial advisor before making any trading or investment decision.
NIFTY : Trading levels for 18-Jun-2025📘 NIFTY TRADING PLAN – 18-Jun-2025
🕒 Chart Timeframe: 15-min | 📍 Previous Close: 24,841.50
📏 Gap Opening Threshold: 100+ points
🔼 GAP-UP OPENING (Above 24,964):
If NIFTY opens above the No Trade Zone (24,864) by more than 100 points, the price will likely test the upper resistance zone near 25,054 (Last Intraday Resistance) .
✅ Plan of Action:
• Avoid chasing right at open. Observe the first 15–30 mins for confirmation above 25,054.
• Sustainable move above 25,054: Look for long trades toward 25,244, with SL below 25,000.
• Rejection at 25,054 zone: Consider short trades only if there’s a clear reversal pattern, targeting back toward 24,864.
• Book profits partially near 25,150 if long, as market may consolidate.
📘 Educational Tip: Sharp gap-ups often face profit booking at resistance zones. Focus on confirmation via strong candles + volume to avoid false moves.
⚖️ FLAT OPENING (Between 24,770 – 24,864):
Flat open near the No Trade Zone (24,770 – 24,864) suggests indecision or potential sideways movement early in the session.
✅ Plan of Action:
• No Trade inside this band until clear breakout or breakdown is seen.
• Break above 24,864: Consider intraday longs toward 25,054, SL below 24,820.
• Break below 24,770: Enter shorts targeting 24,626, with SL above 24,800.
• Avoid trading between 24,770–24,864 during consolidation — it’s where stop losses typically get hit from both sides.
📘 Educational Tip: Trading in the No Trade Zone is like catching a coin toss — instead, let market pick a direction, then follow it with clarity .
🔽 GAP-DOWN OPENING (Below 24,670):
A gap-down below 24,770, especially near or under the Last Intraday Support – 24,626 , brings into play the Buyer’s Support Zone (24,253 – 24,320) .
✅ Plan of Action:
• If opening is near 24,626 and shows breakdown below, ride shorts till 24,420 – 24,320.
• Look for potential reversal setups inside 24,253–24,320 zone for long trades.
• Reclaiming 24,626 with bullish candles could invite short-covering.
• Avoid new shorts inside Buyer’s Zone unless breakdown below 24,253 happens with volume and structure.
📘 Educational Tip: Gaps near support zones give best long risk/reward, but never buy blindly — wait for confirmation candle + sustained buying interest .
🛡 OPTIONS TRADING RISK MANAGEMENT TIPS:
✅ 1. Wait 15–30 mins post-open to avoid false breakouts or reversal traps.
✅ 2. Avoid over-leveraging on gap days — increase accuracy, reduce lot size.
✅ 3. Prefer spreads (Bull Call/Bear Put) if volatility is high to control premium erosion.
✅ 4. Use SL on candle close basis (preferably 15-min), not just trigger wicks.
✅ 5. Exit intraday trades 10–15 mins before close if targets aren't hit to avoid time decay spikes.
📊 SUMMARY – KEY LEVELS TO WATCH:
• 🟢 Bullish Setup:
– Above 24,864 → Target: 25,054 → 25,244
– SL: Below 24,820 (on longs)
• 🔴 Bearish Setup:
– Below 24,770 → Target: 24,626 → 24,320
– Breakdown SL: Above 24,800
• 🟧 No Trade Zone: 24,770 – 24,864 — Let direction confirm
• 🟩 Support Zones: 24,626 / 24,320 / 24,253
• 🟥 Resistance Zones: 25,054 / 25,244
📌 Decision Point: Breakout above 24,864 or below 24,770 decides momentum.
⏱ Watch the first 15-min candle structure for decisive moves.
📢 DISCLAIMER: I am not a SEBI-registered analyst. This trading plan is purely for educational and learning purposes. Please consult your financial advisor before taking any trading or investment decision.
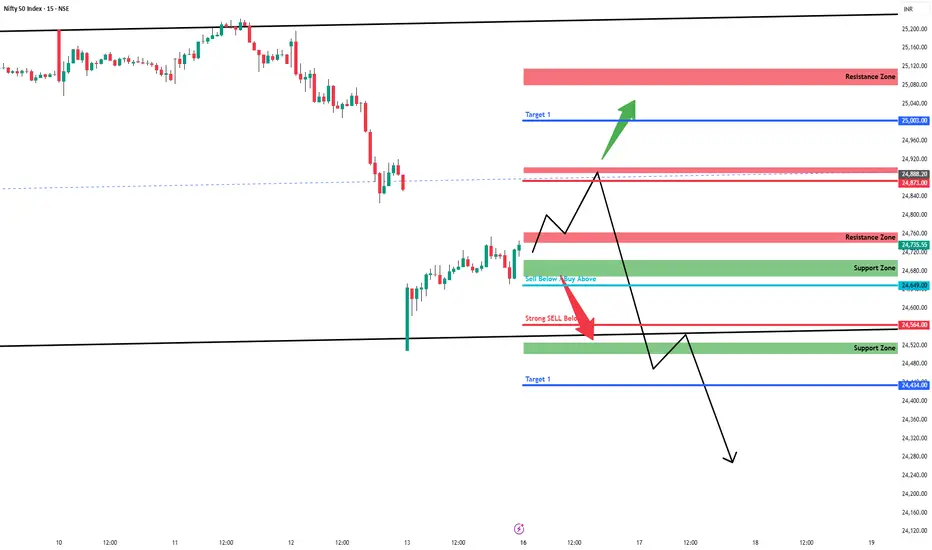
Nifty - Intraday levels & Prediction for - 18 Jun 2025Nifty Prediction for Tomorrow:
Trend : BEARISH Breakout
Sentiment : Negative
Expectation : Nifty closed below 24900, expecting BEARISH breakout tomorrow. Any close above 2510 only its Bullish trend, and price will move to test 25200.
Look for Buy/Sell at Demand and Supply zone for profitable trades.
Demand and Supply Zones - When price breaks the zone, Demand zone will become Resistance and Supply zone will become Support. If Nifty Sustains above 24900 tomorrow we can see good rally upto 25080 Resistance. Any breakout above 25100 and next resistance 25200
Refer the chart for detailed Intraday Support and Resistance levels.
Nifty chart for 17th june 2025Looks like Nifty is in a range. Also, it took support on 24500 level.
Disclaimer: All information provided here is for educational purposes and not a recommendation, advice, research report, or stock tip of any nature. Analysis Posted here is just our view/personal study method on the stocks, commodities or other instruments and assets.
17 june Nifty50 brekout and Breakdown leval✅ Bullish Bias Above:
25,230 – Above 10m closing = Short Cover Zone
25,090 – Above 10m = CE Hold by Entry Level
24,990 – Above 10m = Positive Trade View
24,822 – Above Opening S1 = CE Hold Level
24,680 – Above 10m = CE Hold Level
24,530 – Above 10m = CE Safe Zone Level
⚠️ Neutral Zone:
24,990 ↔ 24,940 – Borderline area for trend confirmation.
Above 24,990 = bullish
Below 24,940 = start of negative bias
❌ Bearish Bias Below:
24,940.95 – Below 10m = Negative Trade View
24,822 – Below Opening R1 = PE Hold Level
24,680 – Below 10m = PE Hold Level
24,530 – Below 10m = Unwinding Level

Nifty - Intraday levels & Prediction for - 17 Jun 2025Nifty Prediction for Tomorrow:
Trend : Sideways to BEARISH
Sentiment : Positive
Expectation : Since Nifty closed above 24900, 25070 will be key resistance for tomorrow and expecting BEARISH reversal at 25070 resistance. Any close above 25100, price will move to test 25200.
Look for Buy/Sell at Demand and Supply zone for profitable trades.
Demand and Supply Zones - When price breaks the zone, Demand zone will become Resistance and Supply zone will become Support. If Nifty Sustains above 24900 tomorrow we can see good rally upto 25080 Resistance. Any breakout above 25100 and next resistance 25200
Refer the chart for detailed Intraday Support and Resistance levels.

Nifty - Intraday levels & Prediction for - 16 Jun 2025Nifty Prediction for Tomorrow:
Trend : BEARISH
Sentiment : Negative
Expectation : Nifty made BEARISH engulfing in Weekly Chart, and shows weakness. Tomorrow we can expect slight BULLISH move upto 24900 then BEARISH reversal might come and any breakout below 24550 big fall is expected this week.
Look for Buy/Sell at Demand and Supply zone for profitable trades.
Demand and Supply Zones - When price breaks the zone, Demand zone will become Resistance and Supply zone will become Support.
Refer the chart for detailed Intraday Support and Resistance levels.
nifty analysismay be nifty will positive in this month from monday. nifty next target is ATH. after that i aspecting a fake breakout . then nifty will fall upto 24100- 24000 levels . we see 24000 levels in the month of september.

14 june nifty50 breakout & breakdown levals🔍 NIFTY 50 LEVELS & TARGET PREDICTION (As per chart)
✅ Bullish Zones & CE (Call) Entry
24,230.00 – Safe Zone Buy for CE
Above this level, initiate CE buys for a safer trade.
📈 Target 1: 24,428.30
📈 Target 2: 24,790.60 Hold CE above each level, step by step.
24,428.30 – CE Buy Confirmation
Confirms momentum. Add to CE or trail SL.
📈 Target: 24,628.50
24,628.50 – Strong Support (1st Opening Support)
Major breakout level. If reclaimed and held:
📈 Target: 24,790.60 Above this, hold CE confidently.
24,990.80 – Entry-Level for Higher Bullish CE
If market holds above this, aggressive CE positions OK.
📈 Final Target: 25,190.00 (Closing Shot Cover)
❌ Bearish Zones & PE (Put) Entry
Below 24,230.00 – UNWINDING Zone
Strong negative zone; ideal for PE entry.
📉 Target 1: 24,100 (projected, not shown but logical)
📉 SL: 24,230 re-entry
Below 24,428.30 – Weakness Confirmed
Continue holding PE. Breakdown builds here.
📉 Target: 24,230.00
24,628.50 – 1st Opening Resistance
Below this, bias is negative.
📉 Target: 24,428.30
Below this = PE Hold, Avoid CE
Below 24,990.80 – Risky Zone for PE
Intraday negative cues. Short on rallies only if rejection seen.
🟪 Neutral Zone (No Trade / Wait for Confirmation)
24,735 (Current Price) is between 24,628. and 24,790
Wait for a breakout above 24,790 to go long.
Wait for a breakdown below 24,628 to go short.
Nifty - Intraday levels & Prediction for - 13 Jun 2025Nifty Prediction for Tomorrow:
Trend : Sideways to Slightly Bearish upto 24750
Sentiment : Negative
Expectation : Sideways to Bearish trend upto 24750 Support zone / 1 Hr 200 EMA then Nifty likely to take trend reversal since it looks weaker we will look Sell side entries.
Look for Buy/Sell at Demand and Supply zone for profitable trades.
Demand and Supply Zones - When price breaks the zone, Demand zone will become Resistance and Supply zone will become Support.
Refer the chart for detailed Intraday Support and Resistance levels.
Nifty good to buy! NSE:NIFTY gave the dip to the support 24855 as expected, and closed above it. Today's Nifty candle formation is Liquidity Retest. In this type of the candle Intraday support becomes critical, which is now at 25842.
Also, this type of the dip may push the market a little higher on the opening next day. So tomorrow we may see an opening above 24900.
The resistance is now at 25030. Above this 25200 is the next major resistance now.
The Shakeout. The trapping. All already happened. So we need to wait for a bounce or a follow up selling to mark the new levels.
Tomorrow is the last day of the week. If we see a bullish closing then next week gonna be good.
Again saying, time to be very sector specific. Selecting the right setup from the right sector would be the key to stay in profit.
NSE:BANKNIFTY may give a dip to 55740 which would be a buying opportunity for positional traders.
Do not trade based on any news at this time. Also avoid MTF trading.
Buy only the setups near or above their accumulation zone.
Sectors and stocks I already given. So that would be all as of now.
Take care. Trade carefully and use proper risk management and Stoploss.

Nifty trapped retailers Today's candle in NSE:NIFTY is a Intraday Liquidity Sweep candle. Shakeout from both sides in the index. Option writers do this so that retailers will leave their positions and they can have the proper liquidity and then take the index to the new swing high.
There is a possibility of tomorrow's action in the market being something like this: the Nifty will be seeing a dip on Intraday chart drive the market higher on the second half. However, that's just a possibility and I do not say that's it's a 100% chance.
The levels for the Nifty:
Support - 24855. A dip to this should be a Buy opportunity.
Resistance - 25200.
The same has already happened in the NSE:BANKNIFTY . Hence, it looks better than Nifty.
For Banknifty, the levels are:
Support - 56097
Resistance - 56640
However, from the short term perspective, nothing to worry about until Nifty trades above 24750. Below this we must be cautious.
It's a time to be very sector specific and also which sectors to focus on. So focus on selecting the right setup from the right sector.
That's all for today. Have a profitable tomorrow. Don't forget to use SLs in all your positions.

Nifty Hovering at 25,150 – Can It Break Strong Resistance?Nifty still couldn't hold the 25,150 level today, and selling pressure was seen from the day's high.
Avoid trading Nifty until it closes above 25,150 or 25,160. Until the Nifty closes above 25,150, avoid buying options. The Nifty will continue to trade sideways between 25,070 and 25,150 until it gives a decisive breakout. For a better understanding, you can watch the video.
