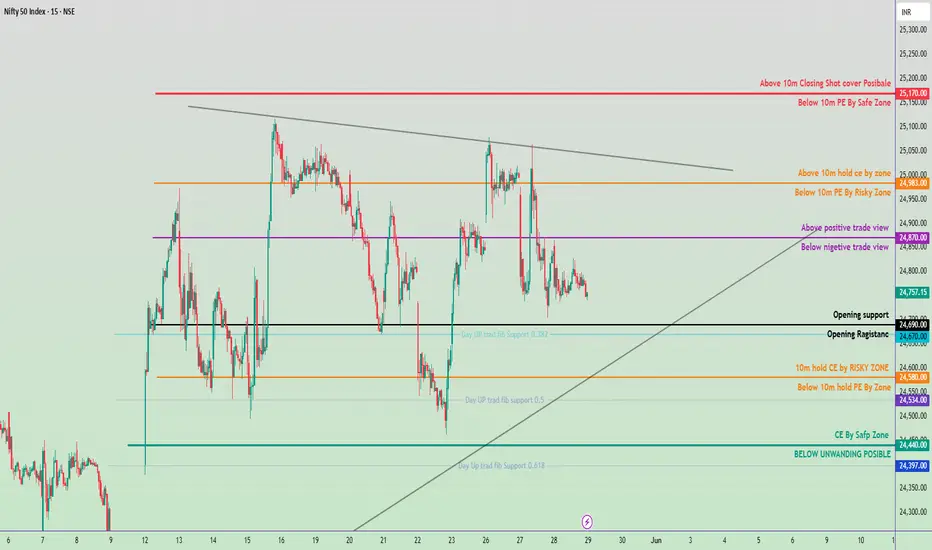
May 29, 2025 Nifty 50 Trading Zone 🔺 Bullish Bias If:
Price sustains above 24,870:
Expect move towards 24,983 (Above 10M CE zone).
Target: 25,170 (Short covering may trigger).
Strategy: Buy on dips above 24,870 with SL below 24,840.
🔻 Bearish Bias If:
Price falls below 24,670:
Likely to test 24,580 and 24,534 ( PE zones).
Break below 24,440 opens downside to 24,397 (unwinding zone).
Strategy: Sell on rise below 24,670 with SL above 24,720.
⚖️ Neutral/Bounce Zone:
Between 24,710 – 24,870:
Choppy moves expected; avoid fresh positions unless breakout confirms.
📌 Key Levels to Watch:
Breakout Level (Upside): 24,870
Breakdown Level (Downside): 24,670
Major Support: 24,397
Major Resistance: 25,170
Niftyprediction
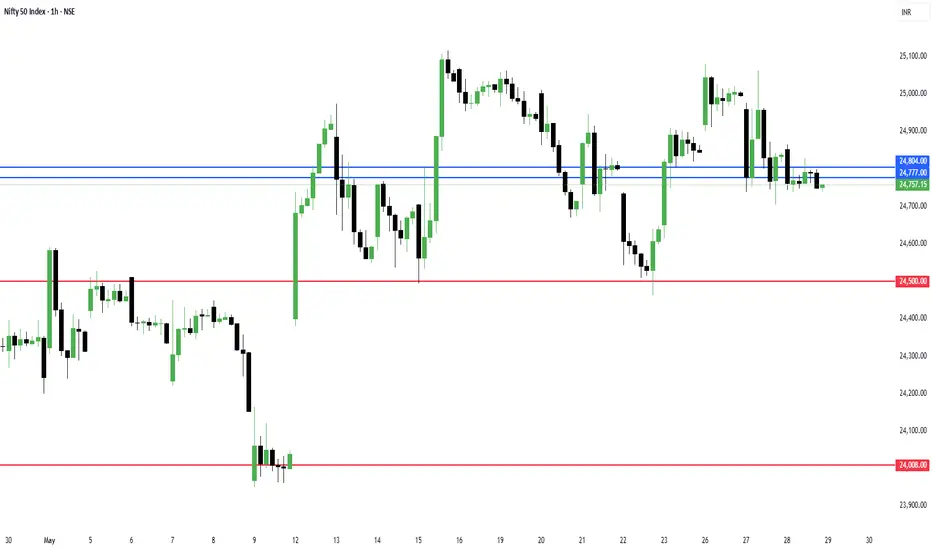
What's going on in Nifty?Just like yesterday, today also a supply candle has formed in $NSE:NIFTY.
As soon as demand was seen in the morning, FII and DII (institutions) sold off their positions. The chart also shows clearly that they have started buying for June.
However, as I said earlier and still believe — stocks that are in an uptrend setup won't be affected much by Nifty or other indices falling. You can still trade them with proper stop-loss.
Nifty Resistance is around 24777–24804.
If it crosses this zone, we might see short covering up to 25000.
Supports are at:
- First support: 24590
- Second support: 24008
Keep in mind: the overall market mood is still positive. So if you get a good opportunity, you can short the index — but don’t hold short positions overnight.
For stocks, keep an eye on the Railway and Energy sectors.
Some stocks you can watch for swing trading opportunities:
NSE:HFCL
NSE:ITDCEM
NSE:HCC
Avoid chasing breakout stocks right now.
Don’t buy anything new for the short term. Wait — good opportunities are coming soon.
Take care, and always use a stop-loss.
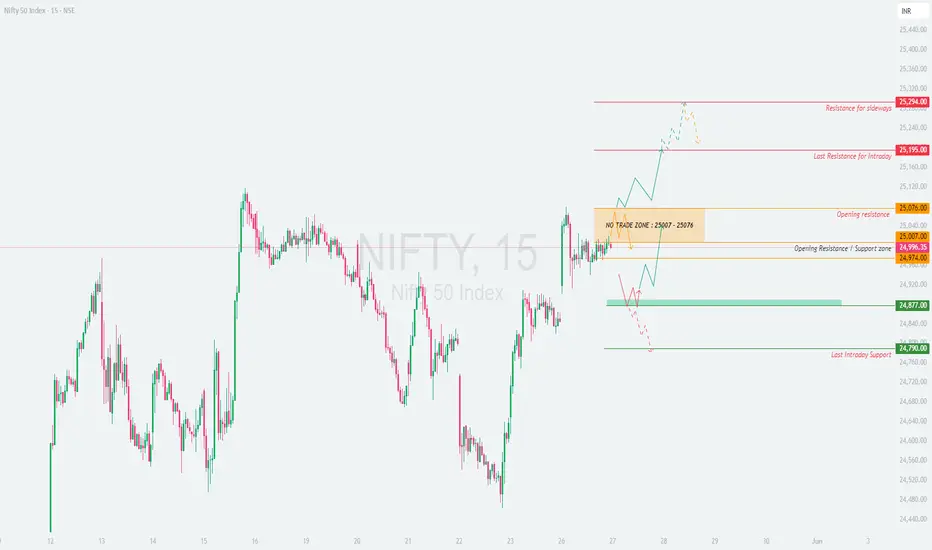
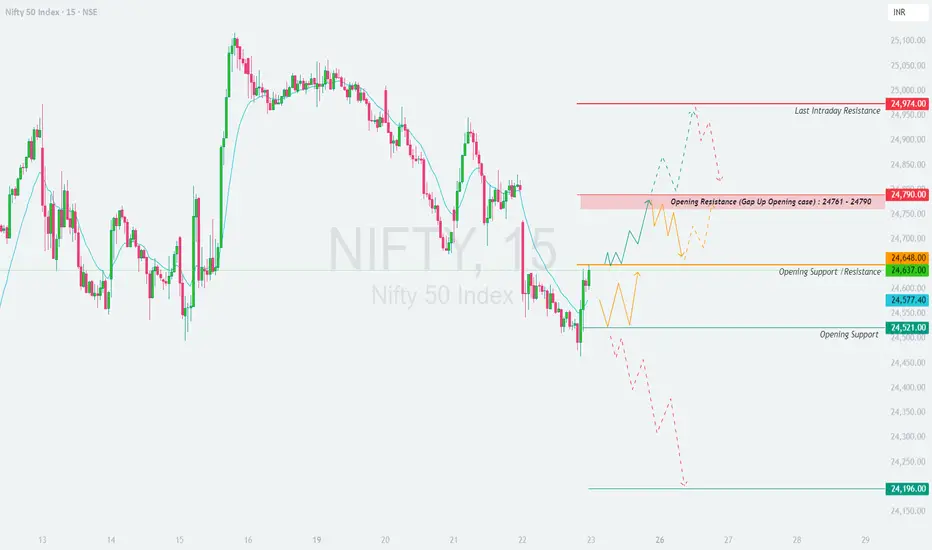
NIFTY : Trading levels and Plan for 28-May-2025📘 NIFTY TRADING PLAN – 28 MAY 2025
🕰 Based on 15-min price structure & support/resistance zones
📍 Gap opening considered when price opens 100+ points above or below the previous close (24,837)
🔼 GAP-UP Opening (Above 24,937 – 100+ points):
If Nifty opens above 24,937+ , it enters the zone between Last Intraday Resistance (25,000) and moves toward the Profit Booking Zone (25,285 – 25,347) .
✅ Plan of Action:
• Avoid aggressive entries in the first 15–30 minutes. Let price action settle and confirm sustainability.
• A 15-min candle close above 25,165 with strong volume may signal a breakout toward the Profit Booking Zone at 25,285–25,347 .
• Pullbacks near 25,000–25,165 acting as a new support can offer good CE entries for continuation.
• However, if Nifty shows reversal signs (bearish engulfing or shooting star) near the Profit Booking Zone, traders may consider light PE positions for a possible retracement.
🧠 Educational Insight: Gap-ups into major resistance should never be chased blindly. Let the market confirm whether bulls have the strength to sustain or not.
⚖️ FLAT Opening (Between 24,701 – 24,937):
This zone is where Nifty opens near the Opening Resistance (24,837–24,861) or Opening Support Zone (24,666–24,701) .
✅ Plan of Action:
• Mark this range as the NO TRADE ZONE initially. Wait for a breakout above 24,937 or breakdown below 24,666 before taking directional trades.
• If Nifty sustains above 24,861 with strong green candles, you may initiate CE positions with targets of 25,000 – 25,165 .
• A breakdown below 24,666 with rejection at retest opens PE opportunities toward 24,594 and lower.
• If the market stays sideways between 24,701–24,861 , stay on the sidelines. Avoid theta decay traps in options.
🧠 Educational Insight: In sideways zones, wait for price confirmation instead of anticipation. Let price break levels and retest for high-probability trades.
🔽 GAP-DOWN Opening (Below 24,737 – 100+ points):
In this case, Nifty opens below Opening Support Zone (24,666–24,701) or even the Last Intraday Support (24,594) .
✅ Plan of Action:
• If price finds support near 24,594 and shows bullish reversal signs (hammer, bullish engulfing), a bounce toward 24,701+ is possible.
• Breakdown and a 15-min close below 24,594 will likely take Nifty toward the Buyer’s Important Support Zone (24,326 – 24,391) .
• Use PE options if 24,594 breaks decisively and price fails to reclaim it on a retest.
• For aggressive traders, any retest of 24,666–24,701 acting as resistance can provide a PE entry with tight SL.
🧠 Educational Insight: Gap-downs into support zones often trap sellers if support holds. Watch for exhaustion or follow-through before deciding direction.
🛡 RISK MANAGEMENT TIPS FOR OPTIONS TRADERS:
📌 Use 15-min candle close SL to avoid emotional exits.
📌 Avoid overtrading. Stick to 1–2 high-quality trades only.
📌 Avoid buying options right after the open – let premiums stabilize.
📌 Always calculate Risk:Reward Ratio before placing a trade.
📌 Don’t trade inside the noise zone (24,701–24,861); wait for levels to be breached.
📌 Use spreads (Bull Call / Bear Put) if volatility is high.
📊 SUMMARY & CONCLUSION:
• 🔼 Bullish Breakout Zone: Above 25,165 → Target: 25,285 / 25,347
• 🔽 Bearish Breakdown Zone: Below 24,594 → Target: 24,391 / 24,326
• 🟧 No Trade Zone: 24,701 – 24,861
• 🟩 Opening Support Zone: 24,666 – 24,701
• 🟥 Profit Booking Resistance Zone: 25,285 – 25,347
📌 Wait for price structure to confirm direction. Use patience and discipline – not emotions. Great setups reward prepared traders.
📢 DISCLAIMER: I am not a SEBI-registered analyst. This trading plan is purely for educational purposes. Please consult your financial advisor before taking any investment decisions. Trade wisely and protect your capital. 💼📈📉

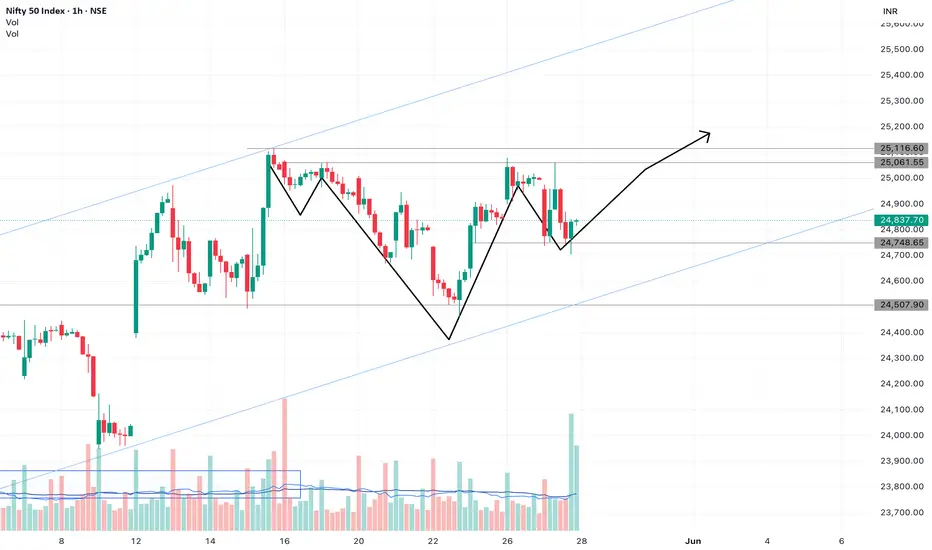
(May 28, 2025) prediction and trade plan for tomorrow Trend: Currently in a symmetrical triangle pattern (lower highs, higher lows). Watch for breakout or breakdown.
Upside Levels (Resistance & Target Zones):
24,980 – Key Resistance: "Above positive trade view"
A breakout above this may indicate bullish strength.
25,260 – "Below 10m PE by Risky Zone"
25,460 – Strong resistance zone (PE by Safe Zone)
Above 25,460: "Above 10m Closing Shot cover Possible" – Potential strong bullish rally.
Downside Levels (Support & Risk Zones):
24,670 – Opening support levels
24,397 - 24,380 – "10m hold CE by Risky Zone" & "Below 10m hold PE by Zone"
24,180 – Major support: CE by Safe Zone
🔹 Bullish Bias (If price breaks & sustains above 24,980):
Entry: Above 24,980
Target 1: 25,100
Target 2: 25,260
Target 3: 25,460
SL: Below 24,940
🔹 Bearish Bias (If price breaks below 24,670 and sustains):
Entry: Below 24,670
Target 1: 24,534
Target 2: 24,380
Target 3: 24,180
SL: Above 24,730
Neutral/Bounce Zone:
Between 24,670 – 24,980: This is a choppy zone, likely to see sideways movement unless breakout occurs. Good for range scalping only.

Nifty analysis for 28th May 2025Looks like Nifty is forming an inverse head and shoulders pattern.
Disclaimer: All information provided here is for educational purposes and not a recommendation, advice, research report, or stock tip of any nature. Analysis Posted here is just our view/personal study method on the stocks, commodities or other instruments and assets.
NIFTY : Trading levels and Plan for 27-May-2025📈 Nifty 50 Trading Plan – 27 May 2025
🔍 Chart Structure Analysis with Strategic Plan of Action
GAP-UP Opening (Above 25,076 – 100+ points):
If Nifty opens with a strong gap-up above 25,076 , we are stepping into the Opening Resistance zone , heading towards the Last Intraday Resistance at 25,195 and even towards 25,294 – Resistance for sideways price action .
✅ Plan of Action:
• Avoid early entries in the first 15-30 mins to let volatility settle.
• If price sustains above 25,195 on a 15-min candle close, potential momentum may push it to 25,294+ .
• Option buyers may consider buying CEs with tight SL below 25,076 on a retest for a favorable risk-reward.
• If price shows rejection from 25,195–25,294, watch for reversal patterns to scalp PEs with SL above 25,294 .
🧠 Education Tip: Gaps often trap retailers. Confirmation is key! Avoid aggressive trades at resistance without a proper base.
FLAT Opening (Between 25,007 – 25,076):
A flat start means price is within the NO TRADE ZONE (25,007–25,076). This zone offers low conviction as both bulls and bears wait for direction.
✅ Plan of Action:
• Wait and watch. Don’t force trades here.
• Trade only on clean breakout above 25,076 or breakdown below 25,007 with good volume .
• Avoid options buying here, theta decay will kill premiums.
• Look for directional breakouts post 10:00 AM for clarity.
🧠 Education Tip: No Trade Zone exists to protect your capital. Preserve energy for high-probability setups.
GAP-DOWN Opening (Below 24,877 – 100+ points):
A strong gap-down below 24,877 would take price into a decisive Buyer's Support Zone (24,877 – 24,791) or even to last intraday support at 24,790 .
✅ Plan of Action:
• If price holds above 24,790 – 24,877 zone , intraday pullback likely. Watch for reversal signals to scalp CEs with tight SL below 24,790 .
• Breakdown below 24,790 with volume may trigger further downside. Can aim for lower supports.
• Avoid chasing puts after a gap down—wait for a retest or consolidation before entry.
🧠 Education Tip: Buyer zones often act as magnets for smart money entries. Respect structure before shorting blindly.
💡 Options Trading Risk Management Tips:
• Use stop losses on candle-close basis and avoid mental SLs.
• Never buy options when premiums are inflated post-gap moves without confirmation.
• Use spreads (e.g., Bull Call or Bear Put spreads) on volatile days to reduce premium decay.
• Avoid over-leveraging—stick to 1–2 trades with proper planning.
• Hedge if you’re carrying positions overnight.
📊 Summary & Conclusion:
• 🔸 No Trade Zone: 25,007 – 25,076 (Avoid initiating fresh trades here).
• 🔼 Bullish breakout levels: Above 25,076 → Target 25,195 / 25,294
• 🔽 Bearish breakdown levels: Below 24,790 → Possible downside pressure.
• 💚 Buyer's Zone Support: 24,877 – 24,791
🔔 Remember: The market does not reward speed but precision and patience. Focus on execution based on structure and not emotions.
📌 Disclaimer: I am not a SEBI-registered analyst. The information provided is for educational purposes only. Please do your own analysis or consult your financial advisor before taking any trade. Trade safe and smart! 💼📉📈
May 27, 2025 Nifty 50 tomorrow prediction Bullish Trade Setup
Entry: Above ₹25,080
Targets:
🎯 Target 1: ₹25,218
🎯 Target 2: ₹25,338
Stop Loss: ₹25060
Reason to Buy:
Above key resistance
Positive trend continuation
Potential short-covering rally
Bearish Trade Setup
Entry: Below ₹24,910
Targets:
🎯 Target 1: ₹24,783
🎯 Target 2: ₹24,610
🎯 Target 3: ₹24,534
Stop Loss: ₹24939
Reason to Sell:
Breakdown from support zone
Risk-off for PE writers
Momentum shift to downside
Pro Tips
Wait for 15-minute candle close above/below trigger levels.
Avoid trading in tight range between ₹24,910–₹25,080 (no clear trend).
Use small position size near expiry or event days.
Track open interest and FIIs/DII data for confirmation.

Nifty analysis for 26th May 2025Looks like Nifty has formed an inverse head and shoulders pattern and it already broke the pattern moving upside.
Disclaimer: All information provided here is for educational purposes and not a recommendation, advice, research report, or stock tip of any nature. Analysis Posted here is just our view/personal study method on the stocks, commodities or other instruments and assets.

Nifty 25500!!!As per technical analysis this week shows so much bullish
So my target is 25100 then manage the position to 25500.
Try to enter at one hour fvg, as I shown in the chart or else you can enter with your model.
This week is going to be a massive week.

NIFTY50 Correction Mode over? Next move: 25200/26000 or 22500??1. On a daily time frame, Nifty50 formed a Head and Shoulders(H&S) pattern which is a bearish reversal pattern suggesting a potential downward trend. NIFTY broke the neckline and completed the H&S downside fall.
2. Now NIFTY is at a 0.618(22,435) Fibonacci Retracement level and is currently being tested as support. Next Fibonacci level on the downside is is at 22557.
3. A long-term trend ascending trendline may also act a dynamic support below 0.618 level. Overall NIFTY has a strong support zone from 22200-400.
4. With RSI at over sold levels, NIFTY may not retest 0.5 Fibonacci level and a good bounce can be seen from 22300-450 levels.
5. On the upside, strong resistance can be seen at 24100-150 levels.

Nifty Intraday Levels for 26-May-25
Nifty closed above resistance level with support of Trendline
Bearish < 24760
Bullish > 24880
Wait for Proper Rejection/Pattern :
@Support : Bullish
@Resistance : Bearish
*All views for educational purpose only
Nifty to Stay in Pause Mode Ahead of Expiry WeekAfter a strong run, the Nifty rally seems to be losing steam and has now slipped into consolidation mode. With the monthly derivatives expiry coming up next week, the market is likely to remain range-bound.
Options data suggests that Nifty has carved out a trading range between 24,500 and 25,100. Until we see a decisive move beyond either end of this 600-point band, don’t expect a strong directional trend.
A clear breakout above 25,100 could reignite bullish momentum, while a breach below 24,500 might invite fresh selling pressure. Until then, it’s all about sideways action and expiry-driven volatility.

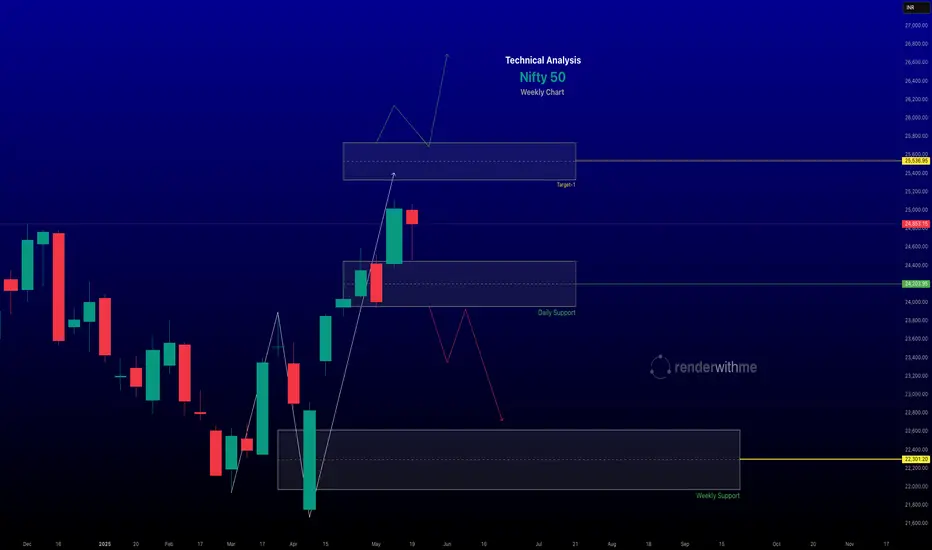
Nifty 50 Weekly Technical Analysis for May 26–30, 2025- Nifty 50 Technical Analysis for May 26–30, 2025 -
# Current Market Context
Recent Performance: As of May 23, 2025, the Nifty 50 closed at 24,853.15, up 243.45 points (0.99%), snapping a three-day losing streak. The index has shown resilience, supported by broad-based buying in financials, Pharma, and IT sectors.
- Market Sentiment: indicate a cautiously bullish outlook for the week targeting 25,300–25,700, driven by a positive weekly close and potential short covering. However, resistance near 25,000
# Key Technical Levels
- Support Levels:
Immediate support is at 24,400–24,000, aligning with the 20-day EMA and recent lows. A break and close below 24,000 could lead to further selling toward 24,099 or 23,500, a strong support level backed by put option open interest.
Weekly pivot support is at 23,559, with deeper support at 23,000.
- Resistance Levels:
Immediate resistance is at 25,000, with a confluence of weekly and monthly resistance at 25,297–25,575, reinforced by Fibonacci Retracement levels.
A sustained break above 25,100 could target 25,500–25,700, with potential for 26,161 by expiry if momentum persists.
-- Disclaimer --
This analysis is based on recent technical data and market sentiment from web sources and X posts. It is for informational purposes only and not financial advice. Trading involves high risks, and past performance does not guarantee future results. Always conduct your own research or consult a SEBI-registered advisor before trading.
E&OE
26 may Nifty50 important levels trading zone#Nifty50 #option trading
🚀 If you like my trading plan and levels, don't forget to boost the post
99% working trading plan ( Opning Possibility FLAT to down )
👉Gap up open 24960 above & 15m hold after positive trade target 25140, 25370
👉Gap up open 24960 below 15m not break upside after nigetive trade target 24790 , 24670
👉Gap down open 24790 above 15m hold after positive trade target 24960 ,
👉Gap down open 24790 below 15m not break upside after nigetive trade target 24670, 24540
📌 Trade plan for education purpose I'm not responsible your trade
More education follow social media and boost my idea
📌 koi bhi trade leval se 20 point ke sl ke bhina karan nahi hi
📌 koi trade app activate tabhi karana hota hi level pe 2 candle uper ya niche closing aati hai to
📌 leval par Ane pe turant trade plan na kare ...
📌 Full risk apaki hi hi meri nah

Nifty 23rd directionExpecting Nifty to draw to 24735
tomorrow
The gap lower at 24402 could
serve as a place for very good longs
My eyes are on 24725 to be traded to
tomorrow preferably at open

Nifty 50 Technical Analysis - May 23, 2025Nifty 50 Technical Analysis - May 23, 2025
Current Market Overview:
Closing Price: The Nifty 50 closed at 24,637, Down 203 points.
Day Range: Low: 24,500.00 | High: 25,000.00
Market Sentiment: The market exhibited strong bullish momentum, driven by positive global cues, including a ceasefire between India and Pakistan and optimism around US-China trade negotiations
Chart for your reference

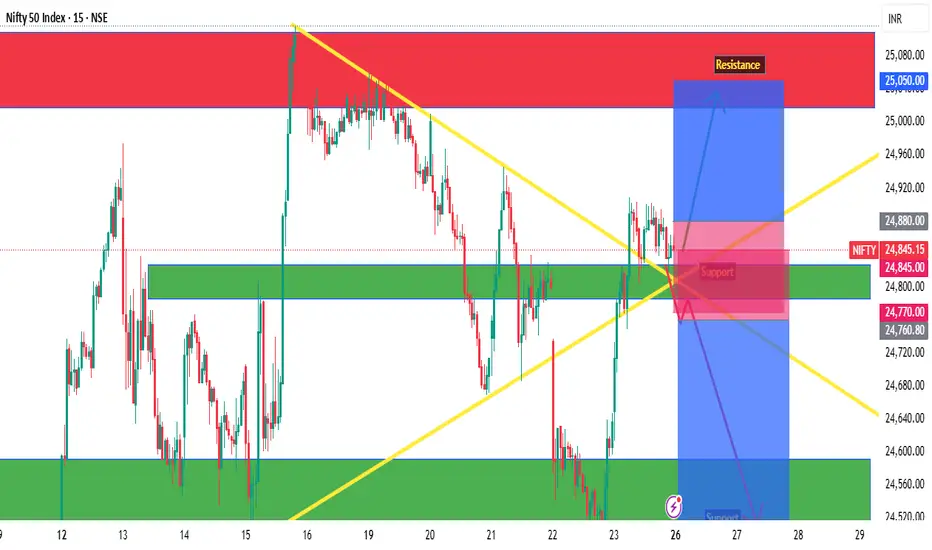
NIFTY : Trading levels and plan for 23-May-2025📊 Nifty Trading Plan – 23-May-2025
Chart Timeframe: 15 Min | Reference Spot Price: 24,637
Gap Opening Threshold: 100+ Points
🚀 Gap-Up Opening (100+ Points Above Previous Close)
If Nifty opens above 24,737 (i.e., 100+ points higher), it will directly enter the critical Opening Resistance Zone: 24,761 – 24,790 .
🟥 This zone has historically shown supply pressure, and a direct gap-up into it might lead to either a quick rejection or consolidation.
✅ Plan of Action:
– Avoid immediate long trades at open if price opens inside this zone.
– Wait for a 15-min candle to close above 24,790 to confirm bullish strength. If successful, Nifty could aim for 24,974, the last intraday resistance.
– If a bearish rejection pattern forms (like an inverted hammer or bearish engulfing) in this zone, consider a sell-on-rise setup targeting a retest of 24,648 and possibly down to 24,577.
– Ideal stop loss for shorts: Above 24,800–24,810.
🎓 Educational Insight: Gap-ups into resistance zones often trap breakout traders. Patience is key—let price confirm before acting.
📈 Flat Opening (within ±100 Points from Previous Close)
If Nifty opens between 24,537 – 24,737, it will be inside the indecisive zone between support and resistance.
🟧 This is often a low-conviction zone where both buyers and sellers test each other, causing choppy price action in the initial 30 minutes.
✅ Plan of Action:
– Avoid trading in the very first 15–30 minutes; let the market provide direction.
– If price holds above 24,648 and breaks out of 24,761, it can extend toward 24,790, and possibly test 24,974.
– If price fails to hold 24,577 and slips below 24,521, expect downside toward 24,196, the major support zone.
– Inside this range, prefer to trade only on confirmed breakouts or breakdowns with volume support.
🎓 Educational Insight: In flat openings, fakeouts are common. Let breakout candles be confirmed with size and volume.
📉 Gap-Down Opening (100+ Points Below Previous Close)
If Nifty opens below 24,537 (i.e., near 24,500 or lower), it will be close to the strong Opening Support Zone: 24,521 – 24,577 .
🟩 This zone has previously acted as a demand area and could attract buyers trying to play a reversal.
✅ Plan of Action:
– Observe price behavior near 24,521.
– If bullish reversal patterns emerge (e.g., hammer, bullish engulfing), and Nifty holds above this zone, consider long trade setups targeting a move back to 24,648 and potentially 24,761.
– If Nifty breaks down with a 15-min close below 24,521, sellers may gain control. Look for a further decline to 24,196, the last strong support.
– Ideal stop loss for longs: Below 24,500.
– Ideal stop loss for breakdown shorts: Above 24,540.
🎓 Educational Insight: Don't blindly buy into support zones—watch for confirmation candles to avoid catching a falling knife.
🛡️ Options Trading – Risk Management Tips
✅ Trade with a predefined stop-loss based on spot levels, not just option premiums.
✅ Use ATM or slightly ITM options to minimize time decay and benefit from delta movement.
✅ Avoid buying OTM options at open, especially on flat or range-bound days .
✅ Don’t trade in No Trade Zones (24,577 – 24,648) unless a clear breakout/breakdown happens.
✅ Book partial profits and trail SL once your trade starts working.
✅ Never overleverage —risk only 1–2% of your capital per trade.
✅ Take a break after 2 stop-losses ; overtrading reduces clarity and increases risk.
📌 Summary & Conclusion
🔹 Opening Resistance Zone: 24,761 – 24,790
🔹 Last Resistance: 24,974
🔹 Opening Support / Resistance Mid-Zone: 24,648
🔹 Support Zone: 24,577 – 24,521
🔹 Last Support: 24,196
🕒 First 15–30 mins are crucial . Let price action unfold before executing any trade.
🎯 Only enter trades after confirmation candles near key zones .
⚖️ Risk-to-reward setups are best near edges of the support/resistance levels , not in the middle zone.
📈 Trend confirmation + volume + candlestick patterns = High Probability Setup .
⚠️ Disclaimer:
I am not a SEBI-registered analyst. This trading plan is shared for educational and informational purposes only. Always consult with a registered financial advisor before taking any investment or trading decisions.
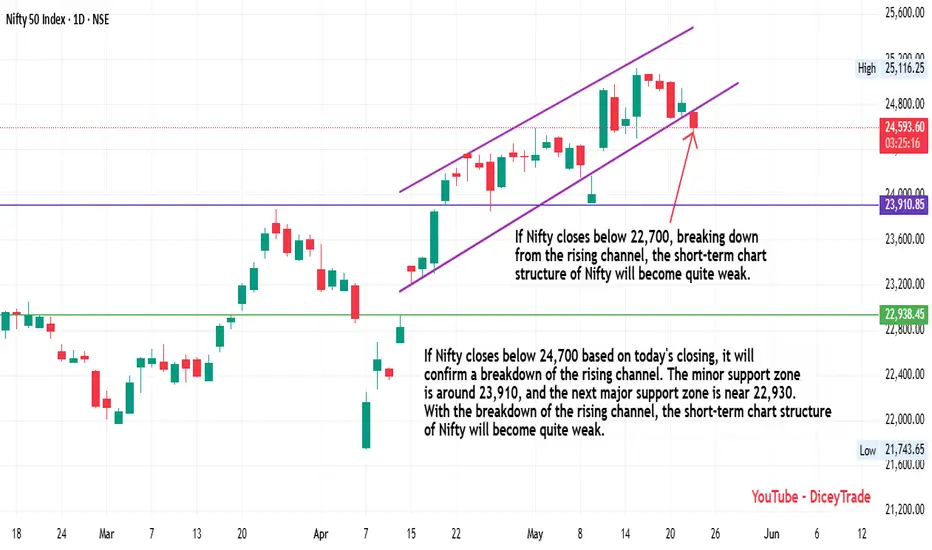
Nifty Rising Channel Breaking Down? Shocking Market Analysis!If Nifty closes below 24,700 based on today's closing, it will confirm a breakdown of the rising channel. The minor support zone is around 23,910, and the next major support zone is near 22,930. With the breakdown of the rising channel, the short-term chart structure of Nifty will become quite weak.
NIFTY : Trading levels and Plan for 22-May-2025📊 Nifty Trading Plan – 22-May-2025
Chart Timeframe: 15 Min | Reference Price: 24,800
Gap Opening Threshold: 100+ points
🚀 Gap-Up Opening (100+ Points Above Previous Close)
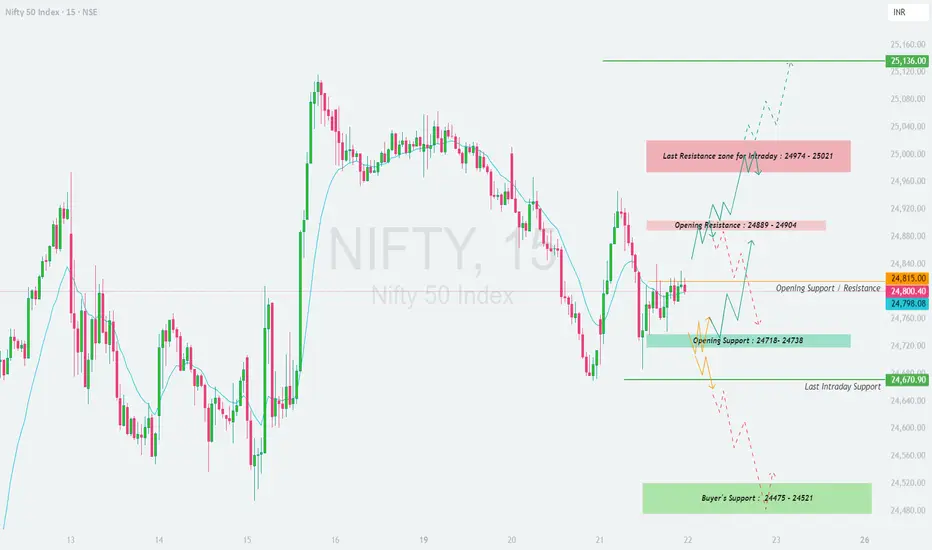
If Nifty opens above 24,900+, the price is likely to open directly inside or just below the Opening Resistance Zone: 24,889 – 24,904 .
🟥 This is a supply area and could trigger initial selling if price shows signs of rejection (wicked candles, indecision). Traders must avoid chasing longs on open and instead wait for either a breakout or rejection.
✅ If price sustains above 24,904 with a strong bullish candle close (preferably 15min or 1hr), you can initiate long trades targeting the Intraday Resistance Zone: 24,974 – 25,021 . If momentum continues, watch for a potential rally toward 25,136.
🔄 On the flip side, if the opening is followed by sharp rejection at 24,904 and the price falls back below 24,860, it may signal a failed breakout and can be a shorting opportunity back toward 24,800 and even the support zone at 24,738–24,718.
🎯 Plan of Action:
– Avoid impulsive longs at open.
– Long only on candle close above 24,904.
– Short if strong rejection appears and price falls below 24,860.
📈 Flat Opening (within ±100 Points)
If Nifty opens around 24,750 – 24,850, the price will be stuck between a crucial resistance (24,889–24,904) and support (24,738–24,718).
🟨 The initial price action will be range-bound. Let the market settle in the first 15–30 minutes and observe whether it breaks the upper resistance or support zones .
🟢 If price climbs and breaks 24,904 with a bullish confirmation candle, it opens the path to move higher toward 24,974 – 25,021, and eventually 25,136.
🟠 Conversely, if the price starts slipping below 24,718, and especially below 24,670.90 (last intraday support), sellers could gain control and drag the price toward the major demand zone 24,475 – 24,521 (Buyer's Support Zone).
🎯 Plan of Action:
– Wait for breakout from either 24,904 or breakdown below 24,718.
– Long trade setup above 24,904 with SL below breakout candle.
– Short setup below 24,718 with SL above breakdown candle.
📉 Gap-Down Opening (100+ Points Below Previous Close)
If Nifty opens around 24,650 or lower, it is opening directly near the Last Intraday Support: 24,670.90 .
🟦 This support can trigger a bounce if defended, and could present a quick long trade back toward 24,718 – 24,738 , possibly even 24,800 if momentum sustains.
🔻 However, if the price fails to hold this support and breaks below 24,670.90 early in the session, bears could take it down to the Buyer's Support Zone: 24,475 – 24,521 .
📌 Watch this green zone for possible bottom-fishing or reversal setups, especially if there’s a bullish reversal candle with volume. Otherwise, a clean breakdown below 24,475 could extend selling pressure further.
🎯 Plan of Action:
– If support holds → Buy on bullish reversal with tight SL.
– If breakdown below 24,670 → Short with target 24,475 zone.
– Below 24,475 → Avoid bottom fishing unless confirmed reversal.
🛡️ Risk Management Tips for Options Traders
✅ Avoid buying deep OTM options at the open; they lose premium fast if the move doesn't come immediately.
✅ Position sizing is key —never risk more than 1–2% of your capital on a single trade.
✅ Use Stop Loss based on spot level breakout/failure , not on premium value.
✅ Don't average losing trades. Wait for structure re-entry if SL hits.
✅ Trail your profits if in the green—book partials or move SL to cost to protect gains.
✅ Avoid trading first 15 minutes unless you're experienced in handling volatility.
📌 Summary & Conclusion
– Opening Resistance: 24,889 – 24,904
– Intraday Resistance: 24,974 – 25,021 | Final Target: 25,136
– Opening Support: 24,718 – 24,738 | Last Intraday Support: 24,670.90
– Major Buyer’s Support: 24,475 – 24,521
🎯 Key Idea: Trade the reaction at zones, not the prediction. Let the price action confirm your bias. Don’t rush into positions at the open—wait for confirmation to improve your risk-reward ratio.
⚠️ Disclaimer:
I am not a SEBI-registered analyst. This trading plan is shared for educational and informational purposes only. Please consult your financial advisor before making any investment or trading decisions.
22 may Nifty50 important levels trading zone#Nifty50 #option trading
🚀 If you like my trading plan and levels, don't forget to boost the post
99% working trading plan
👉Gap up open 24878 above & 15m hold after positive trade target 25078, 25273
👉Gap up open 24878 below 15m not break upside after nigetive trade target 24590, 24390
👉Gap down open 24718 above 15m hold after positive trade target 24878 , 25078
👉Gap down open 24718 below 15m not break upside after nigetive trade target 24618, 24418
📌 Trade plan for education purpose I'm not responsible your trade
More education follow social media and boost my idea
📌 koi bhi trade leval se 20 point ke sl ke bhina karan nahi hi
📌 koi trade app activate tabhi karana hota hi level pe 2 candle uper ya niche closing aati hai to
📌 leval par Ane pe turant trade plan na kare ...
📌 Full risk apaki hi hi meri nahi

21 may Nifty50 important levels trading zone#Nifty50 #option trading
🚀 If you like my trading plan and levels, don't forget to boost the post
99% working trading plan
👉Gap up open 24810 above & 15m hold after positive trade target 24970, 25080
👉Gap up open 24810 below 15m not break upside after nigetive trade target 24590, 24390
👉Gap down open 24590 above 15m hold after positive trade target 24810, 24970
👉Gap down open 24590 below 15m not break upside after nigetive trade target 24390, 24230
📌 Trade plan for education purpose I'm not responsible your trade
More education follow social media and boost my idea
📌 koi bhi trade leval se 20 point ke sl ke bhina karan nahi hi
📌 koi trade app activate tabhi karana hota hi level pe 2 candle uper ya niche closing aati hai to
📌 leval par Ane pe turant trade plan na kare ...
📌 Full risk apaki hi hi meri nahi

NIFTY : Trading Levels and Plan for 21-May-2025📅 NIFTY Trading Plan – 21st May 2025
🕘 Timeframe: 15-Minute | 🧠 Approach: Structure + Reaction Zones + Momentum Psychology
📊 Key Price Zones to Watch:
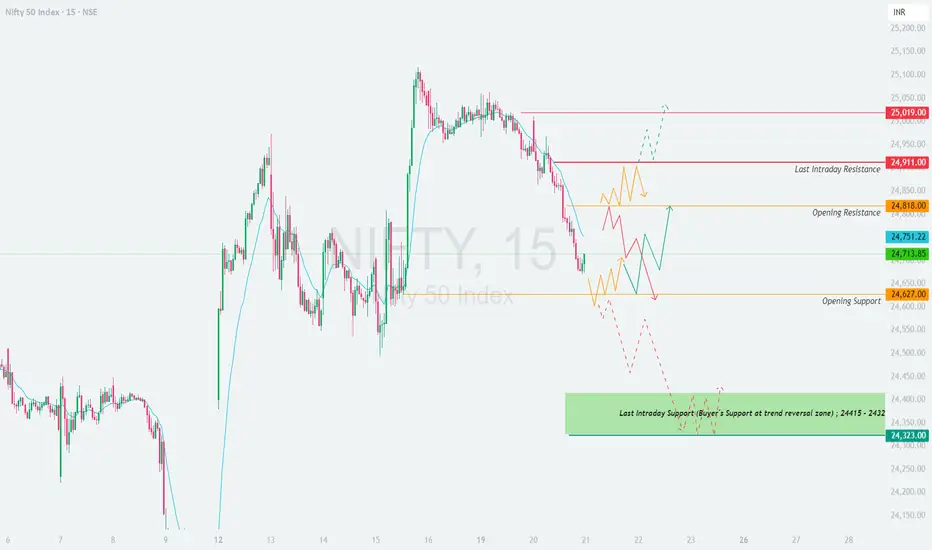
🔴 Last Intraday Resistance: 24,911
🔺 Breakout Resistance: 25,019
🟠 Opening Resistance: 24,818
🟢 Opening Support: 24,627
🟩 Buyer’s Demand Zone: 24,415 – 24,432
🧱 Critical Demand Base: 24,323
📈 Scenario 1: GAP UP Opening (🔼 100+ points) – Opening Above 24,818
If Nifty opens directly above the Opening Resistance of 24,818 due to a bullish gap-up, it enters a low-volume zone that could push prices toward 24,911 and even 25,019 .
Do NOT chase long entries blindly post gap-up. First 15–30 minutes will decide the strength of bulls.
If a strong 15-minute candle closes above 24,911 , a potential breakout to 25,019 may play out.
Only enter long trades if price holds above 24,911 with good volume.
If price faces rejection at 24,911 , short-term reversal trades back to 24,818 → 24,750 are possible.
Avoid overtrading above 25,019 ; it’s uncharted territory and momentum may fade quickly.
📌 Educational Note: Gap-ups often trap emotional buyers. Look for signs of sustainability before entering. If candles show exhaustion or long upper wicks, it's a red flag.
⚖️ Scenario 2: FLAT Opening (±100 points) – Between 24,627 to 24,818
A flat opening gives both bulls and bears room to maneuver, making it the most flexible condition to work with structure-based plans.
If price sustains above 24,750–24,760 (the pivot area), buyers may push toward 24,818 → 24,911 .
Clear bullish strength beyond 24,911 can target 25,019 , but only after volume confirmation.
On the flip side, if price breaks below 24,627 , short trades toward the Demand Zone: 24,415–24,432 become active.
Wait for bearish structure (e.g., breakdown + retest rejection) to confirm shorts.
Use the opening 15-minute candle high/low as your first trigger range for bias.
📌 Educational Note: Flat opens are all about who dominates first. Let the market decide. Don’t be early; price action is your teacher — not your ego.
📉 Scenario 3: GAP DOWN Opening (🔽 100+ points) – Opening Below 24,627
A gap-down opens doors to panic-selling but also offers opportunity if the demand zone absorbs pressure.
If price opens around 24,550–24,600 and forms a base, a bounce toward 24,627 → 24,750 is highly probable.
However, if price immediately slides into 24,415–24,432 (buyer zone), watch for reversal patterns like hammer, bullish engulfing, or double bottom.
If breakdown occurs below 24,415 , then 24,323 becomes the final lifeline. A close below this may trigger sharp intraday sell-offs.
Only short if 15-min candle closes below 24,415 and fails retest.
📌 Educational Note: Panic gaps test emotional discipline. Don't assume rebounds—wait for confirmation. It's okay to miss the first move and catch the trend later.
🛡️ Options Trading – Risk Management Tips:
✅ Avoid Far OTM Buying: Unless you see trending moves, far OTM options will decay quickly.
✅ Use Defined-Risk Spreads: Prefer Bull Call or Bear Put Spreads on breakout/breakdown confirmations.
✅ Keep SL Fixed in % Terms: Suggested: 30–40% SL of premium for option buyers.
✅ Use the Opening Candle High/Low: As SL reference for naked option positions.
✅ Avoid Overnight Carry: Especially for naked options—risk can be unlimited.
✅ Reassess After 2 Failed Trades: Market might be rangebound or volatile beyond logic.
📌 Summary & Conclusion:
🔼 Above 24,911: Momentum bullish → Target 25,019
🔄 Between 24,627 – 24,818: Neutral zone → Let structure form
🔽 Below 24,627: Weakness → Test of 24,432 → 24,323 possible
📌 Core Principle: Let the market confirm your bias. Be a sniper, not a machine gunner. Clear structure = clear edge.
📢 Disclaimer:
I am not a SEBI-registered analyst . This content is purely for educational and informational purposes [/b
NIFTY TO 25500!!! Don't miss.Price is now consolidating and trading inside the daily fvg.
For me today or tomorrow it will reach 25500 in points.
Just analysis and try to take a position by yourself model.
Or else just buy an ITM option and wait for price to reach 25500 literally+2% move.
It's your own risk, before take a trade , do your own analysis.
