22 April nifty trading zone#Nifty50 #option trading
99% working trading plan
👉Gap up open 24238 above & 15m hold after positive trade target 24508,
👉Gap up open 24008 below 15 m not break upside after nigetive trade target 24008, 23853
👉Gap down open 24008 above 15m hold after positive trade target 24238 , 24508
👉Gap down open 24008 below 15 m not break upside after nigetive trade target 23853, 23653
💫big gapdown open 23853 above hold 1st positive trade view
💫big Gapup opening 24508 below nigetive trade view
📌 Trade plan for education purpose I'm not responsible your trade
More education follow & support me
Niftyprediction

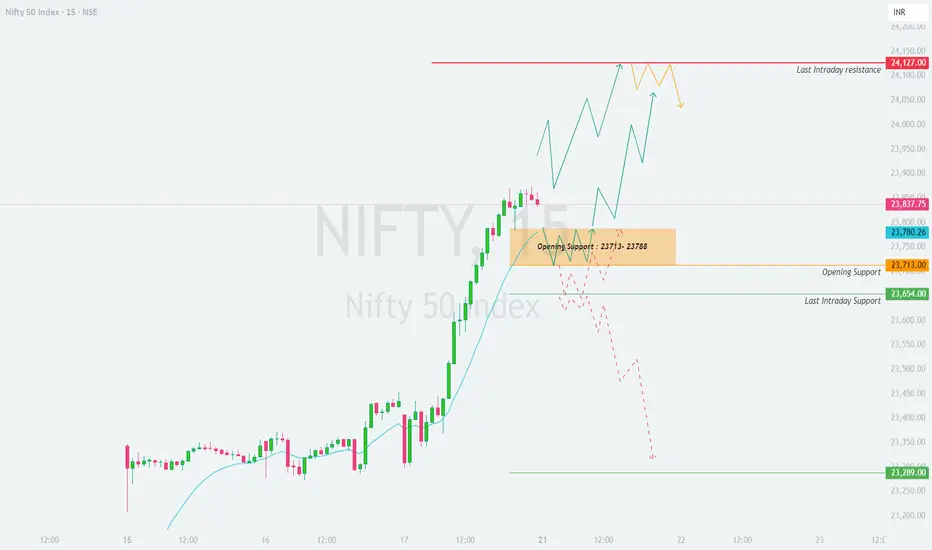
NIFTY : Trading levels and Plan for 21-Apr-2025📘 NIFTY TRADING PLAN – 21-Apr-2025
📊 Index Spot Close: 23,837.75 | ⏱ Timeframe: 15-Min | 🚪 Gap Opening Threshold: 100+ Points
🔼 Scenario 1: Gap-Up Opening (Above 23,938+)
If Nifty opens 100+ points higher above 23,938, it will be trading close to the last intraday resistance marked at 24,127. The recent rally has been steep, so profit booking or resistance can emerge at higher levels. Momentum continuation can only be expected if there is consolidation or retest above breakout levels.
📌 Plan of Action:
Allow the index to settle for the first 15–30 minutes to avoid opening volatility.
If price sustains above 24,000 and breaks above 24,127, aggressive buying can be considered for upside momentum. However, trail SL tightly as price enters uncharted territory.
Be cautious if price opens directly near or inside the 24,127 zone – wait for a rejection or reversal sign before considering any short.
Any gap-up followed by selling pressure that brings price below 23,938 could be a gap-fill trap – consider shorting if structure confirms breakdown.
Upside targets after 24,127 breach could be 24,200+ intraday; however, don't chase trades blindly above resistance.
💡 Educational Insight:
A gap-up near resistance should not be chased blindly. Market may trap bulls before turning. Look for higher-low formations or a bullish flag near 24,000+ to confirm strength.
⚖️ Scenario 2: Flat Opening (Between 23,738 – 23,938)
This is a balanced opening where price opens within or slightly above the critical support zone of 23,713–23,788. This range serves as the launchpad or failure point based on early moves.
📌 Plan of Action:
Let the 15-min candle close; avoid trades in the first few bars unless a clean structure forms.
If price sustains above 23,788 and starts forming higher highs, then the market may attempt a breakout toward 23,938 → 24,127. Longs can be taken above 23,850 with tight SL below 23,788.
On the downside, if price starts slipping below 23,713, this zone becomes resistance. Shorts can be planned with targets: 23,654 → 23,500.
Price trapped within 23,738–23,850 might trigger sideways action. Avoid trading inside this range unless breakout or breakdown occurs.
Look for volume confirmation and a clear directional bias before taking positions.
💡 Educational Insight:
Flat opens near crucial supports often lead to decisive moves after initial range expansion. React, don’t predict. The first breakout (up/down) often defines the tone of the day.
🔽 Scenario 3: Gap-Down Opening (Below 23,713)
A gap-down below the orange zone (23,713–23,788) is significant and could trigger a pullback towards the green support levels 23,654 and potentially 23,289.
📌 Plan of Action:
Let the market absorb the gap-down in the first 15–30 minutes — don’t enter impulsively.
If price bounces and reclaims 23,713, stay away from shorts. Look for reversal patterns (e.g. double bottom or engulfing) for long trades with SL below day’s low.
If price stays below 23,713 and breaks below 23,654, initiate shorts with targets at 23,500 → 23,289.
Watch for bullish traps — don't short blindly at supports. Wait for confirmation candles and volume on breakdowns.
In case of deep gap-down directly near 23,289, wait for reversal signs to attempt any long, else avoid bottom-fishing.
💡 Educational Insight:
Support breaks on gap-downs can be strong, but bear in mind — market makers often trap panic sellers. Be alert for false breakdowns and quick reversals.
🛡️ Risk Management Tips for Options Traders 💼🔐
✅ Avoid trading in first 15–30 mins — volatility traps are common.
✅ Use ATM or slightly ITM options to avoid excessive time decay.
✅ Set SL based on structure, not emotions — eg. previous candle low/high.
✅ Avoid over-leveraging — 1-2% risk per trade is optimal.
✅ Keep a max 2-trade rule per direction — don’t overtrade.
✅ Track IV (Implied Volatility) — spreads work better in high IV setups.
✅ Record your trades — wins teach less, losses teach more.
✅ Avoid revenge trading — take a break after a loss, regain calm.
🧾 Summary & Conclusion 🧠📊
📍 Gap-Up (Above 23,938): Watch for resistance at 24,127, avoid chasing highs without retest.
📍 Flat Open (23,738–23,938): Watch for structure near 23,788; breakout above = bullish, rejection = bearish.
📍 Gap-Down (Below 23,713): Possible downside toward 23,654 → 23,289. Reclaim of 23,713 invalidates shorts.
📍 Zone to Watch Closely: 23,713–23,788 (critical intraday pivot for both bulls & bears).
🧘♂️ Final Note: Trade less, trade well. Market gives opportunities daily — protect your capital so you’re around to take them.
⚠️ Disclaimer:
I am not a SEBI-registered analyst . This trading plan is meant for educational purposes only . Please consult a financial advisor or conduct your own research before making any trades. Trading involves risk — always use proper risk management.
Advanced Database TradingIn trading, "database" refers to the collection and organization of market data, used for analysis and decision-making. This data, often including real-time quotes, historical prices, and other relevant information, is stored and managed within a database system for efficient retrieval and manipulation.

Database Trading Part 3Trading data is a sub-category of financial market data. It provides real-time information about stock and market prices as well as historical trends for assets such as equities, fixed-income products, currencies and derivatives. Trading data also includes information about trades historically and over the course of a trading day, such as the latest bid, asking price and time of the last trade.

Candlesticks PatternCandlestick patterns are visual representations of price movements, used in technical analysis to understand and potentially predict future price trends. They are graphical representations of the opening, high, low, and closing prices of a security, currency, or commodity over a specific period. These patterns can offer insights into market sentiment and potential reversals or continuations of trends.

Nifty Expiry Day Play Heads-Up for Tomorrow’s Market (Especially for Expiry Day Players)
So tomorrow could be a strong day for the bulls — but hey, it’s Weekly Expiry for Nifty.
This means: after 2 PM, the game might flip. People might start booking profits, and the trend could slow down or reverse.
Bottom line? Trade smart. No need to rush — let the market show its hand first.
If You’re Looking to Buy:
Case 1:
Market opens near 23,500
Takes a bounce from 23,450 (today’s high)
→ That’s your green signal to go long.
Expected Gain: 75–100 points
Safety Tip: Place your stop-loss just below support.
Case 2:
Market opens flat
Drops to around 23,400–23,380
→ That’s a strong demand zone. Could be a good entry for buyers.
If You’re Looking to Sell:
Case 1 (After 2 PM):
Market shows signs of reversal from the top levels
→ Plan your short trade from there.
Target: 80–120 points
But remember: Let the market form a peak first — don’t jump the gun.
Case 2 (Breakdown Setup):
Nifty slips below 23,350
Stays weak for at least 15 minutes
→ Possible drop toward 23,250–23,200.
Pro Tips:
Don’t overstay in trades on expiry day — it can turn risky.
Grab your profits early. Quick scalps > long holds.
Wrote this with real effort — if it helps even a bit, that’s a win!

Explanation of RSI ( Relative Strength Index)The Relative Strength Index (RSI) is a momentum indicator used in technical analysis to measure the speed and magnitude of price changes, helping identify potential overbought or oversold conditions in a market.

Support and Resistance part2Support occurs at the point where a downtrend is expected to pause due to a concentration of demand. Resistance occurs at the point where an uptrend is expected to pause due to a concentration of supply.

Meaning of Management and PsychologyManagement psychology explores how psychological principles and insights can be applied to understand and improve management practices within organizations. It helps managers understand human behavior, motivation, and decision-making processes, ultimately leading to more effective leadership and a better work environment.

Swing Trading AnalysisSwing trading involves the use of technical analysis to identify potential trading opportunities and actively working to make trades based on perceived trends in the market. Popular swing trading indicators include moving averages, RSI, Stochastic oscillator, volume, support and resistance, and ease of movement.

MACD Analysis Part-2Moving average convergence/divergence (MACD) is a technical indicator to help investors identify price trends, measure trend momentum, and identify entry points for buying or selling. Moving average convergence/divergence (MACD) is a trend-following momentum indicator that shows the relationship between two exponential moving averages (EMAs) of a security’s price. MACD was developed in the 1970s by Gerald Appel, and is one of the most popular technical tools, readily available on most trading platforms offered by online stock brokers.

Option and Database TradingOption trading involves buying or selling contracts that grant the right, but not the obligation, to buy (call option) or sell (put option) an underlying asset at a specific price within a certain time frame. It's a form of derivative trading, where the value of the option is linked to the price of the underlying asset, such as stocks, indices, or ETFs.

More About RSIRSI is a tool that aids traders in capturing market momentum by measuring the fluctuation in prices. Traders rely on RSI to spot oversold and overbought markets and determine the right time to enter a trade. RSI helps traders identify whether a stock is either overbought or oversold.

RSI and RSI Divergence Part 2RSI (Relative Strength Index) is a momentum indicator that measures recent price changes to assess if an asset is overbought or oversold. RSI divergence occurs when the price of an asset and its RSI move in opposite directions, potentially indicating a trend reversal or weakening trend. There are two main types: bullish divergence (price makes lower lows while RSI makes higher lows) and bearish divergence (price makes higher highs while RSI makes lower highs).

Explanation of RSIRSI is a tool that aids traders in capturing market momentum by measuring the fluctuation in prices. Traders rely on RSI to spot oversold and overbought markets and determine the right time to enter a trade. RSI helps traders identify whether a stock is either overbought or oversold.

Advanced Divergence Trading AnalysisA positive divergence means price is making lower lows while an indicator/oscillator is making higher highs. On the other hand, a negative divergence happens when price is making higher highs while an indicator/oscillator is forming lower lows.

Price Action Trading Price action trading is a strategy where trades are made solely based on an asset's price movements, without relying on indicators or external analysis.

Option and Database tradingOptions data providers collect specific data points that can later be used to determine price movements over time. These price changes in the stock market help investors and brokers decide which stocks might be ideal to sell or buy given current market conditions.

Candlesticks Pattern Candlestick patterns are graphical representations of price movements used in technical analysis to identify potential future price trends and reversals, based on the open, high, low, and close (OHLC) prices of a security over a specific period.

Explaning about MACDThe Moving Average Convergence Divergence (MACD) is a popular momentum indicator in technical analysis, created by Gerald Appel in the late 1970s. It helps identify trends and reversals by calculating the difference between two moving averages, typically based on historical closing prices.

Technical Trading analysisTechnical analysis in trading is a method that uses historical price and volume data to predict future price movements, identifying patterns, trends, and signals to assist traders in making informed decisions.

Advanced Divergence Trading Basically, a divergence exists when your indicator does not “agree” with price action. Granted, this is very basic and we will now explore more advanced divergence concepts and see how to trade them, but it's important to build a solid foundation. Bearish and bullish divergence. Price and indicator are out of sync.

Database Trading In the context of trading, "database trading" or "data trading" refers to using data, often from financial markets, to gain knowledge and make better trading decisions, potentially automating the process.
