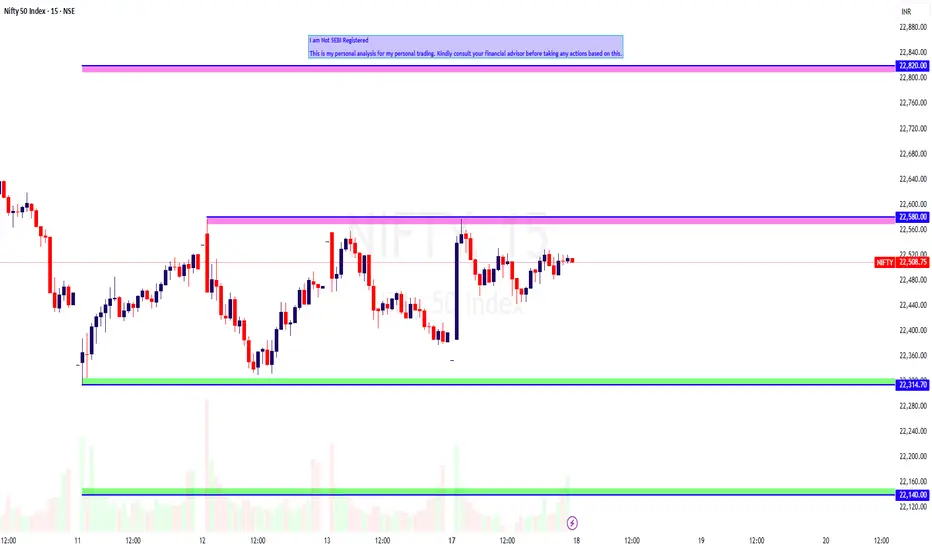
NIFTY Intraday Trade Setup For 18 Mar 2025NIFTY Intraday Trade Setup For 18 Mar 2025
Bullish- Above 22580
Invalid-Below 22530
T- 22820
Bearish-Below 22310
Invalid-Above 22360
T- 22140
NIFTY has closed on a bullish note with 0.5% gain today. It has been trading inside range of 22600 and 22300 since last 4 sessions. Hourly key levels are 22700 and 22300. One should wait for this range to break to trade directional. As intraday move are too choppy to trade. Index is bearish till it is below 50 EMA in daily TF. Although it is bearish always looks for bearish price structure to short if pullback come.
Coming to Tuesday's trade setup, if index opens flat and a 15 Min candle closes above 22580 then we will long for the target 22820.
For selling we need a 15 Min candle close below 22310. T- 22140.
In case of a big gap up/down, wait till 10 o'clock and mark the high and low of the trading range (5MIN). Trade on this range breakout.
==========
I am Not SEBI Registered
This is my personal analysis for my personal trading. Kindly consult your financial advisor before taking any actions based on this.
Niftyprediction
Nifty weekly analysis for 17/03/2025Nifty is trading between 100 EMA (weekly) and 20 EMA (daily). A good support from the weekly moving average is there and resistance on the daily charts.
A continuous support from 22300 level is there as the market has remained in a range whole week.
If the market tried to breach the support level, the support of weekly 100 EMA can be the other support around 22030 else it will take support around 21800.
In case the market starts to recover from the bottom and creates a higher high higher low formation it has to take out the resistance of 22650 and 22758.
Major levels are plotted in the charts. Just wait for the price action to confirm the entry into a trade else another sideways market can be seen.
Inside candle formation on the daily charts is also there and break out/down can be traded accordingly. Different trading approaches can help in capturing a good trade.
Wait for the price action near the levels before entering the market.

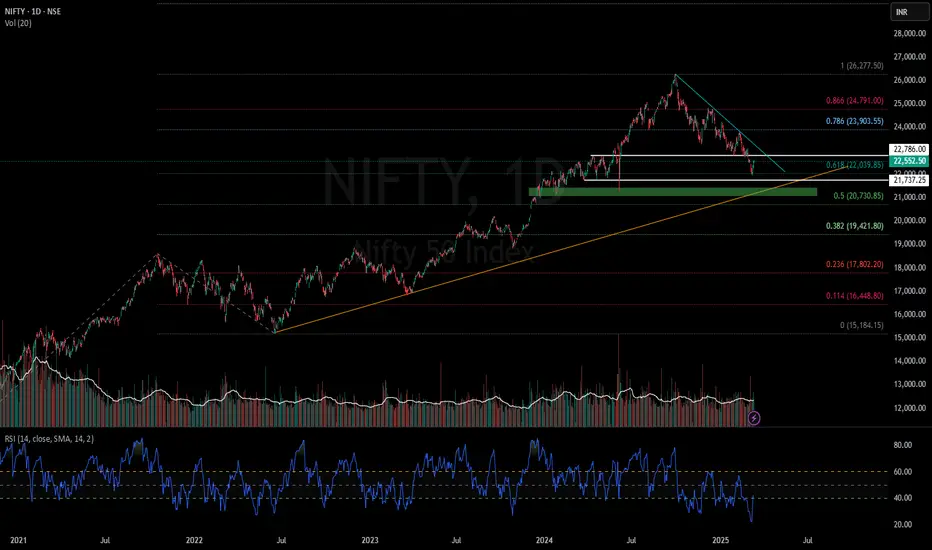
Is "NIFTY" Going to Exhaust?Hey guys, after half of a decade before climbing to this level from 2020, NIFTY has showed some signs of falling from the high it was peeking in the past months. We see a parallel channel breaking at the point of market with market testing the channel back along with bearish signals on 1hr time frame and other companies falling price indicates that market had been overbought too much and it has to correct before going up again.
Targets we are getting are near 20,000 and 18000. People might find it impossible but it's not, cause if u use fibonacci retracement you will get these levels along with in the years 2015 and 2016 almost 25% fall has been seen an in the years 2011 and 2012 almost 30% fall can be seen and its obvious to all of us that the market are a little too high which can help us cling to the point that NIFTY can experience a bear market.
With this, signing off for today 🙏

NIFTY 22000!!!! OR 21650!!????according to my analysis nifty is heading down, it's loosing momentum towards upside.
So price action shows lots of bearishness. Maybe tomorrow ( Friday) going to be a big move towards downside. It will reach 22000, in extreme it will reach 21650 within next week.
Comment your thoughts and learn to trade by yourself is good for you.

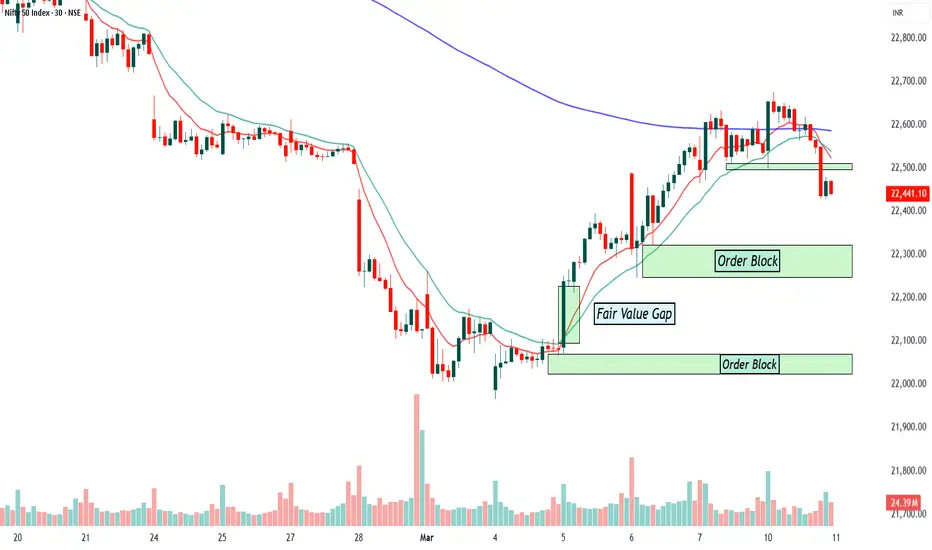
Nifty SMC Chart AnalysisOrder Blocks (OB): These are highlighted in green rectangles and represent areas where institutional traders (smart money) previously placed large buy or sell orders. Price often reacts to these areas by reversing or consolidating before continuing in the trend direction.
Fair Value Gap (FVG): Marked in the chart, this represents an imbalance in price action where there was aggressive buying or selling without enough opposing trades. Price tends to fill these gaps before resuming its trend.
Moving Averages & Trend Indications: The red and green lines appear to be moving averages, used to determine the trend. The blue line (possibly a 200 EMA) acts as a dynamic resistance level.
Recent Price Action: Price was in an uptrend but recently broke below the short-term support level around 22,500. A bearish candle with strong volume suggests potential further downside movement.
Forecast Based on SMC:
Bearish Bias in the Short Term: The price has broken below a key support level and is testing an order block. If this level does not hold, the price may continue dropping toward the next order block around 22,300 or even 22,100.
Possible Reaction from Order Blocks: If buyers step in at the 22,300 order block, we could see a bullish reversal. If the 22,300 level fails, price may reach the lower order block at 22,100 before finding strong support.
Liquidity Consideration: If the price sweeps below the 22,300 level, it may be a liquidity grab before reversing upwards. Traders should watch for bullish confirmations (e.g., bullish engulfing candle, higher lows, or support retest).
Trading Strategy:
Bullish Scenario: Look for a bounce at order block zones (22,300 or 22,100) before entering a long trade. Confirmation could come from price action patterns like bullish engulfing candles or a higher low formation.
Bearish Scenario: If price fails to hold above the order block at 22,300, it could drop further to 22,100 or even lower. A break and retest below 22,300 could provide a short entry opportunity.
Final Thoughts:
Short-term bearish, but watch for a reversal at order blocks.
If the price breaks below 22,300, expect a further drop to 22,100.
If bullish momentum returns, price may recover towards 22,500.
This is educational post and not a buy and sell recommendation and always consult your financial advisor before trading or investing.
NIFTY50 - TRADING NEAR KEY SUPPORT ZONESymbol - NIFTY50
CMP - 22250
The Nifty50 index continues to maintain a negative bias, with the price action suggesting that it remains within bearish trend. This indicates the continuation of the downtrend, though we are currently seeing the index testing key support levels. At the moment, Nifty is trading near the 22200 area, which is a critical support zone. Technical indicators are also hinting at the fact that markets are oversold at current levels. Given the underlying support zone & oversold conditions, there's a high probability of a short-term bounce before the downward momentum resumes.
Looking at the immediate price structure, we are likely to witness a potential retracement towards resistance zones around 22800 and 23000. These levels are in line with the Fibonacci retracement levels, offering opportunities to enter long positions with a favorable risk-reward ratio. Traders can look for a bounce from current support levels and expect a move towards these resistance zones.
we are now at a critical juncture where a potential bounce could provide opportunities for short-term longs.
Given the technical setup, I am taking long positions in Nifty Futures at CMP 22250. I will look to add more positions if the price reaches 22100-22050 range. My SL is set at 21970 to manage risk, ensuring protection in case the price fails to hold the demand zone and continues lower.
Key resistance remains around 23400. A sustained move above this range could suggest a potential shift from a bearish trend to a neutral or even bullish outlook. However, until the index decisively moves above these levels, the preferred strategy remains to sell at resistance and buy at support, capitalizing on any short-term retracements.
In conclusion, while the short-term outlook offers potential for a bounce, the broader trend remains bearish. Therefore, the approach should be to look for long positions at favorable support levels.
Disclaimer: The information provided here should not be construed as a buy or sell recommendation. It reflects my personal analysis and my trading position. Please consider this trading idea for educational purposes only. Thank you!

Can NIFTY Regain Its Balance or Will It Plummet Further?Timeframe: 4h
After reaching a peak of 26,277 , the NSE NIFTY has begun to decline within a downward parallel channel. The Elliott wave structure can be identified as (W) – (X) – (Y) , where wave (X) peaked at 24,867 , followed by a downward movement for the final wave (Y). The price has fallen below the 20 , 50 , 100 , and 200 EMA levels, with an ATR of 166.36 .
The correction has several key levels to consider:
At 100% retracement of wave (W) at 21,962
At 100% retracement of wave (a) at 22,827
At the lower boundary of the corrective channel
Bearish sentiment is currently stronger than buyer demand. A reversal may occur either after a breakout from the parallel channel or at the lower boundary of the channel. This is possible as long as the swing low of 21,283 remains intact.
We will update further information soon.

Nifty50 If a hourly candle sustains or Close below white trend line then it could test 22490 -- 22505 within 11th March .
Disclaimer :
It's a personal view not a financial advice and I assume no responsibility and liability whatever outcome arises.

Nifty 22900 confirm!!!!!!!!!Last week I share I view, you can go and check out.
It's moving towards 22900 which 50% Fibonacci level.
For me today first one hour is pretty bullish so I anticipate that candle low can't be taken out.
So place stoploss at there and target 22900.
This is my trade stoploss and target.
Learn to trade by yourself is better for you.
Leave a comment.if you like.

Nifty - Sell on RiseStrong supply area in multiple time frames like Daily / 125 / 75
Also a strong gap area
Expected resistance zone to fall between 22630 - 22730
Upside Sl above 22800
Downside targets 22400 & 22000
Entry with 15/25 min candle confirmation only

Nifty weekly analysis for 10/03/2025.Is this the end of the fall or its just a retracement. The market after a while has given some hope of a green week.
It is a retest or a base formation no body knows. Nifty is trading around 22550 levels and looks somewhat positive for the coming week.
Market is still in the down trend and bullish trend will only be confirmed once a 'W' pattern is formed on higher time frame or a break out is done.
On the hourly charts, market remained in a range for the last trading session, the sideways market can continue as it may form a base and trend reverses from here.
In case the market remains in the trend lower levels of 21800-850 might be coming. Else market may start travelling on the higher side hitting the resistance levels.
Major support levels :- 22310-360, 22050-090
Resistance levls :- 21620, 21760
A gap filling trade on the higher side can be seen in the coming week as a gap is pending.
Watch for the price action and trade accordingly. A sideway or volatile market is more probable as the market has been trading in a trend.

Nifty 50 - Mar 2025 view - Is the correction over?If you have followed my last 2 views of Nifty50, you would be smiling definitely only if you didn't have any swings open.
We have seen a good correction in market since September 2024.
It was much needed in market since 2022 , we have seen an extended move in Indian markets.
I know mid and smallcaps have corrected more than 20% but they were bound for it because of overvaluation. We are in a slowdown phase of economy and earnings of those company wont match expectations.
Coming back to Nifty50, is the correction over?
IAnswe is cant be sure but 1 thing is definite, 21800-22000 will act as strong demand zone as we have seen a quick 600 points jump from 22000.
However, I will suggest to wait for confirmation for any new swings.
What next?
Nifty might be retesting 22800 breakdown. It can fall again towards 21800 and if it breaks 21800 which looks very less probable, 21000-21200 is a very very strong demand zone which should be the last zone for correction.
If Nifty manages to jump from 22000, it will be formation of W pattern(double bottom) which will be a sign of reversal. That's when you can start accumulating.
Expecting March to be sideways to bearish again. We might see a selling due to people booking losses for tax harvesting.
If 21800-22000 holds in March, we can see buying in April which will take it to 23900.
Be patient. Start analyzing stocks for accumulating. Stay healthy and wealthy!
NIFTY - Fall is not done yet.Even though current week 500+ points upmove came, NIFTY failed to cross 1 week ago high, which is just 100 points around.
Meantime US policy impact is yet to be seen, as there are negotiations going on.
Due to Indian rupee fall, it may offset some of the tarrif increase - that just devalued indian exports to other countries, while internal inflation taxes every indian indirectly.
Till the white line is crossed, which can happen this week bias should be sell on raise.
I started believing in inside candle formations, as they provide least SL, and prefer 15 mins, 1hr or 4hr charts to make decision, while ensuring position sizing.
So, still sell on raise.

Bitcoin showing weakness. It may test 76076Bitcoin chart is weak now. weakly RSI below 60 MACD also negative. Double top pattern form and correction showing. As per chart it may test 76076 soon. It can short on any bounce up to 92000.
These is Neckline place near 76076 of Inverse H&S pattern. It would be retest of neckline.

NIFTY MATHEMATICAL LEVELSThese Levels are based on purely mathematical calculations.
Validity of levels are upto expiry of current week.
How to use these levels :-
* Mark these levels on your chart.
* Safe players Can use 15 min Time Frame
* Risky Traders Can use 5 min. Time Frame
* When Candle give Breakout / Breakdown to any level we have to enter with High/Low of that breaking candle.
* Targets will be another level marked on chart
* Stop Loss will be Low/High of that Breaking Candle.
* Trail your SL with every candle.
* Avoid Big Candles as SL will be high then.
* This is one of the Best Risk Reward Setup.
For Educational purpose only

NIFTY BUY 22900!!!!!!You can see in the picture
Price is moving towards 22900 area which 50% fib retrace .
Price is looking bullish to reach that area.
I have taken the trade.
I place stoploss on 22246 if that area breaks then my trade is invalid so I am out .
But for now look for bullish 22900 area.
Learn to trade by yourself is better for you.
Leave a comment.

NIfty spot Will the bearishness continue ? Nifty Spot corrected 3000 Points from its all time peak of 26300 odd levels...
right now i n retracement mode...
24800 levels strong resistance...
Pattern and trend lines on chart....
Like..... Share........

NIFTY Analysis for today 6 March 25As we discussed yesterday, Nifty took a pullback from 22000. It has shown a good bullish signal at this level.
If we look at the chart now:
The market is trading at 200 EMA (15 EMA) and 50 EMA (1 H - TF), which is going to provide resistance at this level. The market is trading in the accumulation phase. If it breaks this zone, then the next resistance is a higher trendline at 1D TF, which I shared yesterday.
Support levels: 21987, 21840
Resistance levels: 22400, 22615, 22775, 200 EMA

Nifty 50 upcoming expiry OTM options writing play.so Nifty succesfully has formed two harmonics pattern.
1. 5-0 pattern which typically pesents a bullish view.
2. Cypher pattern which presents a bearish view in a short term.
according to this, one must have to close their CE writing positions at 22180 or 22105.15 and start writing the PE options of 22150 strike or whichever they are comfortable in it. whoever had left their chance in writing it.
if someone is comfortable in futures, than with a tight hedge one can go long at these points.
our stoploss should be below recent low of 21964.60
target 22582 or nearby it.

NIFTY prediction for tomorrow 5th March 25Nifty has been falling continuously for a month. If we look at the structure using price action.
If we look at the chart now:
The market is trading near the support zone. The market might take support at nearly 22,000 levels. Price is trading far away from the EMA, which shows the market is going to take some pullback to the upside. The market is going to be sideways for some time unless it breaks the Pink trendline to the upside.
Support levels: 21840, 21250
Resistance levels: 22775, 23488, 50 EMA, 200 EMA
If we look at the OI data:
PCR = 0.8, which shows a slightly bullish structure in the market. The market has 22100 as max pain. The market has good PE writing at lower levels; 22000 and 21900 have very good PE writing, which will act as good support in this area.
I am expecting
The market is to be sideways unless it breaks the PINK trendline.
Reason:
RSI = 21 shows a bullish structure. (Weak Bearish -> Bulls might start buying, soon)
Price < EMA(13, 50, 200), which indicates a good Bearish structure. (Bearish)
PCR = 0.8 indicates a slightly bullish bias direction in the market.
Price < VWAP shows a good Bearish structure in the market.
Verdict: Sideways
Plan of action:
follow the chart levels. You better go with the bound strategy.

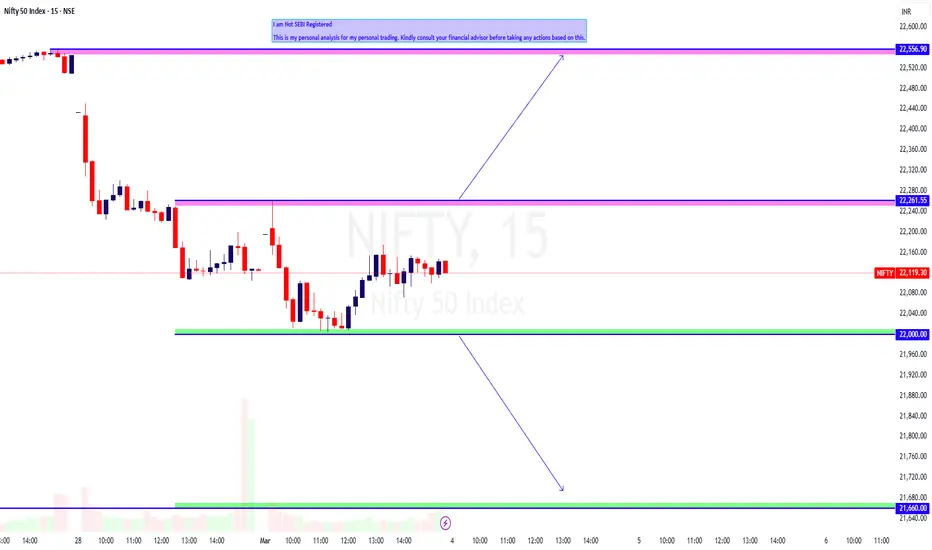
NIFTY Intraday Trade Setup For 4 Mar 2025NIFTY Intraday Trade Setup For 4 Mar 2025
Bullish-Above 22270
Invalid-Below 22220
T- 22550+
Bearish-Below 22000
Invalid-Above 22050
T- 21660
NIFTY has closed on a flat note today, it was a 2 way move day. Index opened gap up and was sold into immediately till 22k. 22000 acted as an intraday support. 21600 zone will be a strong support zone as per 2.0 PRZ in daily and weekly TF. As of now we have been following sell on rise as index is continuously closing below PDH and is below 50 EMA in daily TF. 22270 and 22000 are intraday levels for tomorrow.
Coming to Tuesday's trade setup, if index opens flat and a 15 Min candle closes above 22270 then we will long for the target of 22550+.
For selling we need a 15 Min candle close below 22000. T- 21660.
In case of a big gap up/down, wait till 10 o'clock and mark the high and low of the trading range (5MIN). Trade on this range breakout.
==========
I am Not SEBI Registered
This is my personal analysis for my personal trading. Kindly consult your financial advisor before taking any actions based on this.
NIFTY50 TRADE PLANopen market price plan for nifty 50,
trend = moderately bearish
narrow cpr (breakout is likely)
opening price will confirm direction

Nifty Trading Strategyy for 03rd March 2025📈 Nifty Trade Setup 📉
💰 Entry Strategy:
🔼 Buy Above: The high of the 1-hour candle that closes above 22,250
🎯 Targets: 22,316 | 22,395 | 22,473
🔽 Sell Below: The low of the 15-minute candle that closes below 22,100
🎯 Targets: 22,029 | 21,934 | 21,855
📊 Trade Explanation:
Why wait for a candle close?
A 1-hour candle closing above 22,250 confirms bullish strength, filtering out false breakouts.
A 15-minute candle closing below 22,100 provides an early signal of bearish momentum.
Advantages of this approach:
Reduces false breakouts and whipsaws.
Aligns with price action confirmation, increasing trade accuracy.
Works well with additional indicators like RSI, MACD, Moving Averages, or Volume Analysis for extra confirmation.
⚠️ Disclaimer:
I am not a SEBI-registered analyst or advisor. The information provided here is for educational and informational purposes only and should not be considered as financial or investment advice. Trading in the stock market involves significant risk, and there is no guarantee of profit. You are solely responsible for your trading decisions, and it is strongly recommended to conduct your own research or consult a SEBI-registered financial professional before making any trading or investment decisions. Past performance is not indicative of future results.
