NIFTY MATHEMATICAL LEVELS FOR THIS EXPIRYThese Levels are based on purely mathematical calculations.
Validity of levels are upto expiry of current week.
How to use these levels :-
* Mark these levels on your chart.
* Safe players Can use 15 min Time Frame
* Risky Traders Can use 5 min. Time Frame
* When Candle give Breakout / Breakdown to any level we have to enter with High/Low of that breaking candle.
* Targets will be another level marked on chart
* Stop Loss will be Low/High of that Breaking Candle.
* Trail your SL with every candle.
* Avoid Big Candles as SL will be high then.
* This is one of the Best Risk Reward Setup.
For Educational purpose only
Niftyprediction

Gold Trading Strategy For 24th January 2025Gold Trading Strategy
Buy Strategy:
Condition: Wait for the 15-minute candle to close above 2760.
Trigger: Buy when the price moves above the high of the 15-minute candle that closed above 2760.
Targets: 2773, 2779, 2785
Stop-Loss:
Set a stop-loss order below the low of the 15-minute candle that closed above 2760 to limit potential losses.
Sell Strategy:
Condition: Wait for the 15-minute candle to close below 2747.
Trigger: Sell when the price moves below the low of the 15-minute candle that closed below 2747.
Targets: 2740, 2735, 2729
Stop-Loss:
Set a stop-loss order above the high of the 15-minute candle that closed below 2747 to limit potential losses.
Disclaimer:
This analysis is based on historical data and market trends. Past performance is not indicative of future results. Trading and investment involve risks, and you should conduct your own research or consult with a financial advisor before making any decisions.

Nifty Trading Strategy 23rd January 2025Nifty Trading Strategy
Buy Strategy:
Condition: Wait for the 15-minute candle to close above 23,210.
Trigger: Buy when the price moves above the high of the 15-minute candle that closed above 23,210.
Targets: 23,258, 23,310, 23,360
Stop-Loss:
Set a stop-loss order below the low of the 15-minute candle that closed above 23,210 to limit potential losses.
Trailing Stop-Loss:
Use a trailing stop-loss to lock in profits as the price moves towards the targets. For example, set a trailing stop of 10 points below the current price.
Sell Strategy:
Condition: Wait for the 15-minute candle to close below 23,050.
Trigger: Sell when the price moves below the low of the 15-minute candle that closed below 23,050.
Targets:22,980, 22,950, 22,890
Stop-Loss:
Set a stop-loss order above the high of the 15-minute candle that closed below 23,050 to limit potential losses.
Trailing Stop-Loss:
Use a trailing stop-loss to lock in profits as the price moves towards the targets. For example, set a trailing stop of 10 points above the current price.
Discipline:
Stick to the trading plan and do not deviate from the strategy. Avoid making impulsive decisions based on emotions.
Disclaimer:
I am not SEBI Registered. This analysis is based on historical data and market trends. Past performance is not indicative of future results. Trading and investment involve risks, and you should conduct your own research or consult with a financial advisor before making any decisions.

Nifty-50 Weekly Technical Analysis 👉Based on the available technical analysis for Nifty 50 in 🕝Weekly Time Frame

Nifty outlook for the yearNifty chart analysis for coming few months :
1. Overall trend still remains bullish but deep pullback now similar to 2021 ( marked in circle ) .
2. Market might come down to next support 22,500 - 22,600 at breakout point of election result day .
3. Weekly chart shows market respecting swing lows since 2020 . Last swing low is 21,200 . As long as market doesn't break swing low , current trend is bullish .
4. Decent price for long term investment and SIPs
Cheers !
Follow for more market insights ! =)

Nifty key levels for 22.01.2025Nifty key levels for 22.01.2025
If Nifty breaks the upper or lower range, we can expect momentum. The consolidation zone will be favorable for option sellers, while a breakout on either side will benefit option buyers.
Disclaimer:
I'm not a SEBI Registered financial advisor. These views are purely educational in nature. You are solely responsible for any decisions made based on this research.

Nifty Trading Strategy for 22nd January 2025Nifty Trading Strategy
Buy Strategy:
Entry Point:
Condition: Wait for the 15-minute candle to close above 23,280.
Trigger: Buy when the price moves above the high of the 15-minute candle that closed above 23,280.
Targets:
First Target: 23,320
Second Target: 23,360
Third Target: 23,400
Stop-Loss:
Set a stop-loss order below the low of the 15-minute candle that closed above 23,280 to limit potential losses.
Trailing Stop-Loss:
Use a trailing stop-loss to lock in profits as the price moves towards the targets. For example, set a trailing stop of 10 points below the current price.
Profit Booking:
As the price reaches each target, consider booking partial profits to secure gains. For instance, sell a portion of the position at 23,320, another portion at 23,360, and the remaining position at 23,400.
Sell Strategy:
Entry Point:
Condition: Wait for the 15-minute candle to close below 23,970.
Trigger: Sell when the price moves below the low of the 15-minute candle that closed below 23,970.
Targets:
First Target: 23,920
Second Target: 23,870
Third Target: 22,845
Stop-Loss:
Set a stop-loss order above the high of the 15-minute candle that closed below 23,970 to limit potential losses.
Trailing Stop-Loss:
Use a trailing stop-loss to lock in profits as the price moves towards the targets. For example, set a trailing stop of 10 points above the current price.
Profit Booking:
As the price reaches each target, consider booking partial profits to secure gains. For instance, sell a portion of the position at 23,920, another portion at 23,870, and the remaining position at 22,845.
Risk Management:
Position Sizing:
Use proper position sizing to ensure you do not risk more than 1-2% of your trading capital on a single trade. This helps to manage risk and protect your capital.
Diversification:
Avoid putting all your capital into a single trade or asset. Diversify your trades across different assets to minimize risk.
Discipline:
Stick to the trading plan and do not deviate from the strategy. Avoid making impulsive decisions based on emotions.
Disclaimer:
I am not SEBI Registered. This analysis is based on historical data and market trends. Past performance is not indicative of future results. Trading and investment involve risks, and you should conduct your own research or consult with a financial advisor before making any decisions.

NIFTY - Correction. Breakdown two support linesNifty breakdown both green and black color trendline in day time frame. Next strong support zone is 21800 which is marked in orange line.

Bearish Flag Pattern Breakdown in NiftyA Bearish Flag Pattern has been observed in NSE:NIFTY , signalling a potential downward movement. If this breakdown is successful, the following targets can be expected:
First Target: 22,550
Second Target: 22,000
Disclaimer:
This analysis is for educational and informational purposes only. It does not constitute financial advice. Market movements are subject to various factors, and trading involves significant risk. Always conduct your own research or consult with a professional financial advisor before making any investment decisions. NSE:NIFTY

NIFTY - INTRADAY VIEW - 15 mins TimeFrameA broadening wedge pattern has formed, and Nifty has recently tested the upper resistance before retracing toward the lower support line. Today’s session is marked by significant volatility. We can anticipate the price either retesting the upper boundary or continuing to consolidate near the support line throughout the day.

Nifty Hourly Hello,
Nifty Hourly Squeeze RSI oversold and positive divergences near support (demand) zone possibility of reversal and once break 23500 good long for 23800,24000,24300++ oscillators are bullish.

Dow Theory on Nifty50 chartDOW THEORY UPDATE-
After New Dow Bottom "X", now we have made new Dow Top "Y" as well. By seeing market condition, I feel X can be broken soon but if we cross the Dow top "Y" first then that will ends the downside officially.
W is the previous significant swing high here.
X is the current significant swing low here.
Y is the current significant swing high here.

Nifty buy!!!!!!See the charts,
Price is going for 50% RETRACEMENT,so if you want to take a quick trade, look for the fvg to buy.
If you don't want means just wait for price to reach some key areas, to take shorts.
Capital is important so plan wisely, don't lose it with fomo.
Learn to trade by yourself is better.

Nifty key levels for 21.01.2025Nifty key levels for 21.01.2025
If Nifty breaks the upper or lower range, we can expect momentum. The consolidation zone will be favorable for option sellers, while a breakout on either side will benefit option buyers.
Disclaimer:
I'm not a SEBI Registered financial advisor. These views are purely educational in nature. You are solely responsible for any decisions made based on this research.

Nifty Trading Strategy 21st January 2024Nifty Trading Strategy
Buy Strategy:
Entry Point:
Condition: Wait for the 15-minute candle to close above 23,470.
Trigger: Buy when the price moves above the high of the 15-minute candle that closed above 23,470.
Targets: 23,510, 23,565, 23,640
Sell Strategy:
Entry Point:
Condition: Wait for the 15-minute candle to close below 23,170.
Trigger: Sell when the price moves below the low of the 15-minute candle that closed below 23,170.
Targets: 23,121, 23,040,22,990
Risk Management:
Position Sizing:
Use proper position sizing to ensure you do not risk more than 1-2% of your trading capital on a single trade. This helps to manage risk and protect your capital.
Diversification:
Avoid putting all your capital into a single trade or asset. Diversify your trades across different assets to minimize risk.
Discipline:
Stick to the trading plan and do not deviate from the strategy. Avoid making impulsive decisions based on emotions.
Disclaimer:
I am not SEBI Registered. This analysis is based on historical data and market trends. Past performance is not indicative of future results. Trading and investment involve risks, and you should conduct your own research or consult with a financial advisor before making any decisions.

Nifty key levels for 20.01.2025Nifty key levels for 20.01.2025
If Nifty breaks the upper or lower range, we can expect momentum. The consolidation zone will be favorable for option sellers, while a breakout on either side will benefit option buyers.
Disclaimer:
These views are purely educational in nature. You are solely responsible for any decisions made based on this research.

Nifty analysis for 20/01/2025.Major levels
Support :-23130, 23050
Resistance ;- 23280, 23350, 23586
Market is still in a down trend on the major cycle. Bullish trend will only be confirmed once nifty starts trading above 24200 levels.
For now the market is for sell on rise.
Wait for the price action and enter only confirm trades as the volatility in the market is not giving any intraday opportunities to the trades.

Nifty Week AheadNSE:NIFTY is down 11.7% off its High Trading at a PE of 21.4x
Trade Setup:
It can be a Good 1:1 RISK-REWARD Trade. If the Base S1 is Broken it can further correct to Base S2. NSE:NIFTY is now in a downtrend Making Lower Low and Lower High on Daily Charts so there is a higher Probability.
Target(Take Profit):
21700 Levels or 100 WEMA for Positional & Swing Trader.
Stop-Loss:
Weekly Close above 50 WEMA For Swing Trader and 24700 for Positional Trader.
📌Thank you for exploring my idea! I hope you found it valuable.
🙏FLLOW for more
👍BOOST if useful
✍️COMMENT Below your views.
Meanwhile, check out my other stock ideas below until this trade is activated. I would love your feedback.
Disclaimer: This analysis is intended solely for informational and educational purposes and should not be interpreted as financial advice. It is advisable to consult a qualified financial advisor or conduct thorough research before making investment decisions.

NIFTY Intraday Trade Setup For 20 Jan 2025NIFTY Intraday Trade Setup For 20 Jan 2025
Bullish-Above 23320
Invalid-Below 23270
T- 23500+
Bearish-Below 23090
Invalid-Above 23140
T- 23850
NIFTY has closed on a bearish note with almost 1% cut last week. Weekly candle is a doji which can act as a continuation or reversal based on breakout of either high or low. In case low is broken then journey towards 21700 zone as per ABCD will proceed. In case 23400 is reclaimed then there will be a reversal scenario. 23320 and 23090 are Intraday levels for Monday's session.
Coming to Monday's trade setup, if index opens flat and a 15 Min candle closes above 23320 then we will long for the target of 23510. Pullback needed before breakout.
For selling we need a 15 Min candle close below 23090. T- 22850.
In case of a big gap up/down, wait till 10 o'clock and mark the high and low of the trading range (5MIN). Trade on this range breakout.
==========
I am Not SEBI Registered
This is my personal analysis for my personal trading. Kindly consult your financial advisor before taking any actions based on this.

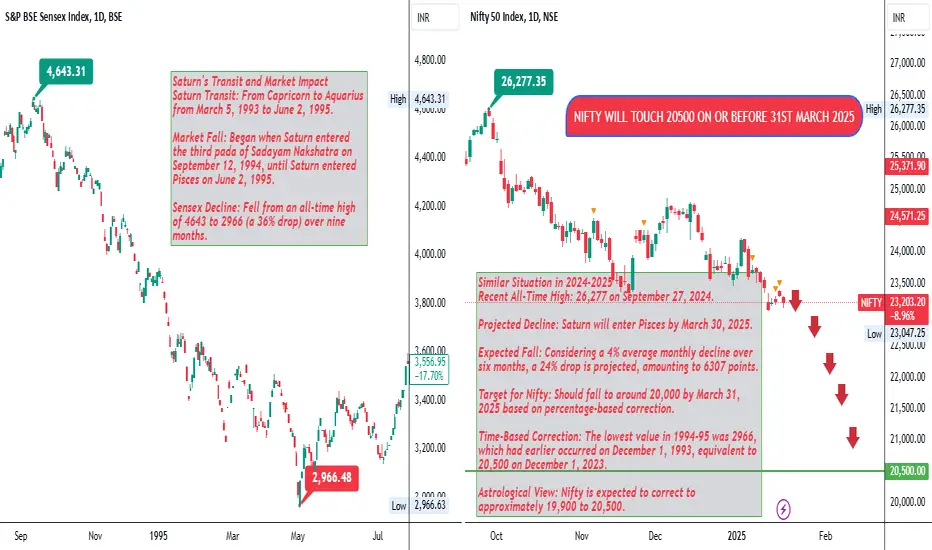
Nifty Astro Technical Analysis from September 2024 to March 2025Saturn's Transit and Market Impact
Saturn Transit: From Capricorn to Aquarius from March 5, 1993 to June 2, 1995.
Market Fall: Began when Saturn entered the third pada of Sadayam Nakshatra on September 12, 1994, until Saturn entered Pisces on June 2, 1995.
Sensex Decline: Fell from an all-time high of 4643 to 2966 (a 36% drop) over nine months.
Similar Situation in 2024-2025
Recent All-Time High: 26,277 on September 27, 2024.
Projected Decline: Saturn will enter Pisces by March 30, 2025.
Expected Fall: Considering a 4% average monthly decline over six months, a 24% drop is projected, amounting to 6307 points.
Target for Nifty: Should fall to around 20,000 by March 31, 2025 based on percentage-based correction.
Time-Based Correction: The lowest value in 1994-95 was 2966, which had earlier occurred on December 1, 1993, equivalent to 20,500 on December 1, 2023.
Astrological View: Nifty is expected to correct to approximately 19,900 to 20,500.
Disclaimer:
I am not Sebi Registered. This analysis is based on historical data, astrological patterns, and market trends. Past performance is not indicative of future results. Trading and investment involve risks, and you should conduct your own research or consult with a financial advisor before making any decisions.
NIFTY 50 technical Analysis for Monday trade setup NIFTY 50 Intraday trade Analysis for Monday trade setup. 23133 and 23050 important support for trend reversal. ↗️ Below 23050 🐻 22800-22750.
If we sustain and cross above 📈 23277 then we may see 23350-23400 easily.

NIFTY MATHEMATICAL LEVELSThese Levels are based on purely mathematical calculations.
Validity of levels are upto expiry of current week.
How to use these levels :-
* Mark these levels on your chart.
* Safe players Can use 15 min Time Frame
* Risky Traders Can use 5 min. Time Frame
* When Candle give Breakout / Breakdown to any level we have to enter with High/Low of that breaking candle.
* Targets will be another level marked on chart
* Stop Loss will be Low/High of that Breaking Candle.
* Trail your SL with every candle.
* Avoid Big Candles as SL will be high then.
* This is one of the Best Risk Reward Setup.
For Educational purpose only

Nifty Trading Strategy for 17th January 2025Nifty Trading Strategy Using 15-Minute Candlestick
Buy Strategy:
Entry Point:
Condition: Wait for the 15-minute candle to close above 23,400.
Trigger: Buy when the price moves above the high of the 15-minute candle that closed above 23,400.
Targets:
First Target: 23,440
Second Target: 23,490
Third Target: 23,525
Stop-Loss:
Set a stop-loss order below the low of the 15-minute candle that closed above 23,400 to limit potential losses.
Trailing Stop-Loss:
Use a trailing stop-loss to lock in profits as the price moves towards the targets. For example, set a trailing stop of 10 points below the current price.
Profit Booking:
As the price reaches each target, consider booking partial profits to secure gains. For instance, sell a portion of the position at 23,440, another portion at 23,490, and the remaining position at 23,525.
Sell Strategy:
Entry Point:
Condition: Wait for the 15-minute candle to close below 23,300.
Trigger: Sell when the price moves below the low of the 15-minute candle that closed below 23,300.
Targets:
First Target: 23,260
Second Target: 23,220
Third Target: 22,175
Stop-Loss:
Set a stop-loss order above the high of the 15-minute candle that closed below 23,300 to limit potential losses.
Trailing Stop-Loss:
Use a trailing stop-loss to lock in profits as the price moves towards the targets. For example, set a trailing stop of 10 points above the current price.
Profit Booking:
As the price reaches each target, consider booking partial profits to secure gains. For instance, sell a portion of the position at 23,260, another portion at 23,220, and the remaining position at 22,175.
Risk Management:
Position Sizing:
Use proper position sizing to ensure you do not risk more than 1-2% of your trading capital on a single trade. This helps to manage risk and protect your capital.
Diversification:
Avoid putting all your capital into a single trade or asset. Diversify your trades across different assets to minimize risk.
Discipline:
Stick to the trading plan and do not deviate from the strategy. Avoid making impulsive decisions based on emotions.
Disclaimer:
I am not SEBI registered. This strategy is based on historical data and technical analysis. Past performance is not indicative of future results. Trading involves risk, and you should only invest money that you can afford to lose. Always conduct your own research or consult with a financial advisor before making any trading decisions.
This detailed strategy provides comprehensive guidelines for trading Nifty with clear entry and exit points, stop-loss orders, trailing stop-losses, and defined targets based on the 15-minute candlestick chart.
