NIFTY : Trading levels and Plan for 17-Nov-2025📊 NIFTY TRADING PLAN — 17 NOV 2025
(Timeframe Reference: 15-Min Chart)
Chart Summary:
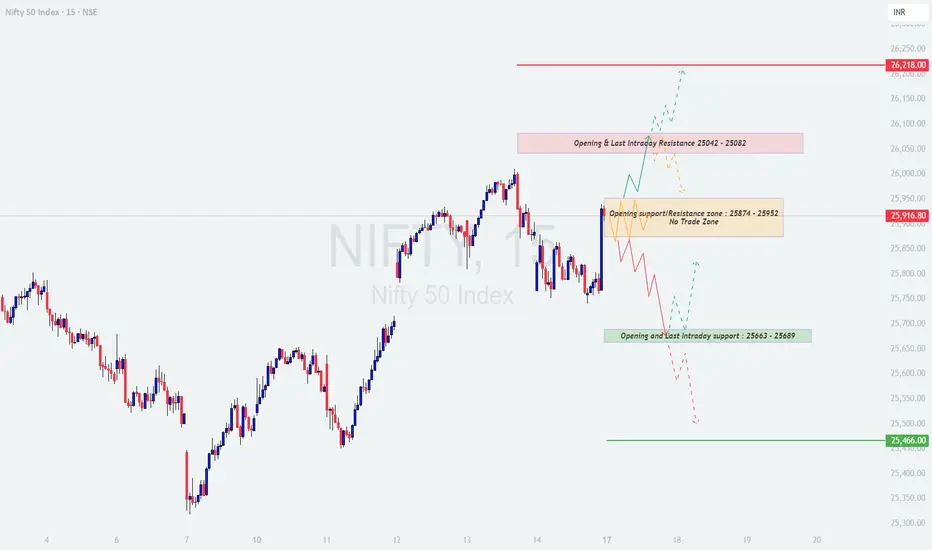
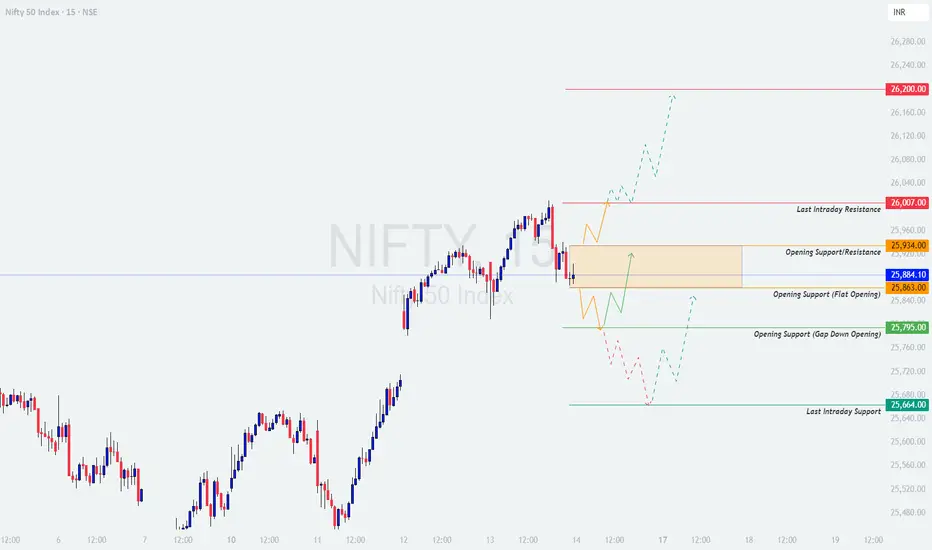
Nifty closed around 25,916 , maintaining a balanced but cautious structure ahead of the new trading week. The index currently trades near the Opening Support / Resistance Zone (25,874 – 25,952) , which is a key “no-trade” area as highlighted on the chart.
Immediate resistance lies at 26,042 – 26,082 (Opening & Last Intraday Resistance Zone) , while strong support exists near 25,663 – 25,689 (Opening & Last Intraday Support Zone) .
The index currently shows a neutral-to-slightly bullish undertone as long as price sustains above 25,874 . A breakout above 25,952 can trigger an upmove toward 26,082 – 26,218 , while a breakdown below 25,874 may lead to short-term weakness toward 25,680 – 25,466 .
Key Zones to Watch:
🟩 Support Levels: 25,689 / 25,466
🟥 Resistance Levels: 25,952 / 26,082 / 26,218
⚖️ No Trade Zone: 25,874 – 25,952 (avoid trading until breakout confirmation)
---
🟢 Scenario 1: GAP-UP Opening (100+ Points)
If Nifty opens around or above 26,020 – 26,050 , it will directly test the Last Intraday Resistance Zone (26,042 – 26,082) . A strong gap-up near resistance often attracts early profit booking or sideways consolidation before directional clarity emerges.
If the price sustains above 26,082 with a strong bullish candle and volume confirmation, upside targets open toward 26,180 – 26,218 .
If price faces rejection at 26,082 (long upper wicks or doji patterns), expect a pullback toward 25,952 – 25,874 .
Traders should avoid buying calls immediately after a gap-up; instead, wait for a retest of the 26,042 zone for better confirmation.
Sustained momentum beyond 26,100 will confirm strength and can lead to intraday trend continuation.
💡 Educational Note:
Gap-ups near major resistance zones often trap impulsive traders. The best approach is to let the market test and confirm whether the breakout is genuine or just a liquidity trap. Watch for rising volume with closing candles above the breakout level for confirmation.
---
🟧 Scenario 2: FLAT Opening (Around 25,880 – 25,920 Zone)
A flat opening within the No Trade Zone (25,874 – 25,952) indicates indecision. The price may spend the first 15–30 minutes moving sideways as buyers and sellers battle for control.
Avoid trading inside this range — it’s a “neutral zone” with no clear edge.
If price breaks and sustains above 25,952 , bullish continuation can take Nifty toward 26,082 – 26,218 .
If price breaks below 25,874 , weakness may extend toward 25,689 – 25,466 .
Wait for a strong 15-min candle close beyond the range for confirmation — don’t pre-empt the breakout.
🧠 Educational Tip:
Flat openings near key levels require patience. Most false breakouts occur when traders enter without confirmation. Wait for candle structure and volume validation before committing. Strong moves often follow after consolidations — let the direction emerge naturally.
---
🔴 Scenario 3: GAP-DOWN Opening (100+ Points)
If Nifty opens around 25,700 – 25,750 , it will directly test the Opening & Last Intraday Support Zone (25,663 – 25,689) . This zone will be critical for bulls to defend — a breakdown below could open room for deeper correction.
If reversal patterns (hammer, bullish engulfing) appear around 25,680 , expect a bounce toward 25,874 – 25,952 .
If the price fails to hold 25,663 , next support lies near 25,466 — which can act as a short-term target zone for sellers.
Avoid chasing short trades at the open; instead, wait for a pullback toward 25,850 – 25,880 to initiate low-risk entries.
Volume divergence (falling volume with declining price) near support is often a sign of selling exhaustion — watch closely for reversals.
📘 Educational Insight:
Gap-down openings are often ruled by emotions — panic selling and fear dominate. Experienced traders look for structure, not emotion. Reversal signals near major supports usually offer high reward-to-risk setups once panic subsides.
---
💼 RISK MANAGEMENT TIPS FOR OPTIONS TRADERS:
Avoid entering trades in the first 15 minutes of market open — IV spikes and volatility whipsaws can distort option prices.
Use only 1–2% of total trading capital per position. Focus on longevity, not short-term aggression.
Prefer ATM or slightly ITM options for better delta exposure and lower time decay impact.
Always set a stop-loss — trail it once the trade moves 30–40 points in your favor.
Book partial profits at nearby supports/resistances — protect gains and avoid greed traps.
Do not average losing positions; instead, accept small losses and preserve capital for better setups.
⚠️ Golden Rule: Avoid overtrading in choppy or low-volume conditions — professional traders focus on quality, not quantity.
---
📈 SUMMARY:
🟧 No Trade Zone: 25,874 – 25,952
🟥 Resistance Zones: 26,082 / 26,218
🟩 Support Zones: 25,689 / 25,466
⚖️ Bias: Bullish above 25,952 | Bearish below 25,874
---
📚 CONCLUSION:
Nifty remains at a decisive inflection point near 25,900 . The day’s directional tone will depend on how price reacts around the No Trade Zone (25,874 – 25,952) . Sustained breakout above 25,952 could trigger a move toward 26,218 , whereas a breakdown below 25,874 may pull the index toward 25,680 – 25,466 .
For intraday traders, patience will be the most valuable skill on 17 Nov. Let price confirm before execution — impulsive entries near range zones often lead to losses.
📊 Remember: Markets reward patience and discipline — clarity always follows confirmation.
---
⚠️ DISCLAIMER:
I am not a SEBI-registered analyst . The analysis shared here is purely for educational and informational purposes . Please do your own research or consult a certified financial advisor before making any trading or investment decisions.
Niftyprediction
Cup & Handle Breakout Opportunity in Reliance IndustriesReliance Industries, currently trading near ₹1518 on the weekly charts, is showing signs of a cup & handle breakout at the top of a consolidation zone. This pattern, combined with strong Relative Strength Index (RSI) readings across multiple timeframes, highlights a potential bullish opportunity.
🔍 What is a Cup & Handle Pattern?
Cup Formation:
Price declines, then gradually recovers, forming a rounded bottom resembling a “cup.”
Handle Formation:
A short consolidation or pullback after the cup, forming the “handle.”
Breakout Point:
When price breaks above the handle’s resistance, it signals continuation of the uptrend.
Reliance Industries Case:
Cup & handle is forming/completing at the top of consolidation.
Price is now ready to break out of the handle’s endpoint, suggesting bullish momentum.
📊 RSI Confirmation
The Relative Strength Index (RSI) is a momentum indicator that measures strength of price movements.
Key Levels:
Above 50 → Indicates bullish momentum.
Moving toward 70 → Signals strong upside strength.
Reliance Industries RSI:
Daily RSI trending above 50 and preparing to cross 70.
Monthly, weekly, and daily RSI all above 50, showing broad-based momentum.
This alignment across timeframes adds conviction to the breakout.
🎯 Learning Points for Traders
Pattern Recognition:
Cup & handle is a continuation pattern often seen before strong rallies.
Breakout above the handle confirms bullish intent.
Multi-Timeframe Analysis:
RSI above 50 across monthly, weekly, and daily charts strengthens the setup.
Multiple timeframe confirmation reduces false signals.
Momentum + Pattern Combination:
Chart patterns show structure, RSI confirms strength.
Together, they create a high-probability trading opportunity.
Risk Management:
Stop-loss can be placed below the handle’s low.
Avoid entering before breakout confirmation.
📝 Conclusion
Reliance Industries’ cup & handle breakout, supported by RSI strength across all timeframes, is a textbook example of how price patterns and momentum indicators work together. For learners, this case highlights the importance of combining technical structures with RSI confirmation to identify reliable breakout opportunities.

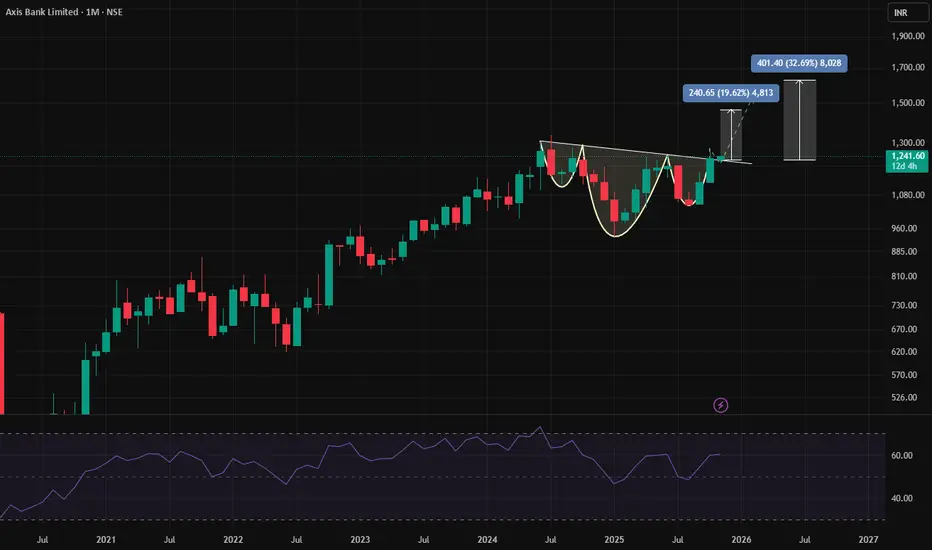
Understanding the Inverse Head & Shoulder Breakout in Axis BankEducational Article: Understanding the Inverse Head & Shoulder Breakout in Axis Bank.
Axis Bank, currently trading around ₹1241 on the monthly charts, is showing a classic inverse head & shoulder breakout at the top of a consolidation zone. This setup, combined with the Relative Strength Index (RSI) trending above 50 and preparing to cross 60, provides a strong technical case for potential upside momentum.
🔍What is an Inverse Head & Shoulder Pattern?
Structure:
Left Shoulder: Initial decline followed by a rebound.
Head: A deeper decline forming the lowest point.
Right Shoulder: A smaller decline, mirroring the left shoulder.
Neckline: The resistance line connecting the peaks of the shoulders.
Breakout Signal: When price breaks above the neckline, it indicates a reversal from bearish to bullish sentiment.
In Axis Bank’s Case:
The pattern has formed after a consolidation phase.
Price is now breaking out of the neckline, suggesting strength and potential continuation upward.
📊 Role of RSI in Confirming Breakouts
The Relative Strength Index (RSI) is a momentum oscillator that measures the speed and change of price movements.
Key Levels:
Above 50 → Indicates bullish momentum.
Crossing 60 → Adds further strength to the uptrend.
Axis Bank’s RSI:
Currently trending above 50.
Preparing to move above 60, which aligns with the breakout, reinforcing the bullish case.
🎯 Learning Points for Traders
Pattern Recognition:
Spotting inverse head & shoulder patterns helps identify potential reversals.
Always confirm with a breakout above the neckline.
Momentum Confirmation:
RSI above 50 signals strength.
A move above 60 during breakout adds conviction to the trade.
Consolidation Context:
Breakouts from consolidation zones often lead to strong directional moves.
Axis Bank’s breakout is happening after a prolonged consolidation, increasing reliability.
Risk Management:
Place stop-loss below the right shoulder or neckline to manage risk.
Avoid chasing the move without confirmation.
📝 Conclusion
The inverse head & shoulder breakout in Axis Bank, supported by RSI strength, presents a textbook example of how price action and momentum indicators work together. For learners, this is a valuable case study in combining chart patterns with RSI confirmation to identify high-probability trading opportunities.
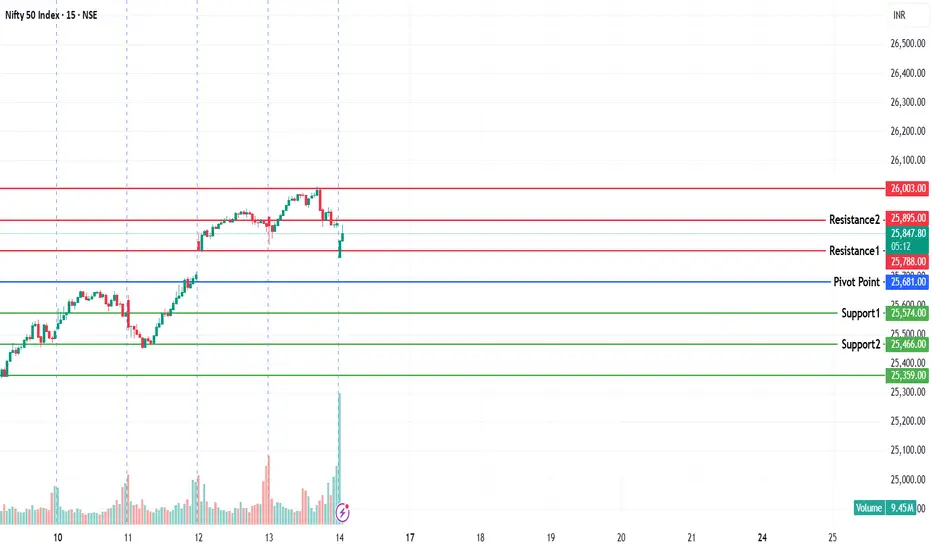
NIFTY KEY LEVELS FOR 14.11.2025NIFTY KEY LEVELS FOR 14.11.2025
Timeframe: 3 Minutes
If the candle stays above the pivot point, it is considered a bullish bias; if it remains below, it indicates a bearish bias. Price may reverse near Resistance 1 or Support 1. If it moves further, the next potential reversal zone is near Resistance 2 or Support 2. If these levels are also broken, we can expect the trend.
When a support or resistance level is broken, it often reverses its role; a broken resistance becomes the new support, and a broken support becomes the new resistance.
If the range(R2-S2) is narrow, the market may become volatile or trend strongly. If the range is wide, the market is more likely to remain sideways
please like and share my idea if you find it helpful
📢 Disclaimer
I am not a SEBI-registered financial adviser.
The information, views, and ideas shared here are purely for educational and informational purposes only. They are not intended as investment advice or a recommendation to buy, sell, or hold any financial instruments.
Please consult with your SEBI-registered financial advisor before making any trading or investment decisions.
Trading and investing in the stock market involves risk, and you should do your own research and analysis. You are solely responsible for any decisions made based on this research.
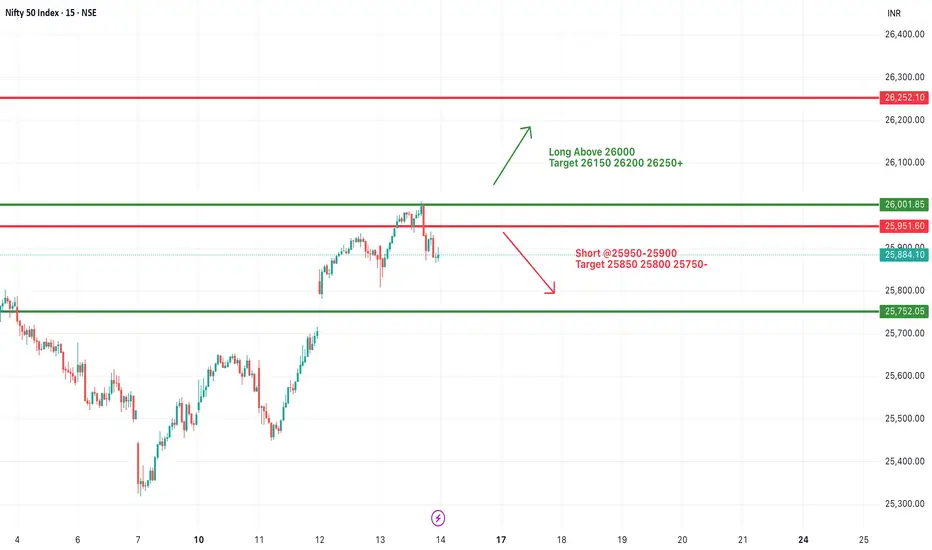
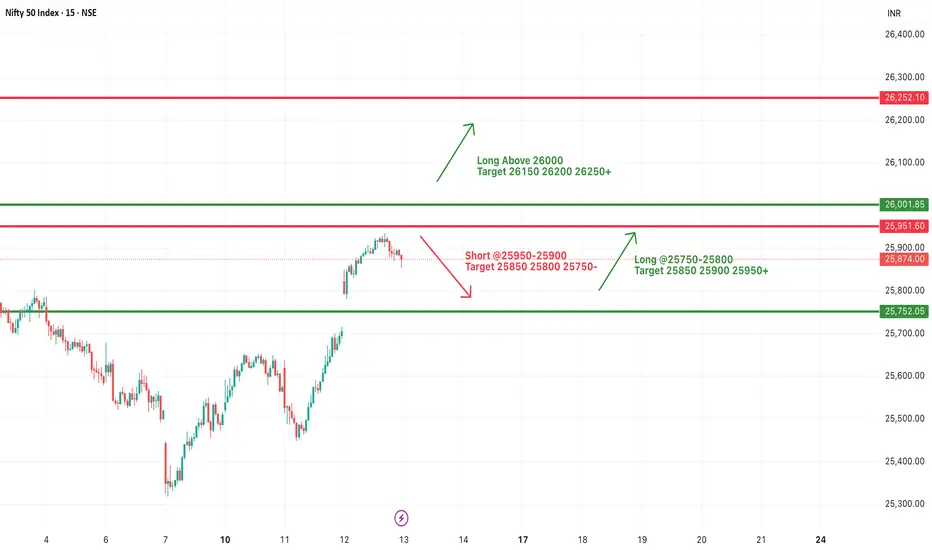
#NIFTY Intraday Support and Resistance Levels - 14/11/2025Nifty is expected to open flat near the 25,880–25,900 zone, keeping price action inside the same tight range as yesterday. The index is currently trading near an important resistance cluster, so early candles may remain choppy and sideways until a clear directional move develops.
If Nifty sustains above 26,000, upside strength can continue toward 26,150, 26,200, and 26,250+. A breakout above 26,000 will act as the primary confirmation for long positions, indicating fresh buyer momentum.
On the downside, if the index slips below 25,950–25,900, a short setup may get activated toward 25,850, 25,800, and 25,750-. This zone has acted as support earlier, so a breakdown may lead to a quick intraday slide.
Overall, with a flat opening and no gap advantage for either side, Nifty remains in a reaction zone. Traders should wait for a decisive move above 26,000 or below 25,900 to catch a clean trend. Use strict SL as volatility may rise around resistance levels.
NIFTY : Trading levels and Plan for 14-Nov-2025📊 NIFTY TRADING PLAN — 14 NOV 2025
(Timeframe Reference: 15-Min Chart)
Chart Summary:
Nifty closed near 25,884 , forming a balanced structure after recent upside momentum. The index is currently positioned within the Opening Support / Resistance Zone (25,863 – 25,934) , suggesting indecision as participants await directional clarity.
Above this range, key resistance levels lie at 26,007 (Last Intraday Resistance) and 26,200 . On the downside, supports exist near 25,795 (Gap-down Support) and 25,664 (Last Intraday Support) .
The index remains in a neutral-to-bullish bias as long as it holds above 25,795 . Sustaining above 25,934 may trigger renewed upward movement toward 26,200.
Key Levels to Watch:
🟩 Supports: 25,795 / 25,664
🟥 Resistances: 25,934 / 26,007 / 26,200
⚖️ Bias Zone: 25,863 – 25,934 (No-Trade Zone – Wait for breakout confirmation)
🟢 Scenario 1: GAP-UP Opening (100+ Points)
If Nifty opens above 26,000 – 26,050 , it will open directly near or above the Last Intraday Resistance (26,007) . Such a gap-up could trigger excitement at the open, but traders must wait for confirmation of strength.
If price sustains above 26,007 for 15–20 minutes with strong bullish candles, the next upside targets could be 26,120 – 26,200 .
If price fails to sustain above 26,007 and forms rejection wicks, expect a pullback toward 25,934 – 25,884 .
Avoid chasing a gap-up immediately — wait for a retest near 26,000 for better entry confirmation.
If price reclaims 26,000 after a pullback with rising volume, it could confirm continuation momentum.
💡 Educational Note:
Gap-ups near resistance zones often create emotional entry traps. Always let the price establish strength through retests and volume confirmation. A breakout sustained by strong candles signals genuine trend continuation, while sharp reversals at resistance suggest false breakouts.
🟧 Scenario 2: FLAT Opening (Around 25,860 – 25,900 Zone)
A flat opening near the Opening Support / Resistance Zone (25,863 – 25,934) indicates early indecision. Price may spend time consolidating before choosing direction.
Avoid entering within this zone in the first 15 minutes — volatility may remain erratic.
If Nifty sustains above 25,934 with strong green candles, upside targets open toward 26,007 – 26,200 .
If it breaks below 25,863 , weakness may push the index toward 25,795 – 25,664 .
Trade breakout confirmation only — fakeouts are common in flat openings. Wait for candle closure and volume support.
🧠 Educational Tip:
Flat openings test trader discipline. Most false breakouts occur when traders predict rather than wait. Breakouts that occur after a consolidation period with strong volume tend to have better follow-through. The key is patience and confirmation, not prediction.
🔴 Scenario 3: GAP-DOWN Opening (100+ Points)
If Nifty opens near 25,770 – 25,800 , it will enter the Opening Support Zone . This area will be critical for bulls to defend.
If price forms reversal candles (hammer, bullish engulfing) near 25,795 , expect a rebound toward 25,863 – 25,934 .
If the index fails to hold above 25,795 , further weakness could extend toward 25,664 (Last Intraday Support) .
Avoid panic shorting after a large gap-down — instead, wait for pullbacks toward 25,860 – 25,880 for better entry risk-reward.
Watch for volume behavior — decreasing volume near support often indicates exhaustion, hinting at a short-covering rally.
📘 Educational Insight:
Gap-downs attract panic sellers early in the session. Experienced traders wait for signs of stabilization at support levels. Sharp reversals with strong volume often mark the beginning of intraday recoveries. Patience pays more than impulse in such setups.
💼 RISK MANAGEMENT TIPS FOR OPTIONS TRADERS:
Avoid option entries during the first 15–20 minutes — IV (Implied Volatility) spikes inflate premium values, leading to quick time decay afterward.
Limit exposure to 1–2% of total capital per trade . Consistency in risk control is key to longevity.
Prefer ATM or ITM options for directional plays; avoid deep OTM options unless trading clear breakout momentum.
Always use stop-losses — trail them once the position moves 30–40 points in your favor.
Book partial profits at strong support/resistance zones to lock in gains.
If the day turns choppy or non-trending, step back — capital preservation > forced trading.
📈 SUMMARY:
🟧 Neutral Zone: 25,863 – 25,934
🟥 Resistance Zones: 26,007 / 26,200
🟩 Support Zones: 25,795 / 25,664
⚖️ Bias: Bullish above 25,934 | Bearish below 25,863
📚 CONCLUSION:
Nifty is at a decisive point, trading within a narrow consolidation zone between 25,863 – 25,934 . A breakout above this zone could drive momentum toward 26,200 , while a breakdown below 25,863 could lead to a retest of 25,795 – 25,664 .
Patience and observation will be the most valuable tools for traders on 14 Nov. Let price confirm direction with volume support before executing trades. Avoid emotional entries — precision and timing matter more than frequency.
📊 In trading, waiting for confirmation isn’t missing out — it’s aligning with probability and discipline.
⚠️ DISCLAIMER:
I am not a SEBI-registered analyst . The above analysis and levels are shared purely for educational and informational purposes . Please conduct your own research or consult a certified financial advisor before making trading or investment decisions.
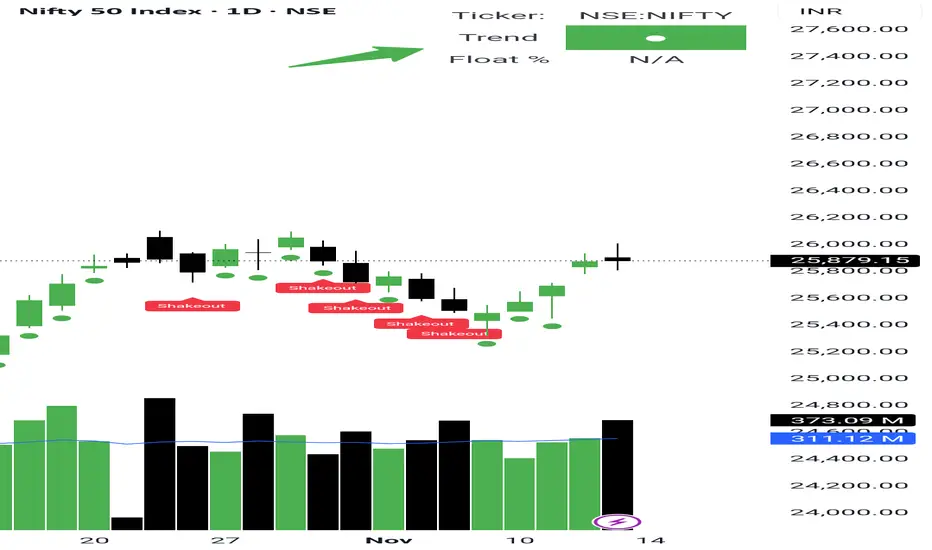
Nifty’s Shakeout Sets the Stage for a Bullish Run Yesterday’s sellers’ data played out perfectly today — after touching 26000, NSE:NIFTY closed below the day’s open. A classic shakeout.
Pivot has now climbed to 25899 despite a red candle, which clearly shows long buildup is still happening.
The plan is simple — go long on a dip, or go long above 25909 with a target of 26200.
But if 25834 breaks, then 25700 becomes the next support zone to accumulate fresh longs again.
Now here’s the interesting part — even with today’s low close and higher sellers’ volume, Nifty’s health has turned Green (top-right corner on the chart).
This is a very strong signal for the coming weeks.
Trend has clearly turned positive. Bulls are getting ready to roar.
As mentioned yesterday, pharma stocks continue to build strength for short term opportunities.
📊 Levels at a glance:
Pivot: 25899
Long above: 25909
Support: 25834 / 25700 (buy zone)
Upside target: 26200
Market Health: Green
Bias: Bullish with shakeout confirmation
Sector to watch: NSE:CNXPHARMA
Tomorrow Gap UP or Huge Gap DOWN market - UP (30%) or DOWN (70%)Sir/Mam,
Tomorrow mostly market will be gap up to manipulate the seller's or Huge Gap down to manipulate buyers. Whichever side opens it will react opposite way of Direction. For e.g. if it opens by 26000 or above - then buy 26150 CE and 26000 PE, book profit for the one side momentum same for gap down, if its open at 25750 buy 25850 CE and 25700 PE, book profit for the one side momentum.
If the market opens flat, then wait till expiry day, because premium will decay from both sides.
Hope you enjoyed today.
Let's blast for tomorrow.

NIFTY KEY LEVELS FOR 13.11.2025NIFTY KEY LEVELS FOR 13.11.2025
Timeframe: 3 Minutes
If the candle stays above the pivot point, it is considered a bullish bias; if it remains below, it indicates a bearish bias. Price may reverse near Resistance 1 or Support 1. If it moves further, the next potential reversal zone is near Resistance 2 or Support 2. If these levels are also broken, we can expect the trend.
When a support or resistance level is broken, it often reverses its role; a broken resistance becomes the new support, and a broken support becomes the new resistance.
If the range(R2-S2) is narrow, the market may become volatile or trend strongly. If the range is wide, the market is more likely to remain sideways
please like and share my idea if you find it helpful
📢 Disclaimer
I am not a SEBI-registered financial adviser.
The information, views, and ideas shared here are purely for educational and informational purposes only. They are not intended as investment advice or a recommendation to buy, sell, or hold any financial instruments.
Please consult with your SEBI-registered financial advisor before making any trading or investment decisions.
Trading and investing in the stock market involves risk, and you should do your own research and analysis. You are solely responsible for any decisions made based on this research.

#NIFTY Intraday Support and Resistance Levels - 13/11/2025Nifty is likely to open with a gap up near the 25,950 zone, placing the index exactly at the important resistance area highlighted earlier. Price is opening directly inside the supply region, so the first few minutes may remain volatile.
Sustaining above 25,950–26,000 will strengthen the momentum on the upside, and once Nifty holds above this zone, it can move toward 25,850, 25,900 and 25,950+ levels. On the other hand, if the index fails to sustain above this region and shows rejection from the opening zone, then a short opportunity may activate below 25,950–25,900, with downside targets toward 25,850, 25,800 and 25,750-.
Overall, the index is opening at an important level, and a clear direction will come only after sustaining above or below the marked zones. Use proper levels and wait for confirmation.
NIFTY : Trading levels and Plan for 13-Nov-2025📊 NIFTY TRADING PLAN — 13 NOV 2025
(Timeframe Reference: 15-Min Chart)
Chart Summary:
Nifty closed near 25,874 , positioned within a tight No-Trade Zone (25,863 – 25,935) , reflecting indecision and a short-term pause after a strong rally. The index is facing an immediate Opening Resistance Zone near 26,004 , while its Opening Support Zone lies at 25,745 – 25,765 .
The price structure suggests that momentum players are waiting for confirmation — either a breakout above 25,935 to push toward 26,193, or a breakdown below 25,745 to retest lower supports. Volatility could remain high due to positional adjustments ahead of the weekend.
Key Levels to Watch:
🟩 Supports: 25,765 / 25,745 / 25,664
🟥 Resistances: 25,935 / 26,004 / 26,193
⚖️ Bias Zone: Between 25,863 – 25,935 (No-Trade Zone)
🟢 Scenario 1: GAP-UP Opening (100+ Points)
If Nifty opens above 25,950 – 26,000 , it will directly enter the Opening Resistance Zone . Bulls must sustain the gap for continuation toward higher levels.
If price sustains above 26,004 with strong bullish candles and increasing volume, a move toward 26,120 – 26,193 is likely.
However, if the index opens higher but fails to hold above 26,004 , a pullback toward 25,935 – 25,874 may occur.
Ideal plan: Wait for the first 15–30 minutes to confirm whether buyers can sustain above 26,004 . Enter long positions only after a successful retest with proper confirmation.
If rejection appears near 26,120 – 26,193 , partial profit booking or trailing stops is advised.
💡 Educational Note:
Gap-ups near resistance often trap early buyers. Strong conviction comes not from the open itself but from whether the price holds above breakout levels after initial volatility. Let price show you control — strength confirmed through retest and volume is far more reliable than the first impulse.
🟧 Scenario 2: FLAT Opening (Within 25,863 – 25,935 Zone)
A flat opening inside the No-Trade Zone suggests early choppiness. Traders should avoid getting caught in this indecision range until a clear breakout occurs.
Avoid taking trades inside 25,863 – 25,935 as whipsaws are common.
If the index breaks and sustains above 25,935 , upside targets open toward 26,004 – 26,193 .
If price breaks below 25,863 , it could trigger weakness toward 25,765 – 25,745 .
Focus on the breakout candle — confirmation with strong body and volume gives confidence in the move’s sustainability.
🧠 Educational Tip:
Flat openings require traders to be patient and disciplined. Most false signals occur when traders predict rather than react. Waiting for the range to break provides a statistical edge — successful trades come from confirmation, not anticipation.
🔴 Scenario 3: GAP-DOWN Opening (100+ Points)
If Nifty opens below 25,770 – 25,740 , it will test the Opening Support Zone . This area will decide whether bulls defend the recent uptrend or allow bears to take over.
If a reversal pattern forms near 25,745 – 25,765 (hammer or bullish engulfing), expect a short-covering rally back toward 25,874 – 25,935 .
If price breaks and sustains below 25,745 , weakness may extend toward 25,664 and possibly 25,502 .
Avoid shorting immediately after a deep gap-down — wait for a retracement toward 25,745 – 25,800 for better risk-reward.
Volume near support zones will indicate whether selling is continuing or exhausting. Falling volume often hints at reversal setups.
📘 Educational Insight:
Gap-downs tend to amplify emotional trading. Many participants panic-sell into support zones, providing opportunities for disciplined traders who wait for reversals. The key is to let the first few candles reveal intent — a steady base near support usually signals potential bounce setups.
💼 RISK MANAGEMENT TIPS FOR OPTIONS TRADERS:
Avoid trading options in the first 15–20 minutes — high Implied Volatility (IV) inflates premiums and causes quick time decay as the market stabilizes.
Define your risk before entry — limit exposure to 1–2% of total capital per trade.
Prefer ITM or ATM options for directional plays; avoid far OTM options unless volatility breakout is confirmed.
Use stop-loss orders and trail them as positions move in your favor by 30–40 points to protect profits.
Avoid overtrading after multiple stop-outs — conserving capital is more important than chasing missed moves.
Always book partial profits at major resistance/support levels to lock in gains.
📈 SUMMARY:
🟧 No-Trade Zone: 25,863 – 25,935
🟥 Resistance Zones: 26,004 / 26,193
🟩 Support Zones: 25,765 / 25,745 / 25,664
⚖️ Bias: Neutral-to-Bullish above 25,935 | Weakness below 25,863
📚 CONCLUSION:
Nifty sits at a key decision point — 25,863 – 25,935 defines the immediate battleground. A breakout above 25,935 could fuel a bullish continuation toward 26,193 , while a drop below 25,863 may invite selling pressure toward 25,745 – 25,664 .
Patience is essential — avoid early entries within the no-trade zone and trade only when confirmation aligns with volume strength. Trade the trend, not the noise.
📊 Remember: Markets reward clarity and discipline — every avoided bad trade is a hidden profit.
⚠️ DISCLAIMER:
I am not a SEBI-registered analyst . The above analysis and levels are shared purely for educational purposes . Please conduct your own research or consult a certified financial advisor before making any trading or investment decisions.

NIFTY : TRADING LEVELS AND PLAN FOR 12-NOV-2025📊 NIFTY TRADING PLAN — 12 NOV 2025
(Timeframe Reference: 15-Min Chart)
Chart Summary:
Nifty closed near 25,705 , just above its key Opening Support / Resistance Zone (25,666 – 25,705) . The index recently bounced strongly from lower supports, but now faces an overhead supply zone near 25,800 – 25,935 , which coincides with the Last Resistance Zone .
The structure suggests short-term bullish momentum, though a profit-booking phase is possible near resistance levels. The immediate bias remains mildly positive as long as Nifty sustains above 25,617 .
Key Levels to Watch:
🟩 Support Zones: 25,705 / 25,617 / 25,502
🟥 Resistance Zones: 25,800 / 25,863 – 25,935
⚖️ Bias Zone: Between 25,666 – 25,705
🟢 Scenario 1: GAP-UP Opening (100+ Points)
If Nifty opens above 25,800 , it will enter the upper resistance zone, making it crucial to observe whether bulls can sustain the breakout or not.
If price sustains above 25,800 with strong bullish candles and rising volume, it may target 25,863 – 25,935 . Sustained strength beyond 25,935 could trigger momentum buying and further continuation.
However, if the index opens higher but fails to sustain above 25,800 , expect a quick pullback toward 25,705 – 25,666 .
Avoid chasing the gap-up opening blindly; instead, wait for a retest of 25,800 as support to confirm breakout validity.
If rejection candles appear near 25,863 – 25,935 , short-term profit booking may emerge. Conservative traders can book partial profits there.
💡 Educational Note:
Gap-ups are often emotional moves driven by overnight sentiment. The key is to differentiate between strength and exhaustion. A gap-up followed by strong volume confirmation indicates genuine buying, while thin volume and upper wicks suggest weakness. Let the first few candles reveal intent before acting.
🟧 Scenario 2: FLAT Opening (Within 25,666 – 25,705 Zone)
A flat opening near this zone indicates early consolidation. Both buyers and sellers may attempt to establish control, creating short-lived volatility.
Avoid entering trades immediately within 25,666 – 25,705 as it’s a “neutral zone.”
If price breaks and sustains above 25,705 , momentum may build toward 25,800 and later 25,863 .
If price slips below 25,666 , weakness could extend toward 25,617 – 25,502 .
Traders should watch for volume surges and candle confirmations before breakout entries — low-volume moves tend to reverse quickly.
🧠 Educational Tip:
Flat openings are ideal for breakout traders who wait patiently. Most false moves occur when traders anticipate direction without waiting for confirmation. Patience during the first 30 minutes helps avoid traps and enables trades aligned with actual market momentum.
🔴 Scenario 3: GAP-DOWN Opening (100+ Points)
If Nifty opens near or below 25,600 , it will test the strength of the Last Intraday Support (25,502 – 25,617) . This area is crucial for bulls to defend.
If a reversal pattern forms near 25,502 – 25,550 (hammer, bullish engulfing, or double bottom), it could trigger a rebound toward 25,666 – 25,705 .
However, if price breaks and sustains below 25,502 with high volume, the next support lies around 25,400 – 25,360 .
Avoid shorting aggressively after a deep gap-down — wait for a pullback toward resistance for better entries and risk-reward ratios.
Watch volume near supports; declining volume during a fall suggests seller exhaustion, often leading to intraday reversals.
📘 Educational Insight:
Gap-downs are emotionally charged opens that often test trader psychology. Smart traders avoid reacting impulsively and instead focus on structure. If sellers fail to maintain control below strong support zones, a short-covering rally can provide sharp intraday opportunities.
💼 RISK MANAGEMENT TIPS FOR OPTIONS TRADERS:
Avoid buying options during the first 15 minutes — inflated IV (Implied Volatility) can decay quickly as the market stabilizes.
Always set a predefined stop-loss; never risk more than 1–2% of your total capital on any trade.
Prefer ITM options for directional conviction and avoid far OTM strikes on range-bound days.
Trail stop-losses after gaining 30–40 points in favor to lock profits and manage emotions.
On volatile sessions, consider partial exits to secure gains — remember, consistency matters more than perfection.
Avoid averaging down losing trades — protect capital first; opportunities will always reappear.
📈 SUMMARY:
🟧 Key Zone: 25,666 – 25,705
🟥 Resistance Levels: 25,800 / 25,863 – 25,935
🟩 Support Levels: 25,617 / 25,502
⚖️ Bias: Neutral-to-Bullish above 25,705 | Weakness below 25,666
📚 CONCLUSION:
Nifty is at a pivotal turning zone — the 25,666 – 25,705 range will dictate tomorrow’s intraday tone. A breakout above 25,705 could fuel momentum toward 25,800 – 25,935 , while a fall below 25,666 could invite a retest of 25,617 – 25,502 .
The best approach is to let the first few candles reveal intent before taking directional trades. Stay alert, respect levels, and trade based on structure rather than emotion.
📊 In trading, patience is your strongest edge — clarity follows discipline, not prediction.
⚠️ DISCLAIMER:
I am not a SEBI-registered analyst . The analysis and views shared here are purely for educational purposes . Please do your own research or consult a certified financial advisor before making any trading or investment decisions.

Nifty Breaks Resistance — But Watch the Volume Trap So as mentioned yesterday, “move will be sharp” — and it was! Nifty rose over 180 points and closed above a key resistance at 25850.
With that, the Pivot has also shifted up to 25863, confirming a long buildup in the index.
However, even with today’s green close, sellers’ volume was higher by 21 million — something worth paying attention to.
That pressure could reflect in tomorrow’s first half. If Nifty breaks below 25834, we might see a test of 25700 — a strong support zone and a great area to accumulate fresh longs again.
Traders should remember — this is not a shorting opportunity. The right approach will be to look for long entries near the mentioned support.
It would actually be ideal if we open with a small gap down tomorrow.
With the Pivot Percentile at just 0.2%, the move after support testing could be sharp.
#BankNifty shows a similar pattern, so keep eyes there as well.
Meanwhile, the #Pharma sector is quietly building momentum. #WOCKPHARMA looks particularly good — I’ve added it to my list today and will keep monitoring closely.
📊Levels at a glance:
Pivot: 25863
Support: 25834 / 25700 (buy zone)
Resistance: 25980
Pivot Percentile: 0.2% (sharp move expected)
Bias: Bullish with short-term pullback possible
Sectors to watch: Pharma (#WOCKPHARMA), Banking
That’s all for the day. Take care and have a profitable tomorrow.

NIFTY KEY LEVELS FOR 12.11.2025NIFTY KEY LEVELS FOR 12.11.2025
Timeframe: 3 Minutes
If the candle stays above the pivot point, it is considered a bullish bias; if it remains below, it indicates a bearish bias. Price may reverse near Resistance 1 or Support 1. If it moves further, the next potential reversal zone is near Resistance 2 or Support 2. If these levels are also broken, we can expect the trend.
When a support or resistance level is broken, it often reverses its role; a broken resistance becomes the new support, and a broken support becomes the new resistance.
If the range(R2-S2) is narrow, the market may become volatile or trend strongly. If the range is wide, the market is more likely to remain sideways
please like and share my idea if you find it helpful
📢 Disclaimer
I am not a SEBI-registered financial adviser.
The information, views, and ideas shared here are purely for educational and informational purposes only. They are not intended as investment advice or a recommendation to buy, sell, or hold any financial instruments.
Please consult with your SEBI-registered financial advisor before making any trading or investment decisions.
Trading and investing in the stock market involves risk, and you should do your own research and analysis. You are solely responsible for any decisions made based on this research.

Nifty50 analysis today(12/11/2025)
CPR: wide+ascending cpr: consolidation.
FII: -803.22sold.
DII: 2,188.47 bought.
Highest OI: too soon to say levels, because yesterday only expiry.
Resistance:
Support :
Possibilities:
1hour timeframe.
1.Today is wide candle there is high chance of consolidation.
2.if and only it takes support at any cpr levels , can move up.
Events.
1.Bihar elections result on Friday.
conclusion:
My pov: market is bullish but the cpr is wide . i will just watch the market.
note:
8moving average ling is blue colour.
20moving average line is green colour
50moving average line is red colour.
200moving average line is black colour.
cpr is for trend analysis.
MA line is for support and resistance.
Disclaimer:
Iam not Sebi registered so i started this as a hobby, please do your own analysis, any profit/loss you gained is not my concern. I can be wrong please do not take it seriously thank you.

#NIFTY Intraday Support and Resistance Levels - 12/11/2025Nifty is expected to open with a gap up near the 25,700–25,750 zone, continuing its positive momentum from the previous sessions. The index is approaching a crucial resistance zone, and a sustained move above this level may trigger further upside momentum.
If Nifty sustains above 25,750–25,800, traders can look for long opportunities, with potential upside targets at 25,850, 25,900, and 25,950+. A breakout beyond 26,000 could extend the rally toward 26,150–26,250, signaling a shift into a stronger bullish phase.
On the downside, support lies near 25,700, and below that, 25,600–25,500 will act as a strong demand zone. A break below 25,700 could trigger short-term profit booking toward lower supports.
Overall, with a gap up opening, market sentiment remains bullish, but traders should monitor whether Nifty can sustain above 25,750. Failing to hold this level could lead to range-bound movement or mild retracement, while sustained strength may confirm a fresh breakout toward 26,000+.

A Technical Perspective on Craftsman Automation LtdCraftsman Automation Ltd is showing strong bullish momentum, trading above its previous resistance and forming a classic higher high–higher low pattern. This technical setup suggests a potential breakout to new highs in the coming weeks or months.
Craftsman Automation Ltd has been on a steady upward trajectory, recently trading around ₹7,175. This price action is not just a number—it reflects a deeper technical story unfolding on the charts. Let’s break it down using simple yet powerful technical principles.
🔁 The Power of Higher Highs and Higher Lows
One of the most reliable patterns in technical analysis is the higher high–higher low sequence. It’s a hallmark of a sustained uptrend. Here’s what it means:
Higher Highs: Each new peak is higher than the previous one, showing increasing buying interest.
Higher Lows: Each pullback ends at a level higher than the last, indicating that sellers are unable to push the price down significantly.
Craftsman Automation has been consistently respecting this structure on the weekly chart, which adds more weight to the trend’s strength. Weekly patterns are more reliable than daily ones because they filter out short-term noise.
🔓 Breaking Past Resistance
The stock has now moved above its September 2024 resistance, which was also the previous swing high. This breakout is significant because:
It confirms the continuation of the uptrend.
It signals that the market has absorbed selling pressure at that level.
It opens the door for price discovery—where the stock can explore new highs without historical resistance.
This is often when momentum traders and institutional investors step in, adding fuel to the rally.
📊 RSI: Gauging Momentum, Not Overcomplicating It
The Relative Strength Index (RSI) is a simple yet effective momentum indicator. Currently, RSI is above 50 and approaching 70. Here’s why that matters:
Above 50: Indicates bullish momentum.
Approaching 70: Suggests increasing strength, but not yet overbought.
When RSI crosses 70 during an uptrend, it often signals strong bullish continuation, not necessarily a reversal—especially when supported by price structure like higher highs and higher lows.
🧠 Why This Setup Matters
This isn’t just about indicators—it’s about confluence. The alignment of price structure (higher highs/lows), breakout above resistance, and strengthening momentum (RSI) creates a compelling technical case. Traders often look for such confluence to increase the probability of success.
🛠️ Risk Management Still Rules
Even in strong setups, risk management is key. Traders might consider:
Trailing stop-losses below recent higher lows.
Scaling in rather than going all-in at once.
Watching for volume confirmation to validate the breakout.
In summary, Craftsman Automation Ltd is technically positioned for a potential breakout to new highs, supported by a textbook uptrend structure and strengthening momentum. For traders and investors who follow price action and trend-based strategies, this could be a high-probability opportunity worth watching.

NIFTY KEY LEVELS FOR 11.11.2025NIFTY KEY LEVELS FOR 11.11.2025
Timeframe: 3 Minutes
If the candle stays above the pivot point, it is considered a bullish bias; if it remains below, it indicates a bearish bias. Price may reverse near Resistance 1 or Support 1. If it moves further, the next potential reversal zone is near Resistance 2 or Support 2. If these levels are also broken, we can expect the trend.
When a support or resistance level is broken, it often reverses its role; a broken resistance becomes the new support, and a broken support becomes the new resistance.
If the range(R2-S2) is narrow, the market may become volatile or trend strongly. If the range is wide, the market is more likely to remain sideways
please like and share my idea if you find it helpful
📢 Disclaimer
I am not a SEBI-registered financial adviser.
The information, views, and ideas shared here are purely for educational and informational purposes only. They are not intended as investment advice or a recommendation to buy, sell, or hold any financial instruments.
Please consult with your SEBI-registered financial advisor before making any trading or investment decisions.
Trading and investing in the stock market involves risk, and you should do your own research and analysis. You are solely responsible for any decisions made based on this research.

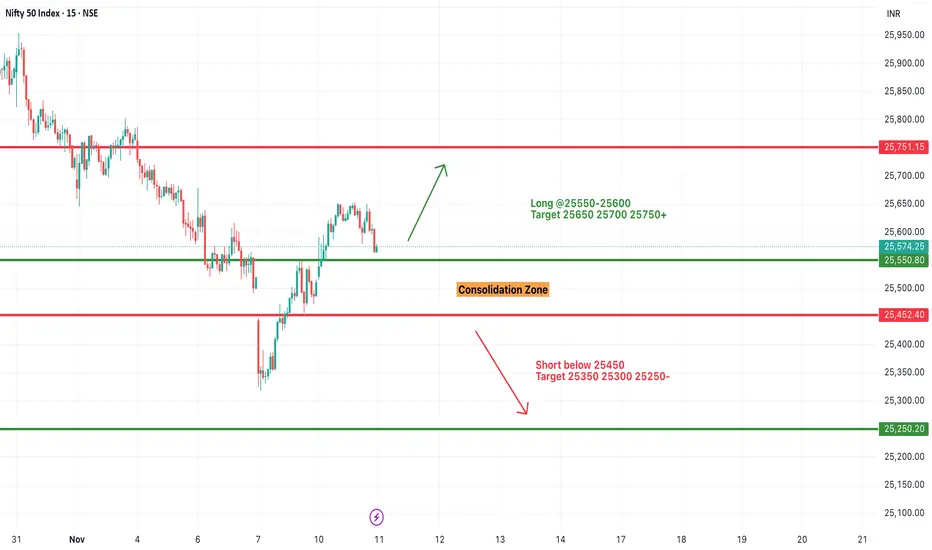
#NIFTY Intraday Support and Resistance Levels - 11/11/2025Nifty is likely to open flat near the 25,550–25,580 zone, with no major changes from yesterday’s levels. The index continues to trade within a tight consolidation range, reflecting indecision between buyers and sellers.
If Nifty sustains above 25,600, it may trigger a mild upside move toward 25,650, 25,700, and 25,750+, marking the upper boundary of the current consolidation phase. A breakout above 25,750 would be required to confirm fresh bullish momentum.
On the downside, support lies at 25,450, and a breakdown below this level could invite selling pressure toward 25,350, 25,300, and 25,250.
Overall, with a flat opening and stable levels, traders should expect sideways to range-bound price action in the first half. Momentum may build only after a decisive breakout above 25,600 or a breakdown below 25,450. Maintaining discipline with stop losses is key in such a narrow-range environment.
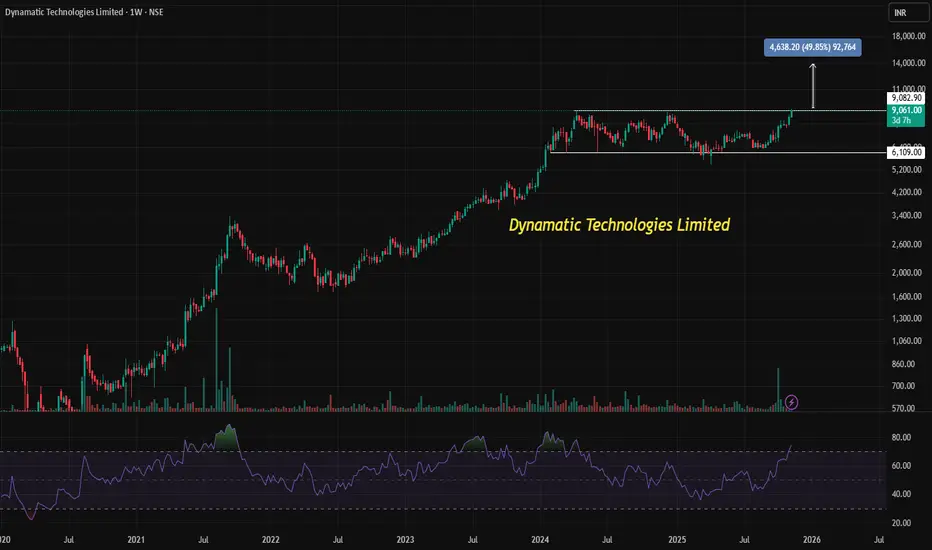
DYNAMATECH is showing signs of a bullish breakout on WeeklyChartDynamatic Technologies is showing signs of a bullish breakout from a long consolidation phase, with a potential upside target of ₹13,900–₹14,000 based on the rectangle chart pattern.
📈 Understanding the Rectangle Breakout in Simple Terms
In the world of stock charts, a rectangle pattern is like a pause in a conversation. The price moves sideways within a defined range — bouncing between a top (resistance) and bottom (support) — without making any big moves up or down. This phase is called consolidation, and it often reflects indecision among buyers and sellers.
Rectangle pattern forms when a stock trades between two horizontal lines for a period of time.
Breakout happens when the price finally moves above the resistance line, signaling renewed buying interest.
Breakdown is the opposite — when price falls below support, indicating selling pressure.
This pattern is useful because it helps traders spot potential turning points. Once the breakout occurs, it often leads to a strong price move in the direction of the breakout.
🔍 Dynamatic Technologies: What’s Happening Now?
Dynamatic Technologies Ltd. has been trading in a tight range since April 2024, forming a textbook rectangle pattern on its weekly chart. As of early November 2025, the stock is attempting a positive breakout, currently trading around ₹9,060.
Here’s what makes this breakout noteworthy:
Long consolidation: The stock has been range-bound for over 1.6 years, which builds up potential energy for a strong move.
RSI strength: The Relative Strength Index (RSI), a momentum indicator, has climbed above 70 — a sign that buying momentum is picking up.
Volume and price action: A breakout accompanied by rising volume and strong price movement often confirms the trend.
🎯 How Is the Target Calculated?
The beauty of the rectangle pattern is its simplicity in estimating price targets. The expected move after a breakout is often equal to the height of the rectangle — the distance between the support and resistance levels.
Suppose the rectangle ranged between ₹6,000 and ₹9,000.
The height is ₹3,000,
Add this to the breakout level (₹9,000), and you get a target of ₹12,000.
In Dynamatic’s case, the projected move is even more ambitious — aiming for ₹13,900 to ₹14,000, which suggests a larger rectangle height or a more aggressive breakout.
🧠 Why It Matters for Investors
Rectangle breakouts are popular among traders because they offer:
Clear entry and exit points: Buy on breakout, set stop-loss below support.
Defined risk-reward: The height of the rectangle helps estimate potential gains.
Momentum confirmation: Indicators like RSI help validate the breakout strength.
For long-term investors, such patterns can signal a shift in trend — from sideways to upward — especially when backed by strong fundamentals or news, like Dynamatic’s recent aerospace partnership
✅ Final Thoughts
Dynamatic Technologies is showing technical strength with a rectangle breakout, supported by rising RSI and bullish price action. If the breakout sustains, the stock could potentially reach ₹13,900–₹14,000, offering a compelling opportunity for momentum-driven investors.
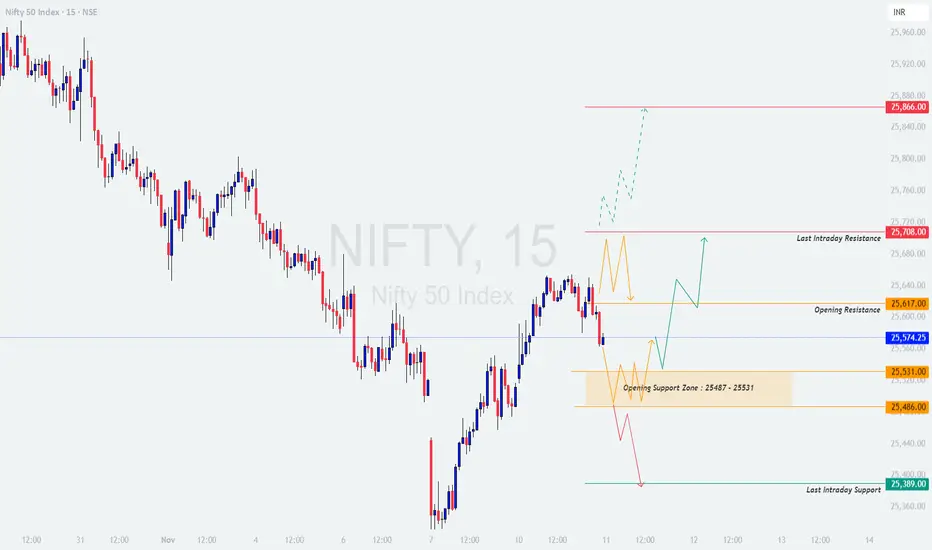
NIFTY : Trading levels and Plan for 11-Nov-2025📊 NIFTY TRADING PLAN — 11 NOV 2025
(Timeframe Reference: 15-Min Chart)
Chart Summary:
Nifty is currently trading near 25,574 , positioned just below the Opening Resistance (25,617) and slightly above the Opening Support Zone (25,487 – 25,531) . The index continues to consolidate in a tight range after a short-term rebound, suggesting that a breakout is imminent.
The structure indicates that the market is at a decision point — a sustained move above 25,617 may invite further upside momentum, while slipping below 25,487 could expose the lower support near 25,389 .
Volatility may increase as traders position ahead of the weekend and key economic data.
Key Levels to Watch:
🟢 Supports: 25,531 / 25,487 / 25,389
🟥 Resistances: 25,617 / 25,708 / 25,866
⚖️ Bias Zone: 25,487 – 25,617 (Opening Range)
🟢 Scenario 1: GAP-UP Opening (100+ Points)
If Nifty opens above 25,670 – 25,700 , it will be opening close to the Last Intraday Resistance (25,708) . Bulls will need to sustain above this zone to extend momentum toward 25,866 .
If price sustains above 25,708 with strong bullish candles and rising volume, a move toward 25,820 – 25,866 is likely.
However, if Nifty opens higher but fails to hold above 25,708 , it may trigger profit booking back toward 25,617 – 25,574 .
Traders should avoid emotional long entries at the open — instead, wait for a retest of 25,617 to confirm support before going long.
Use trailing stops once the price moves 30–40 points in your favor to secure profits in case of sharp reversals.
💡 Educational Note:
Gap-up openings can often be deceptive — they excite traders into premature entries without confirming strength. True momentum is validated only when the market holds above resistance zones with rising volume and strong candle closes. Always let the first few candles define control between bulls and bears.
🟧 Scenario 2: FLAT Opening (Within 25,487 – 25,617)
A flat opening around the current range will likely lead to a period of early consolidation and directionless moves. The first half-hour will be crucial to identify whether the breakout happens upward or downward.
If price sustains above 25,617 with volume expansion, expect an upside continuation toward 25,708 – 25,866 .
If price breaks below 25,487 , weakness may extend toward 25,389 .
Avoid trading within this range — it’s a “no-clear-edge” zone that traps both sides. Wait for the breakout retest confirmation before entering.
Scalpers can focus on rejection wicks or engulfing patterns near extremes for quick intraday setups.
🧠 Educational Tip:
Flat openings require traders to be patient and disciplined. Most of the false moves occur within the first 30 minutes when traders try to predict direction instead of reacting to it. The best opportunities come once a breakout confirms and retests with volume-backed follow-through.
🔴 Scenario 3: GAP-DOWN Opening (100+ Points)
If Nifty opens below 25,470 or near 25,430 – 25,400 , it will test the Opening Support Zone (25,487 – 25,531) and potentially move toward Last Intraday Support (25,389) .
If a reversal candle (hammer, bullish engulfing) appears near 25,389 , buyers may attempt a short-covering move toward 25,531 – 25,574 .
However, a sustained break below 25,389 with strong red candles and volume can extend weakness toward 25,320 – 25,280 .
Avoid shorting immediately on a deep gap-down — instead, wait for a pullback toward resistance zones like 25,487 – 25,531 for better risk-reward.
Volume analysis near the support zone will help confirm whether selling pressure is continuing or exhausting.
📘 Educational Insight:
Gap-downs are driven by overnight panic, and traders often overreact during the first few minutes. Smart money usually waits for sellers to exhaust before entering for reversals. Watching the candle structure and volume at key supports gives clues to whether it’s a continuation or reversal day.
💼 RISK MANAGEMENT TIPS FOR OPTIONS TRADERS:
Avoid buying options during the first 15 minutes after market open — early IV spikes inflate premiums and reduce your edge.
Always define your risk before entering; limit your exposure to 1–2% of total capital per trade .
Prefer ITM options for directional conviction, as they are less affected by time decay.
If using OTM options, exit quickly after 20–30 points in your favor — don’t let greed turn into decay.
Trail stop-losses as soon as your position gains momentum, and never remove stop-losses hoping for a bounce.
Remember: Consistency in managing risk is what keeps traders in the game, not catching every move.
📈 SUMMARY:
🟧 Opening Range Zone: 25,487 – 25,617
🟥 Resistance Levels: 25,708 / 25,866
🟩 Support Levels: 25,531 / 25,487 / 25,389
⚖️ Bias: Neutral-to-Bullish above 25,617 | Weakness below 25,487
📚 CONCLUSION:
Nifty is currently at a tight consolidation zone, preparing for a decisive breakout. A move above 25,617 could attract bullish continuation toward 25,708 – 25,866 , while slipping below 25,487 might tilt control toward bears with potential tests of 25,389 or lower.
Tomorrow’s session will reward patient traders who wait for breakout confirmation and avoid early traps.
Stay objective, respect the levels, and let price action lead the way.
📊 The best trades come not from prediction but from preparation and disciplined execution.
⚠️ DISCLAIMER:
I am not a SEBI-registered analyst . The views and analysis shared above are solely for educational purposes . Please do your own research or consult a certified financial advisor before making any trading or investment decisions.
Gujarat Ambuja Exports Ltd (GAEL) at Key Support levelsGujarat Ambuja Exports Ltd (NSE: GAEL), currently trading at ₹111.00, is positioned at a critical juncture on its long-term trend line support. This level has historically acted as a strong base for price reversals, and current technical signals suggest a similar setup may be unfolding.
🔍 Trend Line Support: A Proven Reversal Zone
The stock has approached this long-term ascending trend line three times in the past, each time triggering a notable reversal.
The current price action once again aligns with this support, indicating a potential fourth bounce if the trend holds.
📊 RSI Behavior: Echoes of the Past
The Relative Strength Index (RSI) has consistently dipped below the 50 mark during previous touches of the trend line, only to recover as the price rebounded.
At present, RSI is hovering around 40, a level that has historically acted as long-term support for momentum.
A move back above 50 on the RSI, in conjunction with price stability or reversal, could signal the start of a fresh upward leg.
⚠️ Key Takeaway
This technical setup remains valid only as long as the trend line support holds. A decisive breach below this level would invalidate the bullish thesis and warrant a reassessment of the trend.
This analysis highlights how price action and RSI can work together to identify high-probability reversal zones.

Kotak buying scenario........Kotak Mahindra Bank is forming a wonderful scenario in buying side. It is ranging between trend lines for long time and now taking a reversal after a pullback. Below conditions are reflecting the situation of smart money to jump in…….
1. After pullback it is respecting cluster of 50/100 and 200 SMA and formed a rejection candle.
2. There is a daily FVG nested in OB, which is also being respected.
3. RSI is also at mid-level and showing a reversal..
4. We may see some choppy kind of situation for few days and later breakout.
Note – if you liked this analysis, please boost the idea so that other can also get benefit of it.
Also follow me for notification for incoming ideas.
Also Feel free to comment if you have any input to share.
Disclaimer – This analysis is just for education purpose not any trading suggestion. Please take the trade at your own risk and with the discussion with your financial advisor.
