NIFTY : Trading levels and Plan for 03-Nov-2025🔹 NIFTY Trading Plan for 03-Nov-2025
(Based on psychological correction zones and technical confluences)
Chart Reference Levels:
🟩 Opening & Important Support: 25,644 – 25,682
🟧 Opening Resistance: 25,773
🟥 Last Intraday Resistance: 25,905
🩶 Last Intraday Support: 25,614
🩵 Extended Support Zone: 25,459
🟢 Scenario 1: Gap-Up Opening (100+ points above previous close)
If Nifty opens above 25,830 – 25,860, monitor how prices react near 25,905 (Last Intraday Resistance). A sustained move above this level with good momentum can trigger an upward extension towards 26,015.
However, if rejection appears near 25,905, expect a possible intraday correction back toward 25,773 (Opening Resistance), which could now act as support.
For option traders: Look for quick scalps on CE side only after confirmation (e.g., 15-min candle closes above 25,905). Avoid chasing if volatility spikes immediately after opening.
📘 Educational Note: Gap-ups often trap late buyers, so patience during the first 15–30 minutes can help identify genuine breakouts versus false moves.
🟠 Scenario 2: Flat Opening (±50 points from previous close around 25,730)
In this case, early trade will revolve around the Opening and Important Support zone (25,644–25,682). A bounce from this region could create a base for testing 25,773 and possibly 25,905 if momentum builds.
On the other hand, a clear break and sustained move below 25,644 may attract selling pressure, pushing prices toward 25,614 and later 25,459.
Intraday traders can focus on range-bound strategies initially, buying near support and selling near resistance, until a decisive breakout occurs.
📘 Educational Note: Flat openings provide balanced opportunities — observe where institutional participation appears before committing. Price confirmation > prediction.
🔴 Scenario 3: Gap-Down Opening (100+ points below previous close)
A gap-down below 25,650 immediately places Nifty near or inside the support pocket (25,644–25,682). Watch for signs of reversal (hammer-type candles or volume spikes).
If Nifty fails to hold above 25,614, bears could dominate, targeting 25,459 as the next logical intraday support.
However, if Nifty stabilizes and closes back above 25,682, it could turn into a short-covering day with recovery potential up to 25,773.
📘 Educational Note: Gap-downs usually trigger emotional trades. Stay calm — wait for structure confirmation instead of reacting impulsively to open volatility.
💡 Tips for Risk Management in Options Trading
Always define your risk per trade — never risk more than 1–2% of your total capital on a single position.
Use stop-loss based on hourly candle close rather than fixed points for better accuracy in volatile sessions.
Avoid averaging in loss-making trades; instead, re-enter only on confirmation of trend reversal.
Focus on delta-neutral spreads (like Bull Call / Bear Put) on volatile days to manage premium decay effectively.
Remember: preserving capital is more important than chasing every move. The market will always provide new opportunities.
📊 Summary & Conclusion:
Above 25,905 → Bulls regain control, eyeing 26,015 as the next target.
Between 25,682–25,773 → Neutral zone, ideal for short-term reversals.
Below 25,614 → Bears dominate, with possible slide towards 25,459.
In essence, the session for 03-Nov-2025 may open with uncertainty near key support zones, so disciplined observation and reaction-based trading will be the key to consistent results.
⚠️ Disclaimer:
I am not a SEBI-registered analyst . This analysis is shared purely for educational and informational purposes. Traders are advised to conduct their own research or consult a certified financial advisor before taking any investment or trading decisions.
Niftyprediction

31 Oct 2025 - Finally, we are short-selling Nifty + PostMortemNifty Stance Bearish 🐻
In last week's postmortem report, we said the Diwali rally would be coming to an end. I guess I said that too early, as I was hoping for a reversal on Monday or Tuesday, but the reversal came only on Friday.
Our last long signal was on the 3rd of October and a short-reversal came only on the 31st, which again shows how Nifty spent an entire month in bullish mode. The profits gained in this period is a whopping 985 points ~ 3.97%.
We have now formed a decent double top at the 26086 level and a faint double bottom on an upward-sloping trendline. As we all know, only one of them will actually work, and the double top is here to stay.
The upcoming support levels are 25681, 25219 and 25003. If we break the 25681 on Monday, the next 400 pts fall could come quite easily as more shorts could enter the system.
Meanwhile, the new rules on Nifty bank look really promising as the weightage of each component should not exceed 20% and a total of 14 banks have to be present in the index. The downside to this rule is that HDFC and ICICI banks, which have a weightage above 20% currently, may have to face outflows to reduce the weightage, or their weightage may have to be controlled via a formula.

Bank of India Signals Bullish Continuation on Monthly ChartBank of India (NSE: BANKINDIA) is currently trading at ₹139.88 and presents a technically strong setup for bullish trend continuation. A closer look at the monthly chart reveals several key developments that reinforce this outlook.
🔍 Technical Highlights
✅ Intermediate Downtrend Reversal
The stock has completed an intermediate downtrend reversal, marked by a higher high at ₹107.00. This level sits above the neckline of the previous consolidation pattern, confirming a shift in momentum and signaling renewed strength in the trend.
📊 Moving Average Alignment
Price action is currently above both the 50-day and 100-day moving averages. This positioning reflects underlying bullish sentiment and sustained buying interest. Moreover, the 50 DMA has crossed above the 100 DMA—a classic bullish crossover that often precedes further upward movement.
📈 Long-Term Uptrend Intact
The broader trend remains upward, supported by consistent higher lows and higher highs. The recent price behavior aligns with this long-term trajectory, suggesting that the stock is well-positioned for continued gains.
💪 RSI Above 50
The Relative Strength Index (RSI) is comfortably above the 50 level, indicating strong buyer strength and confirming the bullish momentum.
📌 Learners Takeaway
With the intermediate downtrend reversal, bullish moving average crossover, and RSI strength, Bank of India shows a textbook setup for trend continuation. Traders and investors may find this an opportune moment to align with the prevailing uptrend, while keeping an eye on price action near key support and resistance zonesfor validation.
Live chart Example

#nifty view Nifty opened today at 25,863.8 after an initial upside move to 25,955.75, reflecting early bullish momentum. However, the index faced resistance at these higher levels and saw a reversal, dropping to a low near 25,800 during the session. This downside move highlights renewed selling pressure, making 25,800 a decisive support zone for the day.
If Nifty fails to sustain above 25,800, further downside risk remains, and additional selling could intensify, potentially accelerating the decline. Therefore, traders should monitor 25,800 closely—holding above it may invite a recovery, while a clear breach signals the possibility of deeper corrections.
#nifty50 #stockmarket #niftyanalysis #stockmarketindia #investing

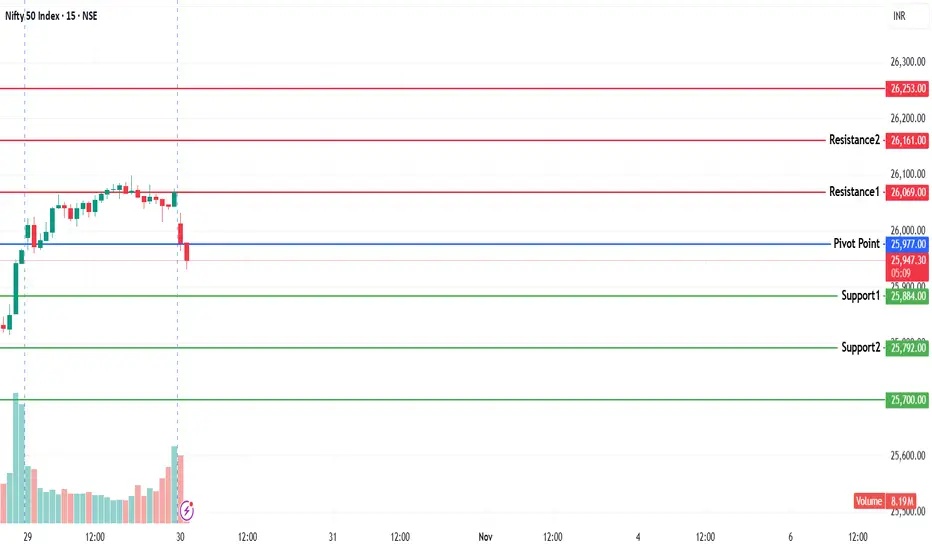
NIFTY KEY LEVELS FOR 31.10.2025NIFTY KEY LEVELS FOR 31.10.2025
Timeframe: 3 Minutes
If the candle stays above the pivot point, it is considered a bullish bias; if it remains below, it indicates a bearish bias. Price may reverse near Resistance 1 or Support 1. If it moves further, the next potential reversal zone is near Resistance 2 or Support 2. If these levels are also broken, we can expect the trend.
When a support or resistance level is broken, it often reverses its role; a broken resistance becomes the new support, and a broken support becomes the new resistance.
If the range(R2-S2) is narrow, the market may become volatile or trend strongly. If the range is wide, the market is more likely to remain sideways
please like and share my idea if you find it helpful
📢 Disclaimer
I am not a SEBI-registered financial adviser.
The information, views, and ideas shared here are purely for educational and informational purposes only. They are not intended as investment advice or a recommendation to buy, sell, or hold any financial instruments.
Please consult with your SEBI-registered financial advisor before making any trading or investment decisions.
Trading and investing in the stock market involves risk, and you should do your own research and analysis. You are solely responsible for any decisions made based on this research.

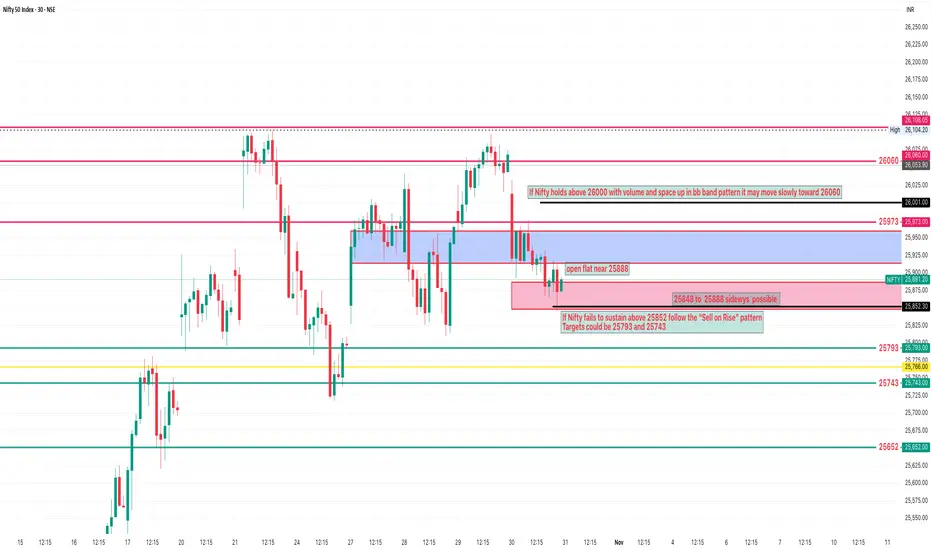
NIFTY Analysis 31 october 2025 ,Daily Morning update at 9 amif Nifty fails to sustain above 25852 u can use the “Sell on Rise” pattern
Targets could be 25793 and 25743
but if Nifty holds above 26000 with volume and forms bn pattern in bb band and space upside it may move little slowly toward 26060
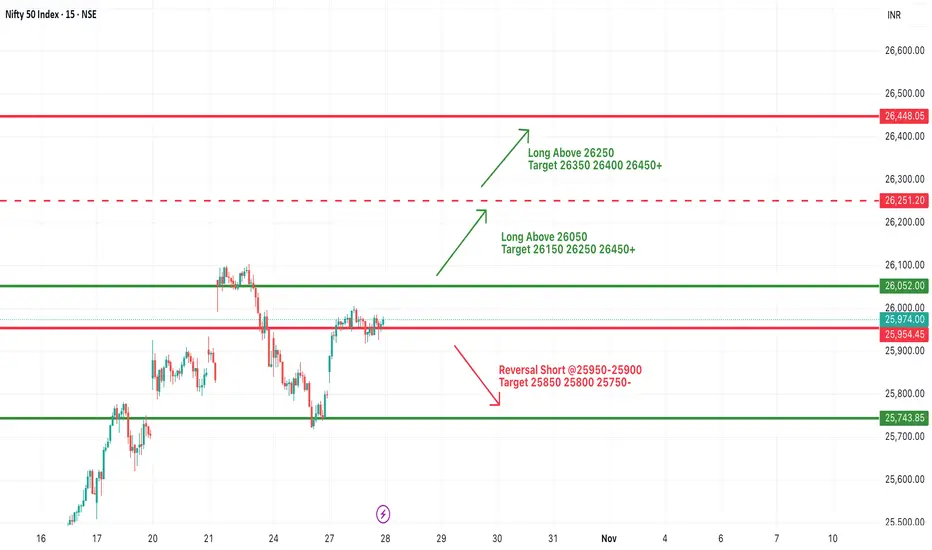
#NIFTY Intraday Support and Resistance Levels - 31/10/2025Nifty is likely to open slightly gap up near the 25,900–25,950 zone, remaining within the ongoing consolidation range seen over the past few sessions. The index continues to trade between key support and resistance zones, reflecting indecision among traders as the market awaits a clear breakout in either direction.
If Nifty sustains above 25,950–26,000, we may see a gradual upside move toward 26,050, 26,150, and 26,250+ levels. A breakout above 26,250 will confirm renewed bullish momentum, opening the path for a short-term rally toward 26,400–26,450.
On the downside, immediate support lies near 25,850–25,800. A breakdown below 25,800 could drag the index toward 25,750 and 25,650 levels, indicating short-term weakness.
Overall, with a slightly gap up opening inside the consolidation zone, traders should remain cautious and focus on trading only after a breakout from the 25,800–26,050 range. Until then, range-bound movement with limited momentum can be expected, so quick entries and exits with strict stop losses are advisable.

NIFTY : Trading levels and Plan for 31-Oct-2025📊 Prepared by LiveTradingBox | Based on 15-min structure and key intraday levels
🔍 Key Reference Levels:
🟥 Profit Booking Zone: 26,218 – 26,256
🟥 Last Intraday Resistance: 26,020
🟧 Opening Resistance / Support: 25,911
🟩 Opening and Last Support Zone: 25,731 – 25,793
🟢 Major Support Extension: 25,643
🟢 1. Gap-Up Opening (Above 26,020 – 100+ points)
If Nifty opens above 26,020, it signals strong momentum continuation, possibly fueled by short-covering or positive global cues. The first resistance to watch is 26,218 – 26,256, which is the defined profit booking zone.
Plan of Action:
Allow the first 15–20 minutes for prices to stabilize — avoid jumping into trades immediately.
If the index sustains above 26,020, consider entering a long position with a target of 26,218–26,256.
Use a stop loss below 25,911 (opening support zone) to manage risk.
Book partial profits near 26,218 and trail stop-loss to cost to protect gains.
If rejection occurs near 26,218–26,256, wait for confirmation candles; this zone may trigger intraday pullbacks.
📘 Educational Insight:
A sustained gap-up above resistance often traps late sellers. Smart traders wait for a retest near the breakout zone (26,020) to enter with better risk–reward potential rather than chasing the first green candle.
🟦 2. Flat Opening (Around 25,891 ±50 points)
A flat start near the opening level (25,891) indicates indecision between bulls and bears. Directional clarity will emerge after either a breakout above 25,911–26,020 or a breakdown below 25,793.
Plan of Action:
Observe initial 15–30 minutes of price formation — volatility could be misleading.
If price sustains above 25,911, expect a move toward 26,020, and if momentum continues, toward 26,218–26,256.
Breakdown below 25,793 can invite selling pressure targeting 25,731 – 25,643.
Avoid trading inside the narrow 25,891–25,911 range; such zones often cause whipsaws.
Wait for a confirmed candle close beyond these boundaries to enter with clarity.
📘 Educational Insight:
Flat openings are “setup builders.” Patience is key — professionals let price confirm strength or weakness before reacting. Avoid predicting; instead, follow the flow post-confirmation.
🔻 3. Gap-Down Opening (Below 25,731 – 100+ points)
If Nifty opens below 25,731, it signals weakness or global negative cues. The next logical test is 25,643, a strong support level that may attract buyers for short-covering rallies.
Plan of Action:
Watch early price reaction near 25,643. A strong rebound candle here can offer a low-risk long entry aiming for 25,793–25,911.
If the index fails to hold 25,643, avoid longs — it could extend weakness toward 25,550–25,500 (psychological round level).
For short trades, enter only after confirmation of sustained weakness below 25,643.
Keep stop loss above 25,731 to manage risk effectively.
Avoid averaging losing trades — respect stop losses to prevent capital erosion.
📘 Educational Insight:
Gap-downs can cause emotional reactions. Instead of panic selling, focus on how the market behaves at defined support levels — reaction matters more than prediction.
🧠 Risk Management Tips for Options Traders:
Always use a stop loss. A small loss is a business expense — not a failure.
Don’t enter trades impulsively in the first 15 minutes; let volatility settle.
Stick to ATM or slightly ITM options to balance premium decay and delta sensitivity.
Avoid overtrading — 1 or 2 good trades a day are enough.
Risk only 2–3% of your trading capital on a single setup.
Trail profits using structure-based levels instead of fixed points.
📈 Summary & Conclusion:
Above 26,020, momentum remains bullish with targets near 26,218–26,256.
Between 25,911–25,793, expect a consolidation zone — stay patient and trade confirmed breakouts only.
Below 25,731, weakness may extend toward 25,643 or even 25,550 if pressure sustains.
Follow disciplined risk management; reacting to price structure is always safer than predicting direction.
⚠️ Disclaimer:
I am not a SEBI-registered analyst . The above analysis is purely for educational and informational purposes only . Traders are advised to perform their own research or consult a financial advisor before making any investment or trading decisions.

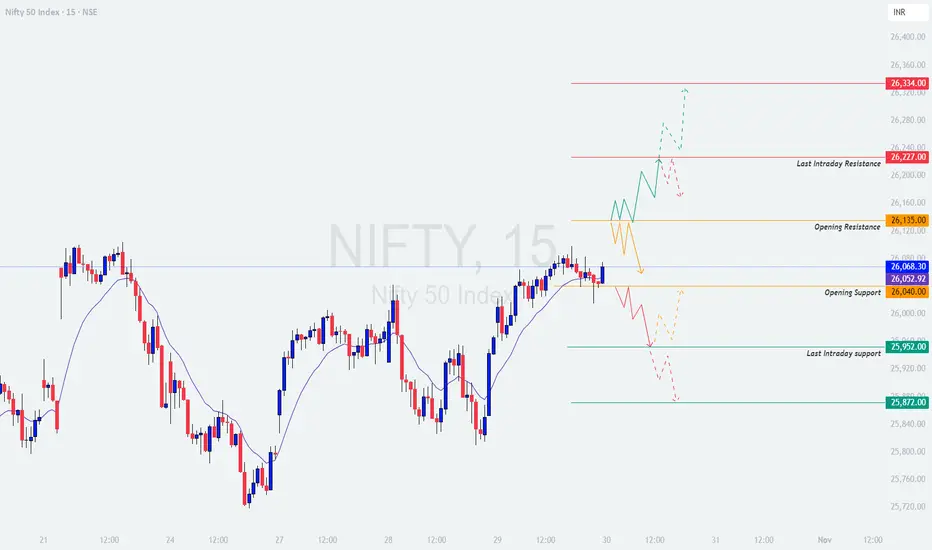
NIFTY : Trading levels and Plan for 30-Oct-2025NIFTY TRADING PLAN – 30-Oct-2025
📊 Prepared by LiveTradingBox | Based on 15-min chart structure & key intraday reference zones
🔍 Key Levels to Watch:
🟥 Last Intraday Resistance: 26,227
🟥 Next Resistance Extension: 26,334
🟧 Opening Resistance: 26,135
🟦 Opening Support: 26,040
🟩 Last Intraday Support: 25,952
🟢 Major Support Zone: 25,872
🟢 1. Gap-Up Opening (Above 26,135 – 100+ points)
If Nifty opens with a Gap-Up above 26,135 , it enters the higher resistance zone. The immediate focus will shift to whether it can sustain above this level. Sustained price action above 26,135 may trigger momentum buying toward 26,227 and possibly 26,334 if strength continues.
Plan of Action:
Wait for the first 15-minute candle to close. Avoid chasing the initial spike.
If price sustains above 26,135, consider entering long positions targeting 26,227–26,334 zone.
Keep a strict stop loss below 26,040 on a closing basis.
If rejection occurs near 26,227, book profits partially and trail your stop to cost.
If Nifty fails to sustain above 26,135 and slips below 26,040, avoid longs and prepare for a pullback toward 25,952.
📘 Educational Insight:
A strong gap-up requires confirmation. Many traders jump in early, but waiting for price to hold above the opening resistance helps avoid fake breakouts.
🟦 2. Flat Opening (Around 26,040 ±50 points)
A flat start near 26,040 suggests balanced sentiment between buyers and sellers. Directional clarity will emerge once either the resistance or support levels are broken.
Plan of Action:
Allow the first 30 minutes for market stabilization.
A sustained move above 26,135 with volume indicates strength — target 26,227 with a stop loss below 26,040.
If Nifty stays range-bound between 26,135–26,040, expect sideways movement — best avoided for options trading.
Breakdown below 26,040 will open short opportunities targeting 25,952–25,872 zones.
For option buyers, avoid overtrading in sideways phases to reduce premium decay.
📘 Educational Insight:
Flat openings are often “wait-and-watch” setups. Avoid predicting direction; instead, react once key levels confirm strength or weakness.
🔻 3. Gap-Down Opening (Below 25,952 – 100+ points)
If Nifty opens below 25,952, it reflects weak sentiment and profit booking pressure. The index will test demand near 25,872, which serves as the final intraday support zone.
Plan of Action:
Monitor price reaction near 25,872 — if it holds and rebounds, expect a short-covering rally toward 26,040.
If Nifty remains below 25,952 without recovery, maintain a bearish stance with a target of 25,820 (psychological level).
Place a stop loss above 26,040 on an hourly close.
Avoid bottom fishing; wait for confirmation candles before considering reversals.
📘 Educational Insight:
Gap-down setups usually trigger panic trades. Professionals wait for stabilization before entering, while retail traders often get trapped during early volatility.
🧠 Risk Management Tips for Options Traders:
Always define your risk — use stop-loss orders and don’t hold losing trades beyond your comfort zone.
Avoid trading both sides of the market; pick one directional bias.
Stick to ATM or slightly ITM options to manage time decay efficiently.
Avoid aggressive trades during the first 15–30 minutes after the market opens.
Maintain proper position sizing — never risk more than 2–3% of your trading capital in a single trade.
📈 Summary & Conclusion:
Above 26,135, the bias remains bullish — expect an extension toward 26,227–26,334.
Between 26,040–26,135, expect choppy consolidation — best to wait for breakout confirmation.
Below 25,952, weakness may extend toward 25,872 or lower if support fails.
Stick to a disciplined approach — react to price, don’t predict it.
⚠️ Disclaimer:
I am not a SEBI-registered analyst . The above analysis is purely for educational and informational purposes. Traders should do their own analysis or consult a financial advisor before taking any positions.
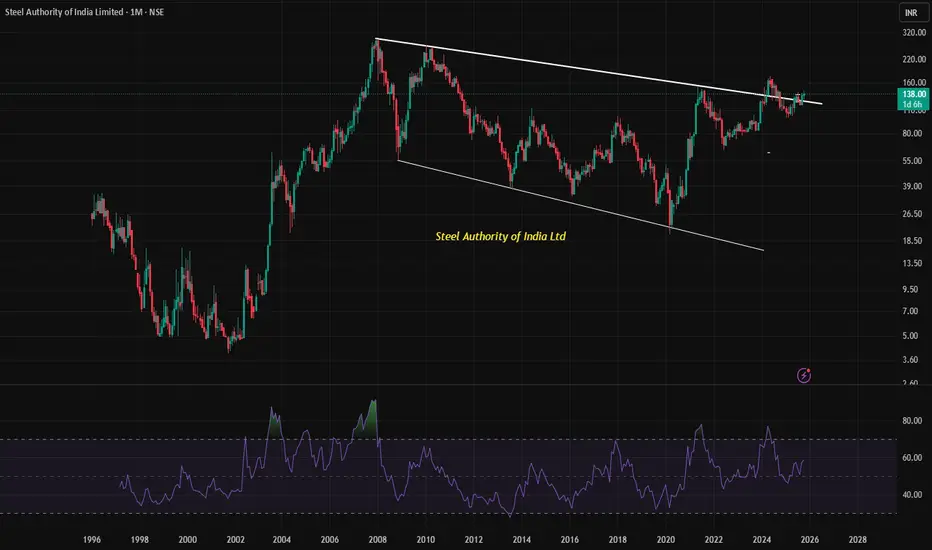
SAIL is seen sustaining breakout of 17-year downtrend channelSAIL is seen sustaining the breaking out of a 17-year downtrend channel on monthly charts, signaling a potentially powerful long-term reversal.
📈 Steel Authority of India (SAIL): Breaking Free from a 17-Year Technical Grip
Steel Authority of India Ltd. (SAIL), one of India’s largest steel producers, is currently trading around ₹138.80 and showing signs of a major technical breakout. What makes this move noteworthy is that it’s emerging from a downward-sloping channel that has persisted since 2007–2008, spanning nearly 17 years. A breakout from such a long-term pattern is rare and often carries significant implications for future price action.
🔍 Understanding the Downtrend Channel
A downtrend channel is formed when a stock consistently makes lower highs and lower lows, bounded by parallel trendlines. For SAIL, this channel has defined its price movement for over a decade, acting as a ceiling that repeatedly rejected upward momentum. Breaking above this channel suggests a shift in market sentiment—from bearish to bullish.
📊 Monthly Chart Breakout: Why It Matters
Timeframe strength: Monthly chart breakouts are considered more reliable than daily or weekly ones because they reflect long-term investor behavior.
Volume confirmation: Sustained breakout levels often coincide with increased trading volume, indicating institutional interest.
Psychological shift: Surpassing a multi-year resistance level can trigger a wave of buying from traders who were previously cautious.
📈 Technical Indicators Support the Move
According to recent technical analysis:
📊 RSI Confirms Strength
The Relative Strength Index (RSI), a key momentum indicator, is currently moving in the 50–70 range, with recent readings around 58.42. This range is considered a bullish zone, indicating that buying momentum is building without the stock being overbought. Sustained RSI levels above 50 often precede further upward movement, especially when aligned with a breakout.
Price is above both 50-day and 200-day SMAs, reinforcing the strength of the breakout.
These indicators collectively suggest that the breakout is not just a short-term anomaly but part of a broader trend reversal.
🧠 Investor Takeaway
SAIL’s breakout from a 17-year downtrend channel is a textbook example of a long-term technical reversal. With supporting indicators like RSI, MACD, and moving averages aligning in favor of bulls, this move could mark the beginning of a sustained uptrend. Traders and investors may consider this a strong technical setup, but should also factor in macroeconomic conditions and sector fundamentals before making decisions.
Live chart Example
NIFTY KEY LEVELS FOR 30.10.2025NIFTY KEY LEVELS FOR 30.10.2025
Timeframe: 3 Minutes
If the candle stays above the pivot point, it is considered a bullish bias; if it remains below, it indicates a bearish bias. Price may reverse near Resistance 1 or Support 1. If it moves further, the next potential reversal zone is near Resistance 2 or Support 2. If these levels are also broken, we can expect the trend.
When a support or resistance level is broken, it often reverses its role; a broken resistance becomes the new support, and a broken support becomes the new resistance.
If the range(R2-S2) is narrow, the market may become volatile or trend strongly. If the range is wide, the market is more likely to remain sideways
please like and share my idea if you find it helpful
📢 Disclaimer
I am not a SEBI-registered financial adviser.
The information, views, and ideas shared here are purely for educational and informational purposes only. They are not intended as investment advice or a recommendation to buy, sell, or hold any financial instruments.
Please consult with your SEBI-registered financial advisor before making any trading or investment decisions.
Trading and investing in the stock market involves risk, and you should do your own research and analysis. You are solely responsible for any decisions made based on this research.
Update idea
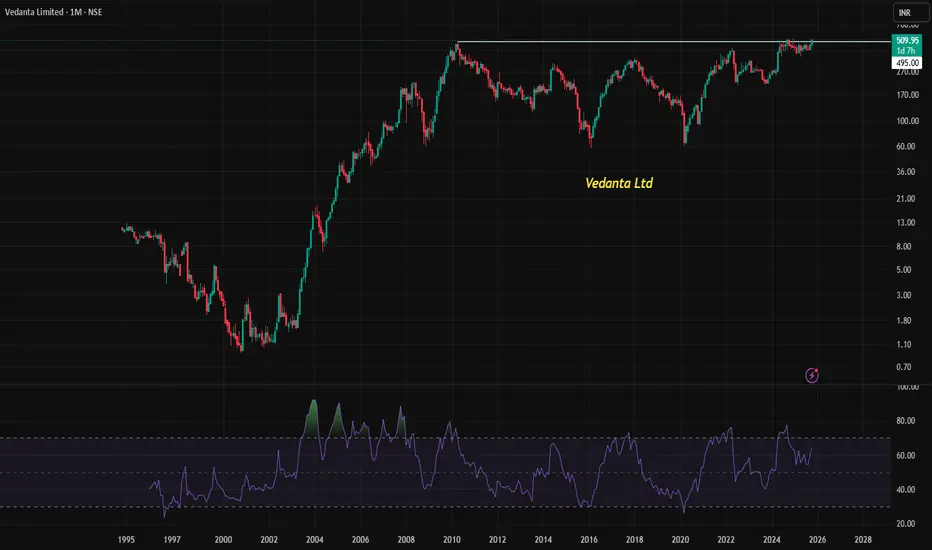
Vedanta Limited is experiencing a major technical breakoutVedanta Limited is experiencing a major technical breakout, surpassing its previous lifetime high from 2010, with strong RSI momentum signaling bullish strength.
📈 Vedanta Limited: A Technical Breakout After 15 Years
Vedanta Limited (NSE: VEDL), a major player in the metals and mining sector, is currently trading around ₹513. This marks a significant milestone, as the stock has broken above its previous lifetime high set in 2010, signaling a long-awaited technical breakout. Such a move is often seen as a strong bullish indicator, especially when supported by other technical metrics.
🔍 What Is a Breakout?
A breakout occurs when a stock moves above a defined resistance level—typically a previous high—on increased volume and momentum. In Vedanta’s case, the resistance was its 2010 peak, which has now been decisively breached. This suggests renewed investor confidence and potential for further upside.
📊 RSI Momentum: A Bullish Signal
The Relative Strength Index (RSI) is a momentum oscillator that measures the speed and change of price movements. It ranges from 0 to 100, with readings above 50 generally indicating bullish momentum. Vedanta’s RSI is currently hovering between 50 and 70, with recent readings around 69.91, placing it firmly in the uptrend zone. This suggests that the stock is gaining strength but hasn't yet entered the overbought territory (above 70), which could mean there's still room for growth.
🧭 Moving Averages Support the Trend
Vedanta’s price is also trading above key moving averages:
50-day SMA: ₹454.8
200-day SMA: ₹441.52
Trading above these averages confirms the bullish trend and adds further credibility to the breakout.
📌 Why This Matters
Long-term breakout: Surpassing a 15-year high is rare and often leads to sustained rallies.
Strong technical indicators: RSI, SMA, and other oscillators are aligned in favor of bulls.
Sector momentum: The metals and mining sector has seen renewed interest, adding tailwinds to Vedanta’s move.
🧠 Investor Takeaway
Vedanta’s breakout above its 2010 high is not just a chart anomaly—it’s a signal of potential long-term trend reversal. With RSI in a healthy range and price action supported by moving averages, technical analysts may view this as a strong buy zone. However, as always, investors should consider broader market conditions and fundamental factors before making decisions.
Live chart Example
#NIFTY Intraday Support and Resistance Levels - 30/10/2025Nifty is expected to open slightly gap up near the 26,050–26,100 zone, indicating a continuation of positive sentiment seen in the previous sessions. The index has moved out of its recent consolidation phase and is now trading near a key breakout level, suggesting that buyers are gradually regaining control.
If Nifty sustains above 26,100, we could see an upward move toward 26,150, 26,250, and 26,450+ levels. A breakout above 26,250 will confirm strong bullish momentum and could trigger a rally toward 26,450–26,600 in the short term.
On the downside, immediate support lies near 25,950–25,900. A dip below 25,900 might lead to mild profit booking, pulling the index back toward 25,800 and 25,750 levels.
Overall, with a slightly gap up opening, the market sentiment remains positive. Traders should watch for sustained trade above 26,050 for long opportunities while maintaining a trailing stop loss below 25,900 to safeguard gains in case of a pullback.

NIFTY Intraday Trade Setup For 30 Oct 2025NIFTY Intraday Trade Setup For 30 Oct 2025
Bullish-Above 26110
Invalid-Below 26060
T- 26350
Bearish-Below 25920
Invalid-Above 25970
T- 25690
NIFTY has closed on a bullish note with 0.45% gain today. Index has been consolidating below 26100 since few days. Above 26110 index is all set for a fresh ATH. On a 15 Min candle close above 26110, plan a long for the target of 26345. 25900 zone can be a confluence zone. Plan a short below 25920 on 15 Min candle close, 25690 will be target.
In case of a big gap up/down, wait till 10 o'clock and mark the high and low of the trading range (5MIN). Trade on this range breakout.
==========
I am Not SEBI Registered
This is my personal analysis for my personal trading. Kindly consult your financial advisor before taking any actions based on this.

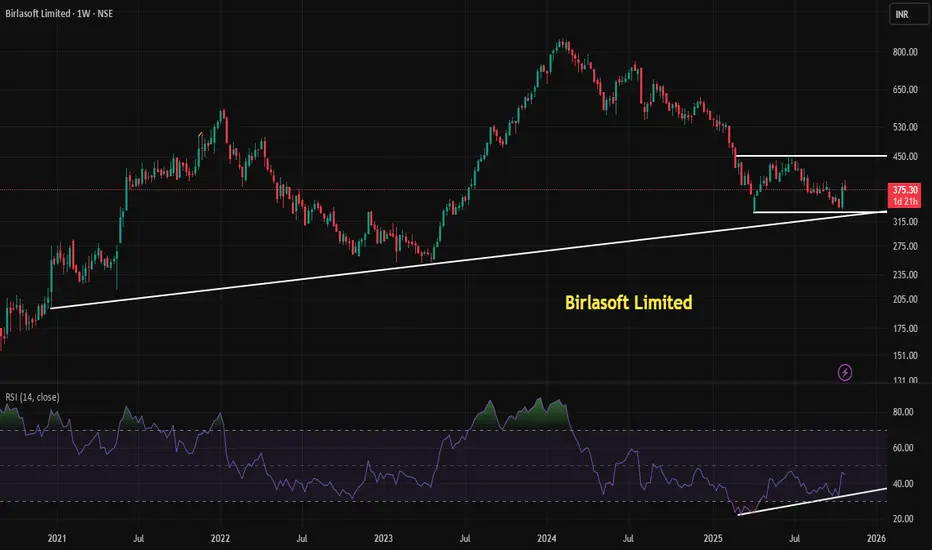
BIRLASOFT LIMITED is showing a bullish Technical setupBirlasoft Ltd. is showing a bullish technical setup with a double bottom pattern and RSI positive divergence on the weekly chart, suggesting a potential trend reversal from recent lows.
Understanding the Setup: Double Bottom + RSI Divergence
Birlasoft Ltd, currently trading around ₹376.60, has recently formed a double bottom pattern on its weekly chart—a classic bullish reversal signal. This pattern typically appears after a prolonged downtrend and consists of two distinct troughs at roughly the same price level, separated by a moderate peak. It reflects a shift in market sentiment from bearish to bullish.
In Birlasoft’s case, the two bottoms were formed near the ₹330 zone, indicating strong support. The neckline resistance lies around ₹450, and a breakout above this level could confirm the pattern and trigger further upside.
RSI Positive Divergence: Momentum Shift
Adding strength to this setup is the Relative Strength Index (RSI) positive divergence. While the stock price made a lower low/equal low during the second bottom, the RSI made a higher low—signaling that bearish momentum is weakening. This divergence often precedes a price reversal and suggests that buyers are gradually regaining control.
Educational Takeaway
This setup is a textbook example of how combining price action with momentum indicators can enhance technical analysis:
Double Bottom: Indicates potential reversal and strong support.
RSI Divergence: Confirms weakening bearish momentum.
Volume Confirmation: A breakout above ₹450 with rising volume would validate the pattern.
Traders often wait for a breakout above the neckline with strong volume before entering long positions. Stop-losses are typically placed just below the second bottom to manage risk.
Final Thoughts
While the technicals suggest a bullish bias, it's crucial to monitor broader market conditions and company fundamentals. Birlasoft operates in the IT services sector, which is sensitive to global tech trends and client spending cycles.
This live chart analysis offers a compelling case for a potential trend reversal, but disciplined execution and risk management remain key.
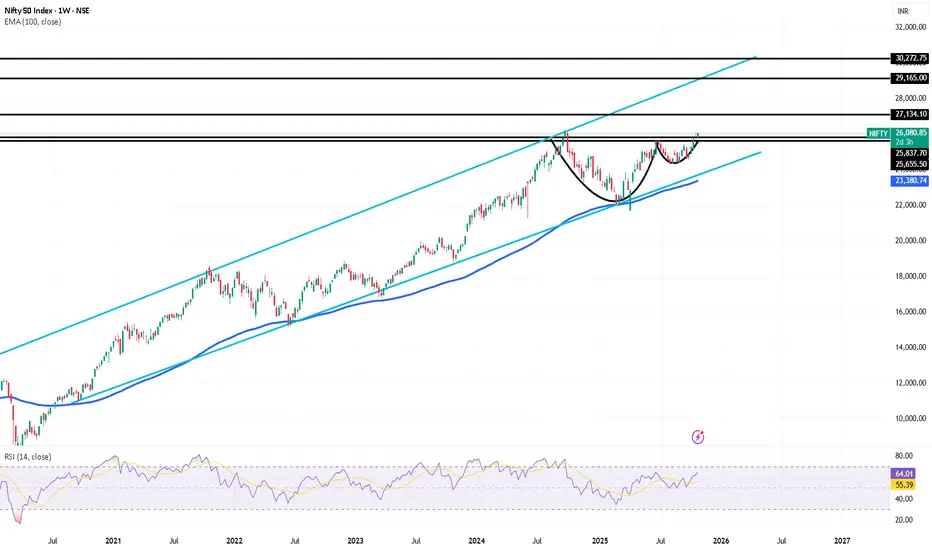
NIfty Positional on the verge of Breakout PatternHello everyone,
Nifty weekly forming Cup & handle pattern and about to break along with lifetime high with Good RSI strength is 64. Nifty corrected 16% from preivous high of 26270 falls continue for almost 6 month and in next 6 month recovered fully....possible trading in channel above 26600-700 there is 27500 and the 30000 is the targets.
Indian bank ready for boost tgt 4000 ??Indian Bank has strong fundamentals. The stock has given a technical breakout around ₹400, with major support at ₹400 and the next key level at ₹630. The long-term target for the next 3–4 years is ₹4,000.

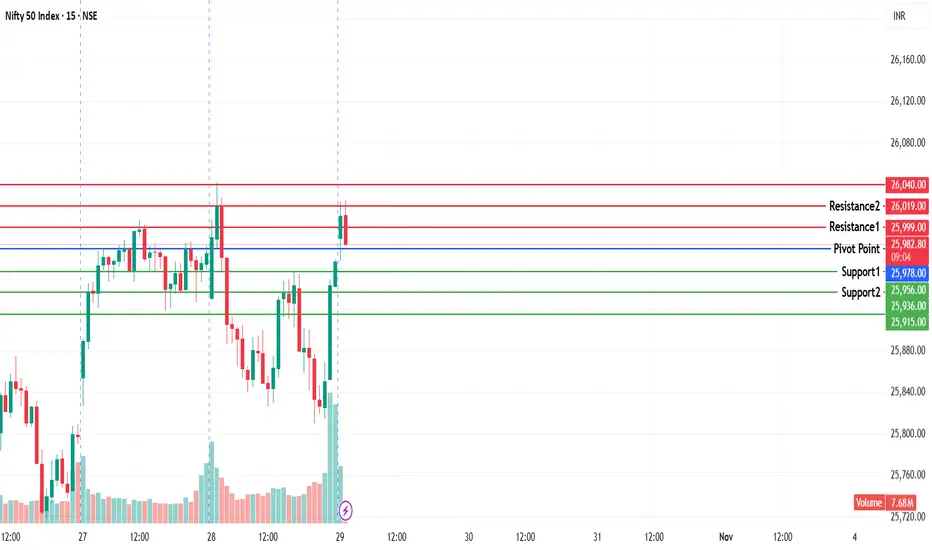
NIFTY KEY LEVELS FOR 29.10.2025NIFTY KEY LEVELS FOR 29.10.2025
Timeframe: 3 Minutes
If the candle stays above the pivot point, it is considered a bullish bias; if it remains below, it indicates a bearish bias. Price may reverse near Resistance 1 or Support 1. If it moves further, the next potential reversal zone is near Resistance 2 or Support 2. If these levels are also broken, we can expect the trend.
When a support or resistance level is broken, it often reverses its role; a broken resistance becomes the new support, and a broken support becomes the new resistance.
If the range(R2-S2) is narrow, the market may become volatile or trend strongly. If the range is wide, the market is more likely to remain sideways
please like and share my idea if you find it helpful
📢 Disclaimer
I am not a SEBI-registered financial adviser.
The information, views, and ideas shared here are purely for educational and informational purposes only. They are not intended as investment advice or a recommendation to buy, sell, or hold any financial instruments.
Please consult with your SEBI-registered financial advisor before making any trading or investment decisions.
Trading and investing in the stock market involves risk, and you should do your own research and analysis. You are solely responsible for any decisions made based on this research.
#NIFTY Intraday Support and Resistance Levels - 29/10/2025Nifty is expected to open with a gap up near the 26,000–26,050 zone, indicating strong buying interest after the recent consolidation phase. The index has been oscillating within a range, and today’s opening above the consolidation zone may trigger a directional move if sustained.
If Nifty holds above 26,050–26,100, it could extend gains toward 26,150, 26,250, and 26,450+ levels. A breakout above 26,250 will confirm bullish momentum and may lead to further upside toward 26,450–26,600 in the short term.
On the downside, immediate support lies near 25,950–25,900. A fall below 25,900 could invite minor profit booking, pushing the index toward 25,800 and 25,750 zones.
Overall, with a gap up opening above the consolidation zone, the market sentiment remains positive. Traders should focus on long positions above 26,050, while maintaining a trailing stop loss below 25,900 to safeguard profits.

NIFTY : Trading levels and Plan for 29-Oct-2025NIFTY TRADING PLAN – 29-Oct-2025
📊 Nifty closed around 25,965, forming a tight consolidation within the No-Trade Zone (25,910 – 26,021). The index has been oscillating between intraday resistances and supports, showing signs of indecision. As we head into tomorrow’s session, traders should focus on reactions around the key breakout and breakdown levels.
🟩 SCENARIO 1: GAP-UP OPENING (100+ Points Above 26,021)
If Nifty opens above 26,021, it will immediately face the Last Intraday Resistance Zone (26,134 – 26,227).
A strong opening above 26,021 may trigger bullish momentum, driving prices toward 26,134.
Sustaining above 26,134 could attract follow-through buying, targeting 26,227 and possibly 26,300+.
However, this resistance zone is also a potential profit-booking area, where early buyers might book gains.
Failure to sustain above 26,134 could bring a pullback toward 26,021, which will act as an intraday pivot level.
🧠 Educational Insight:
Gap-ups often represent overnight optimism, but smart traders wait for a confirmation candle before entering. False breakouts near resistance zones can trap long positions quickly.
⚙️ Plan of Action:
→ If the first 15–30 minutes hold above 26,134, look for intraday long entries toward 26,227 – 26,300 with a stop-loss below 26,021.
→ If prices reject 26,134, expect a corrective dip — short-term traders can scalp short positions back toward 26,021.
🟨 SCENARIO 2: FLAT OPENING (Between 25,910 – 26,021)
A flat start inside the No-Trade Zone usually signals a day of range-bound activity in the initial session.
The market may stay choppy between 25,910 and 26,021 before choosing direction.
A breakout above 26,021 can trigger bullish momentum, while a breakdown below 25,910 will invite sellers.
Avoid trading inside this zone as both buyers and sellers may get trapped due to low directional clarity.
🧠 Educational Insight:
The “No-Trade Zone” is where risk-reward ratios are unfavorable. Experienced traders often wait for a clean breakout candle or volume confirmation before committing capital.
⚙️ Plan of Action:
→ Avoid premature entries. Wait for an hourly candle close above 26,021 or below 25,910 to initiate trades.
→ Maintain smaller position sizes until the trend direction becomes evident.
🟥 SCENARIO 3: GAP-DOWN OPENING (100+ Points Below 25,910)
If Nifty opens below 25,910, it will test the Last Intraday Support Zone (25,712 – 25,736).
Expect buyers to attempt a bounce from 25,712 – 25,736 initially.
If this zone fails, the next key support comes at 25,624, which could act as a potential reversal level.
A sustained break below 25,624 may trigger further downside pressure and shift short-term sentiment bearish.
🧠 Educational Insight:
Gap-downs often create emotional reactions, but disciplined traders wait to see if the first bounce holds. Many intraday reversals begin near strong support zones when retail traders panic sell.
⚙️ Plan of Action:
→ For aggressive traders: Short below 25,712 with targets near 25,624, keeping stop-loss above 25,910.
→ For conservative traders: Wait for a rejection candle near 25,910 to confirm a continuation or reversal pattern before entry.
💡 RISK MANAGEMENT TIPS FOR OPTIONS TRADERS
Avoid trading the first 15–30 minutes; let volatility settle before entering.
Always set a fixed stop-loss (preferably not exceeding 1–2% of your trading capital).
Prefer ITM options for directional trades to minimize time decay.
Exit half your position once you achieve 1:1 R:R to protect profits.
Avoid overtrading inside the No-Trade Zone — capital protection should be your top priority.
📘 SUMMARY & CONCLUSION
Key Resistance Levels: 26,021 → 26,134 → 26,227
Key Support Levels: 25,910 → 25,736 → 25,624
No Trade Zone: 25,910 – 26,021
🔹 Nifty remains in a neutral-to-cautious zone, with short-term volatility expected near 26,134 resistance.
🔹 A breakout above 26,134 can extend upside momentum, while a breakdown below 25,910 may invite fresh selling.
🔹 The best approach is to stay patient for directional clarity, respect levels, and trade with defined stops.
⚠️ Disclaimer: I am not a SEBI-registered analyst. This analysis is shared purely for educational and informational purposes. Please do your own research or consult a certified financial advisor before making any trading decisions.

NIFTY KEY LEVELS FOR 28.10.2025NIFTY KEY LEVELS FOR 28.10.2025
Timeframe: 3 Minutes
If the candle stays above the pivot point, it is considered a bullish bias; if it remains below, it indicates a bearish bias. Price may reverse near Resistance 1 or Support 1. If it moves further, the next potential reversal zone is near Resistance 2 or Support 2. If these levels are also broken, we can expect the trend.
When a support or resistance level is broken, it often reverses its role; a broken resistance becomes the new support, and a broken support becomes the new resistance.
If the range(R2-S2) is narrow, the market may become volatile or trend strongly. If the range is wide, the market is more likely to remain sideways
please like and share my idea if you find it helpful
📢 Disclaimer
I am not a SEBI-registered financial adviser.
The information, views, and ideas shared here are purely for educational and informational purposes only. They are not intended as investment advice or a recommendation to buy, sell, or hold any financial instruments.
Please consult with your SEBI-registered financial advisor before making any trading or investment decisions.
Trading and investing in the stock market involves risk, and you should do your own research and analysis. You are solely responsible for any decisions made based on this research.

NIFTY Analysis 28 october 2025 ,Daily Morning update at 9 amNifty chart shows bounce after profit booking
Market showing signs of short covering at lower levels
Nifty tested 47.2 percent fake. level and bounced
Today Nifty may open near 26010 level
Market likely to move sideways in early session
Consolidation expected above 26000 mark
Watch price action near 26000 for intraday direction
If Nifty crosses above 26010 with volume then buy
First target 26075
Second target 26135
Third target 26203 if momentum continues
Keep stop loss below 25960 for all long positions
If Nifty falls below 25958 then sell on rise strategy active.samjhe ki nahi?
Below 25958 next support 25904
Next support 25840 for intraday traders
If price breaks below 25840 expect more downside pressure
today focus on 26000 zone for confirmation of trend

#NIFTY Intraday Support and Resistance Levels - 28/10/2025Nifty is expected to open with a gap up above the 26,050 level, indicating bullish momentum carried over from the previous session. The index has reclaimed a crucial resistance zone and now stands poised for a potential breakout continuation if buying pressure sustains after the opening bell.
If Nifty holds above 26,050, we could see further upside toward 26,150, 26,250, and 26,450+ levels. A breakout above 26,250 may accelerate momentum and push the index toward 26,450–26,600, confirming short-term bullish strength.
On the downside, immediate support lies around 25,950–25,900. A fall below 25,900 may trigger a minor pullback toward 25,800 and 25,750 zones.
Overall, the gap up opening above 26,050 reflects positive sentiment, and as long as Nifty sustains above this level, the trend remains bullish. Traders should focus on trend-following entries on dips and maintain a trailing stop loss below 25,900 to protect profits in case of volatility.