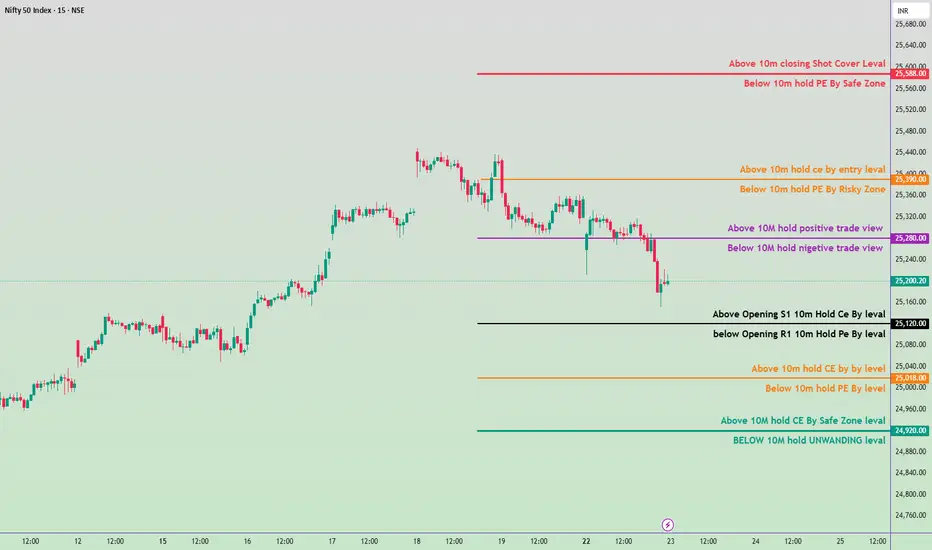
23 sep 2025 Nifty 50 Index with tomorrow’s key levels🔑 Key Levels
25,680 → Above 10m closing Short Cover Level
Below 10m hold PE by Safe Zone
25,390 → Above 10m hold CE by Entry Level
Below 10m hold PE by Risky Zone
25,280 → Above 10m hold Positive Trade View
Below 10m hold Negative Trade View
25,120 → Above Opening S1 10m Hold CE by Level
Below Opening R1 10m Hold PE by Level
25,008 → Above 10m hold CE by Level
Below 10m hold PE by Level
24,920 → Above 10m hold CE by Safe Zone Level
Below 10m hold Unwinding Level
“Stay tuned for more learning – like & follow now!”
Niftyresistances
18 sep 2025 support–resistance trading plan Key Levels
25,518 → Above 10m Closing Short Cover Level
(If sustained above, short covering possible)
25,500 Zone → Below 10m Hold PE Safe Zone
25,420 → Above 10m Hold CE Entry Level
Below 10m Hold PE Risky Zone
25,333 → Above 10m Hold Positive Trade View
Below 10m Hold Negative Trade View
25,270 → Above Opening S1 10m Hold CE Buy Level
Below Opening R1 10m Hold PE Buy Level
25,170 → Above 10m Hold CE Buy Level
Below 10m Hold PE Buy Level
25,070 – 25,060 →
25,070 = Above 10m Hold CE Safe Zone
25,060 = Below 10m Hold UNWINDING Level

Nifty 50 Index trading levels Key Levels
25,130 → Above 10m closing Shot Cover Level
Below 10m Hold PE by Safe Zone
24,970 → Above 10m Hold CE by Entry Level
Below 10m Hold PE by Risky Zone
24,821 → Above 10m Hold Positive Trade View
Below 10m Hold Negative Trade View
24,678 → Above Opening S1 10m Hold CE by Level
Below Opening R1 10m Hold PE by Level
24,570 → Above 10m Hold CE by By Level
Below 10m Hold PE by Level
24,380 → Above 10m Hold CE by Safe Zone Level
Below 10m Hold UNWINDING Level

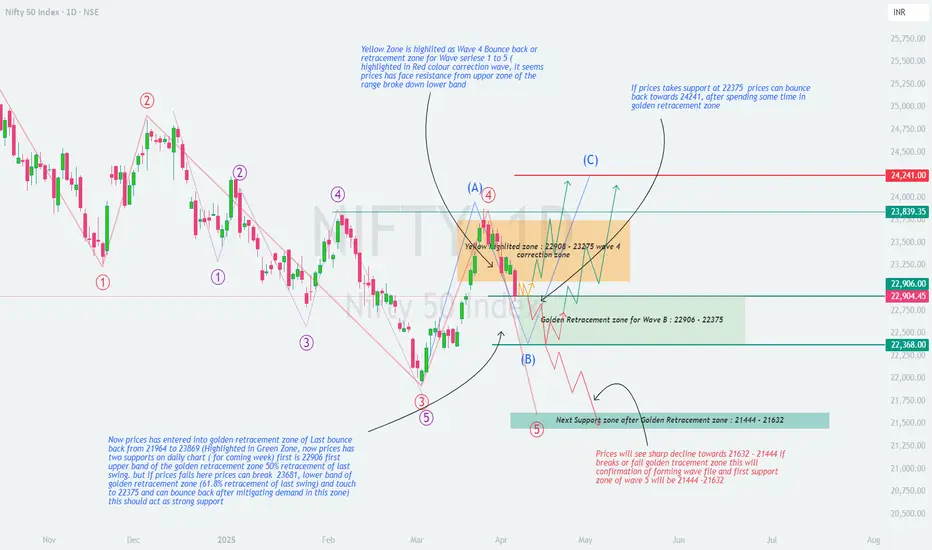
NIFTY : Weekly Analysis (07-Apr to 11-Apr)📊 NIFTY 50 Weekly Analysis – Elliott Wave & Retracement Outlook (April Week 2)
As per the latest Elliott Wave analysis and Fibonacci retracement zones plotted on the chart, NIFTY is currently at a critical juncture . Price action from here will define whether the market resumes upward correction or heads for a deeper fall.
🧠 Technical Structure Overview
The red-labelled impulse wave series 1 to 5 has completed, indicating a completed correction wave structure .
A corrective bounce has been observed post-Wave 5 in the form of Wave A .
Price is now moving in a Wave B correction and has entered a key Fibonacci retracement zone.
📍 Important Zones to Watch
🔶 Yellow Zone – Wave 4 Correction Resistance:
Range: 22,908 – 23,275
This was a previous bounce zone (Wave 4), now acting as a resistance range.
Price faced strong rejection here and reversed down into retracement territory.
🟩 Golden Fibonacci Retracement Zone for Wave B:
Range: 22,906 – 22,368
Price has entered this critical retracement zone.
This range corresponds to:
50% retracement = 22,906 (upper band)
61.8% retracement = 22,368 (lower band)
Implication: If NIFTY sustains within this zone and forms a base, it may initiate a move towards Wave C.
🧭 Scenarios for Coming Week
✅ Bullish Scenario:
If price sustains above 22,368 and reclaims 22,906, it can bounce back towards:
🎯 Target 1: 23,839
🎯 Target 2: 24,241 (Wave C projection)
Confluence: Wave A-B-C projection fits well within this move.
❌ Bearish Scenario:
If price breaks below 22,368 and fails to hold the golden zone:
Expect a sharp decline towards support zone: 21,444 – 21,632
This move would confirm the formation of another impulsive Wave 5 down .
🔍 Key Support and Resistance Levels
Resistance:
22,908
23,275
23,839
24,241
Support:
22,906 (Upper Golden Zone)
22,368 (Lower Golden Zone)
21,632 – 21,444 (Major Support Zone)
📌 Conclusion:
NIFTY is in a decisive zone. Whether we go for Wave C up or another Wave 5 down depends on price action within the 22,906 – 22,368 zone .
Traders should:
Watch for confirmation candles and volumes.
Use demand zone reactions to position accordingly.
Maintain strict risk management.
💬 Share your views in the comments – do you expect a bounce from here or a breakdown?
#NIFTY50 #ElliottWave #TechnicalAnalysis #TradingView #NIFTYAnalysis #Fibonacci #SwingTrading #PriceAction
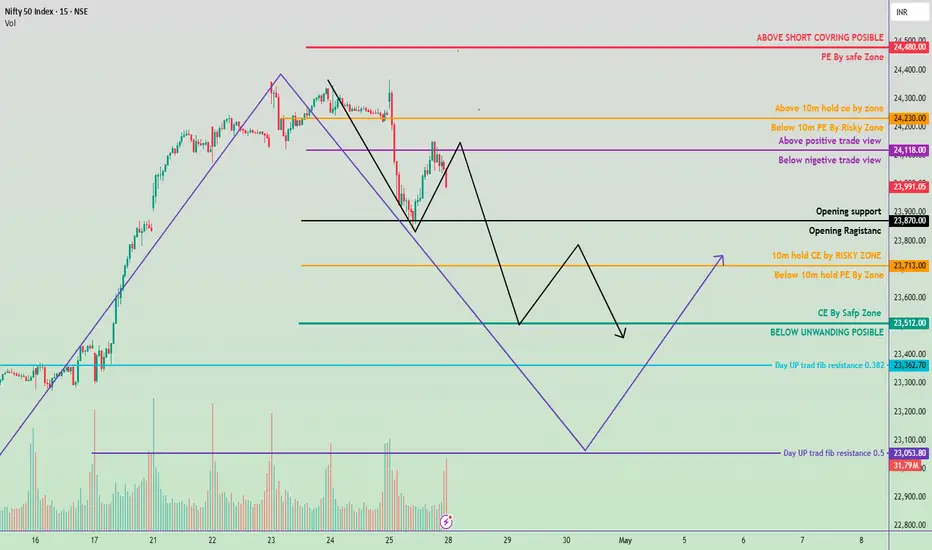
28 april nifty trading zone#Nifty50 #option trading
99% working trading plan
👉Gap up open 24118 above & 15m hold after positive trade target 24230,
👉Gap up open 24118 below 15 m not break upside after nigetive trade target 23870, 23713, 23512
👉Gap down open 24112 above 15m hold after positive trade target 24118 , 24230
👉Gap down open 24112 below 15 m not break upside after nigetive trade target 23870, 23713, 23512
💫big gapdown open 23713 above 1st positive trade view
💫big Gapup opening 24230 below 1st nigetive trade view
📌 Trade plan for education purpose I'm not responsible your trade
More education follow social media and boost my idea
📌 koi bhi trade leval se 20 point ke sl ke bhina karan nahi hi
📌 koi trade app activate tabhi karana hota hi level pe 2 candle uper ya niche closing aati hai to
📌 leval par Ane pe turant trade plan na kare ...
📌 Full risk apaki hi hi meri nah
Nifty - Sell on RiseStrong supply area in multiple time frames like Daily / 125 / 75
Also a strong gap area
Expected resistance zone to fall between 22630 - 22730
Upside Sl above 22800
Downside targets 22400 & 22000
Entry with 15/25 min candle confirmation only

Nifty 50 -Feb 2025 ViewI had posted my last analysis of Nifty at end of Dec 2024 and here we are in Feb 2025 with Nifty being almost at the same price.
So, basically everyone should be happy, right? :P
Why are most of our portfolios in deep red? Let;'s understand the scenario.
Nifty has been highly volatile since the past few months with FII selling continuously and DIIs buying it.
It has been a tug of war between bulls & bears near 23000 which was broken few days back but 22800 managed to act as a support. Level to watch remain same as last idea
View is bearish to sideways with sell on rise.
Expecting a highly volatile 2025 with stock specific movements especially in large cap sector.
Overvalued mid & Smallcap stocks might continue to see correction in upcoming months.
I feel a bullish view can be made only when Nifty sustains above 24800. An accumulation in this zone between 23000 and 24800 will be good for Nifty in upcoming years.
The recent budget will be very beneficial for consumption & hospitality sector. Keep this sector in watchlist.

Diametric pattern near completionNifty should show a Fall towards 22600 levels once g-wave of the Diametric pattern ends.
Looking out for reversals near Daily Central Pivot

Nifty key levels for 03.02.2025Nifty key levels for 03.02.2025
If Nifty breaks the upper or lower range, we can expect momentum. The consolidation zone will be favorable for option sellers, while a breakout on either side will benefit option buyers.
Disclaimer:
I'm not a SEBI Registered financial advisor. These views are purely educational in nature. You are solely responsible for any decisions made based on this research.

NIFTY Bearish Harmonic pattern __RSI overbought Hello Everyone,
NIfty Spot 24260 huge upside move on election results and support area of 23200-23400 now there is one hurdle at 24400-24600 also a bearish harmonic pattern with RSI overbought ,
with trendline+ EMA 200 resistance+ Supply zone.
Nifty either needs to paued the trend and cool off/adjust RSI and tak any of fibbo retracement so small corrective move exepected or sideways is good for long.

nifty 17/21 may possible resistancecmp 22461
resistance zone 22500-22600
book your longs here. with extended weekend upside capped.
note : just a educational opinion and not a trading idea.

Nifty Level Upadate for Trading | END OF DAY CHART ANALYSIS Nifty Level Upadate for Trading | END OF DAY CHART ANALYSIS
Daily Nifty Levels | End of day Nifty Support & resistance India 2022
Buy Call if sustain above 17210 stoploss - 17185 ( if Closing in 15 candle ) target as per chart
Buy put If nifty below 17185 stoploss - 17210 ( if Closing in 15 candle ) target as per chart
Dont trade before 9:30 ,
make Position Sizing
This information is for educational purposes only
