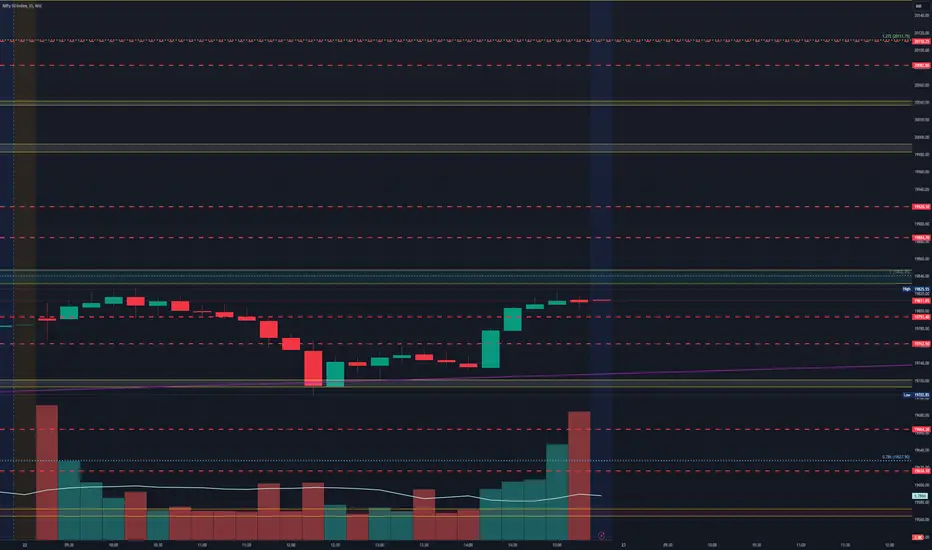
Nifty levels - Dec 20, 2023Nifty support and resistance levels are valuable tools for making informed trading decisions, specifically when combined with the analysis of 5-minute timeframe candlesticks and VWAP. By closely monitoring these levels and observing the price movements within this timeframe, traders can enhance the accuracy of their entry and exit points. It is important to bear in mind that support and resistance levels are not fixed, and they can change over time as market conditions evolve.
The dashed lines on the chart indicate the reaction levels, serving as additional points of significance to consider. Furthermore, take note of the response at the levels of the High, Low, and Close values from the day prior.
We hope you find this information beneficial in your trading endeavors.
* If you found the idea appealing, kindly tap the Boost icon located at the bottom right. We encourage you to share your thoughts and comments regarding it.
Wishing you success in your trading activities!
Niftytomorrow

#Nifty directions and levels for DEC 19th"Good morning, friends. Directions for December 19th: The global market sentiment is bullish, supported by the Dow Jones. However, our local market sentiment shows a bullish trend. It might open with a neutral start based on Giftnifty, which shows +3.
The previous sentiment has not changed. Structurally, the market is moving in consolidation (range market), so we should wait for the breakout. If it breaks the immediate resistance, then we can expect a rally continuation. On the other hand, if it breaks the immediate support, we can expect the 3rd minor wave, which might entail some long correction. However, the important thing is the structure; if it forms a solid structure, we can expect continuation; otherwise, the range will persist."

Nifty - Intraday levels & Prediction - for 19 Dec 2023Nifty Prediction for tomorrow.
Gap up Open then BEARISH Reversal from 21482-21450
Bullish only above PDH / 21510
Demand and Supply Zones - When price breaks the zone, Demand zone will become Resistance and Supply zone will become Support.
Refer the chart for detailed Intraday Support and Resistance levels.
Happy Trading!!

Nifty levels - Dec 19, 2023Nifty support and resistance levels are valuable tools for making informed trading decisions, specifically when combined with the analysis of 5-minute timeframe candlesticks and VWAP. By closely monitoring these levels and observing the price movements within this timeframe, traders can enhance the accuracy of their entry and exit points. It is important to bear in mind that support and resistance levels are not fixed, and they can change over time as market conditions evolve.
The dashed lines on the chart indicate the reaction levels, serving as additional points of significance to consider. Furthermore, take note of the response at the levels of the High, Low, and Close values from the day prior.
We hope you find this information beneficial in your trading endeavors.
* If you found the idea appealing, kindly tap the Boost icon located at the bottom right. We encourage you to share your thoughts and comments regarding it.
Wishing you success in your trading activities!

Nifty Live Intraday Updates for 18-12-23 !!Nifty important levels to watch are as follows
#Support: 21360
Sell below: 21360 only on 15 minute candle closure below the level.
Target 1: 21280
Target 2: 21150
#Resistance: 21490
Buy Above: 21490 only on 15 minute candle closure Above the level.
Target 1: 21570
Target 2: 21700
=> # Remember each level will act as a support and resistance individually so there is a probability of reversal and a pullback on either side so its better to make an habit to book profits at each targets and re-enter again after a breakout from the same with a proper stoploss as per your own risk appetite.
=> # Please do your own research before initiating any trade. Always use stoploss in order to protect your capital.
=> # Please refer our Indicators published on tradingview if you find it useful give it a like.
=> # Follow us for more such information and educational ideas and Indicators. Give it a like if you appreciate the idea. Queries will be answered in comment section.
#Disclaimer: This is just a view and published here only for educational purpose, this should not be considered as a buy or sell signal. Trading in stock market may involve financial risk therefore, do your own research before taking any position.

Nifty - Intraday levels & Prediction - for 18 Dec 2023Nifty Prediction for tomorrow.
BEARISH Reversal can be expected from 21500-21550 levels for a correction.
Demand and Supply Zones - When price breaks the zone, Demand zone will become Resistance and Supply zone will become Support.
Refer the chart for detailed Intraday Support and Resistance levels.
Happy Trading!!

NIfty harami hi guys,
Lets wait for a breif movement for breakout on upside or on down side based on the levels ,and we can see all the inside candles in the big red bar which is a harami and guys this a 1hr time frame so patience is the key and mostly avoid to take trade in first 1hr candle of market opening .
disclaimer- this is not any investment call or idea , this just my view and it can go wrong ,this is only for educational purposes trade at your own risk :)

Nifty levels - Dec 15, 2023Nifty support and resistance levels are valuable tools for making informed trading decisions, specifically when combined with the analysis of 5-minute timeframe candlesticks and VWAP. By closely monitoring these levels and observing the price movements within this timeframe, traders can enhance the accuracy of their entry and exit points. It is important to bear in mind that support and resistance levels are not fixed, and they can change over time as market conditions evolve.
The dashed lines on the chart indicate the reaction levels, serving as additional points of significance to consider. Furthermore, take note of the response at the levels of the High, Low, and Close values from the day prior.
We hope you find this information beneficial in your trading endeavors.
* If you found the idea appealing, kindly tap the Boost icon located at the bottom right. We encourage you to share your thoughts and comments regarding it.
Wishing you success in your trading activities!

Nifty levels - Dec 14, 2023Nifty support and resistance levels are valuable tools for making informed trading decisions, specifically when combined with the analysis of 5-minute timeframe candlesticks and VWAP. By closely monitoring these levels and observing the price movements within this timeframe, traders can enhance the accuracy of their entry and exit points. It is important to bear in mind that support and resistance levels are not fixed, and they can change over time as market conditions evolve.
The dashed lines on the chart indicate the reaction levels, serving as additional points of significance to consider. Furthermore, take note of the response at the levels of the High, Low, and Close values from the day prior.
We hope you find this information beneficial in your trading endeavors.
* If you found the idea appealing, kindly tap the Boost icon located at the bottom right. We encourage you to share your thoughts and comments regarding it.
Wishing you success in your trading activities!

Nifty - Analysis & Prediction - for 12 Dec 2023Nifty Prediction for tomorrow.
BEARISH Trend Reversal expected...
Demand and Supply Zones - When price breaks the zone, Demand zone will become Resistance and Supply zone will become Support.
Refer the chart for detailed Intraday Support and Resistance levels.
Happy Trading!!

Nifty levels - Dec 13, 2023Nifty support and resistance levels are valuable tools for making informed trading decisions, specifically when combined with the analysis of 5-minute timeframe candlesticks and VWAP. By closely monitoring these levels and observing the price movements within this timeframe, traders can enhance the accuracy of their entry and exit points. It is important to bear in mind that support and resistance levels are not fixed, and they can change over time as market conditions evolve.
The dashed lines on the chart indicate the reaction levels, serving as additional points of significance to consider. Furthermore, take note of the response at the levels of the High, Low, and Close values from the day prior.
We hope you find this information beneficial in your trading endeavors.
* If you found the idea appealing, kindly tap the Boost icon located at the bottom right. We encourage you to share your thoughts and comments regarding it.
Wishing you success in your trading activities!

Nifty levels - Dec 12, 2023Nifty support and resistance levels are valuable tools for making informed trading decisions, specifically when combined with the analysis of 5-minute timeframe candlesticks and VWAP. By closely monitoring these levels and observing the price movements within this timeframe, traders can enhance the accuracy of their entry and exit points. It is important to bear in mind that support and resistance levels are not fixed, and they can change over time as market conditions evolve.
The dashed lines on the chart indicate the reaction levels, serving as additional points of significance to consider. Furthermore, take note of the response at the levels of the High, Low, and Close values from the day prior.
We hope you find this information beneficial in your trading endeavors.
* If you found the idea appealing, kindly tap the Boost icon located at the bottom right. We encourage you to share your thoughts and comments regarding it.
Wishing you success in your trading activities!

Nifty Future Chart Analysis for 08.12.2023If price break over 21060, then it may face strong resistance of 21075, above
21075 , price may gain good strong momentum and may reach to the level of 21130
crossing above 21095.
As you can see here that bollinger bands made short squeeze, if it goes
below 20994 then it will also break long trend, it can easily reach to the
level of 20953, and then 20915.

Nifty levels - Dec 8, 2023Nifty support and resistance levels are valuable tools for making informed trading decisions, specifically when combined with the analysis of 5-minute timeframe candlesticks and VWAP. By closely monitoring these levels and observing the price movements within this timeframe, traders can enhance the accuracy of their entry and exit points. It is important to bear in mind that support and resistance levels are not fixed, and they can change over time as market conditions evolve.
The dashed lines on the chart indicate the reaction levels, serving as additional points of significance to consider. Furthermore, take note of the response at the levels of the High, Low, and Close values from the day prior.
We hope you find this information beneficial in your trading endeavors.
* If you found the idea appealing, kindly tap the Boost icon located at the bottom right. We encourage you to share your thoughts and comments regarding it.
Wishing you success in your trading activities!

Nifty levels - Dec 7, 2023Nifty support and resistance levels are valuable tools for making informed trading decisions, specifically when combined with the analysis of 5-minute timeframe candlesticks and VWAP. By closely monitoring these levels and observing the price movements within this timeframe, traders can enhance the accuracy of their entry and exit points. It is important to bear in mind that support and resistance levels are not fixed, and they can change over time as market conditions evolve.
The dashed lines on the chart indicate the reaction levels, serving as additional points of significance to consider. Furthermore, take note of the response at the levels of the High, Low, and Close values from the day prior.
We hope you find this information beneficial in your trading endeavors.
* If you found the idea appealing, kindly tap the Boost icon located at the bottom right. We encourage you to share your thoughts and comments regarding it.
Wishing you success in your trading activities!

Nifty levels - Dec 6, 2023Nifty support and resistance levels are valuable tools for making informed trading decisions, specifically when combined with the analysis of 5-minute timeframe candlesticks and VWAP. By closely monitoring these levels and observing the price movements within this timeframe, traders can enhance the accuracy of their entry and exit points. It is important to bear in mind that support and resistance levels are not fixed, and they can change over time as market conditions evolve.
The dashed lines on the chart indicate the reaction levels, serving as additional points of significance to consider. Furthermore, take note of the response at the levels of the High, Low, and Close values from the day prior.
We hope you find this information beneficial in your trading endeavors.
* If you found the idea appealing, kindly tap the Boost icon located at the bottom right. We encourage you to share your thoughts and comments regarding it.
Wishing you success in your trading activities!

Nifty levels - Dec 5, 2023Nifty support and resistance levels are valuable tools for making informed trading decisions, specifically when combined with the analysis of 5-minute timeframe candlesticks and VWAP. By closely monitoring these levels and observing the price movements within this timeframe, traders can enhance the accuracy of their entry and exit points. It is important to bear in mind that support and resistance levels are not fixed, and they can change over time as market conditions evolve.
The dashed lines on the chart indicate the reaction levels, serving as additional points of significance to consider. Furthermore, take note of the response at the levels of the High, Low, and Close values from the day prior.
We hope you find this information beneficial in your trading endeavors.
* If you found the idea appealing, kindly tap the Boost icon located at the bottom right. We encourage you to share your thoughts and comments regarding it.
Wishing you success in your trading activities!

Nifty levels - Dec 1, 2023Nifty support and resistance levels are valuable tools for making informed trading decisions, specifically when combined with the analysis of 5-minute timeframe candlesticks and VWAP. By closely monitoring these levels and observing the price movements within this timeframe, traders can enhance the accuracy of their entry and exit points. It is important to bear in mind that support and resistance levels are not fixed, and they can change over time as market conditions evolve.
The dashed lines on the chart indicate the reaction levels, serving as additional points of significance to consider. Furthermore, take note of the response at the levels of the High, Low, and Close values from the day prior.
We hope you find this information beneficial in your trading endeavors.
* If you found the idea appealing, kindly tap the Boost icon located at the bottom right. We encourage you to share your thoughts and comments regarding it.
Wishing you success in your trading activities!

Nifty levels - 30 Nov, 2023Nifty support and resistance levels are valuable tools for making informed trading decisions, specifically when combined with the analysis of 5-minute timeframe candlesticks and VWAP. By closely monitoring these levels and observing the price movements within this timeframe, traders can enhance the accuracy of their entry and exit points. It is important to bear in mind that support and resistance levels are not fixed, and they can change over time as market conditions evolve.
The dashed lines on the chart indicate the reaction levels, serving as additional points of significance to consider. Furthermore, take note of the response at the levels of the High, Low, and Close values from the day prior.
We hope you find this information beneficial in your trading endeavors.
* If you found the idea appealing, kindly tap the Boost icon located at the bottom right. We encourage you to share your thoughts and comments regarding it.
Wishing you success in your trading activities!

Nifty analysis for 29th November 2023 for educational purpose onNifty analysis for 29th November 2023 for educational purpose only
This video is for educational purpose and my personal view . We are NOT SEBI registered Advisor, we only give the level on our practical trading experience. Kindly take the trade according to your risk and reward position and consulting your advisor. It is advisable to take the advice of SEBI registered advisor.
YOUR QUERY -
Trading analysis for tomorrow
Nifty price action analysis
Nifty bank nifty analysis
Nifty option chain analysis for tomorrow
Monday bank nifty analysis
Bank nifty daily analysis
Nifty analysis for tomorrow
Option trading daily analysis
Bank nifty weekly analysis
Bank nifty analysis for Monday
Nifty prediction and bank nifty analysis
Tomorrow market prediction
Nifty open interest analysis tomorrow
Nse option chain analysis
Daily option chain analysis
Nifty option chain analysis for tomorrow
Option chain analysis
Today option chain analysis
Option chain analysis for tomorrow
Nifty trader option chain analysis
Today nifty option trading
Nifty trader option chain analysis
Today nifty opening prediction
Nifty post market analysis
Morning nifty prediction
Bank nifty post market analysis

Nifty levels - Nov 29, 2023Nifty support and resistance levels are valuable tools for making informed trading decisions, specifically when combined with the analysis of 5-minute timeframe candlesticks and VWAP. By closely monitoring these levels and observing the price movements within this timeframe, traders can enhance the accuracy of their entry and exit points. It is important to bear in mind that support and resistance levels are not fixed, and they can change over time as market conditions evolve.
The dashed lines on the chart indicate the reaction levels, serving as additional points of significance to consider. Furthermore, take note of the response at the levels of the High, Low, and Close values from the day prior.
We hope you find this information beneficial in your trading endeavors.
* If you found the idea appealing, kindly tap the Boost icon located at the bottom right. We encourage you to share your thoughts and comments regarding it.
Wishing you success in your trading activities!

Nifty levels - Nov 24, 2023Nifty support and resistance levels are valuable tools for making informed trading decisions, specifically when combined with the analysis of 5-minute timeframe candlesticks and VWAP. By closely monitoring these levels and observing the price movements within this timeframe, traders can enhance the accuracy of their entry and exit points. It is important to bear in mind that support and resistance levels are not fixed, and they can change over time as market conditions evolve.
The dashed lines on the chart indicate the reaction levels, serving as additional points of significance to consider. Furthermore, take note of the response at the levels of the High, Low, and Close values from the day prior.
We hope you find this information beneficial in your trading endeavors.
* If you found the idea appealing, kindly tap the Boost icon located at the bottom right. We encourage you to share your thoughts and comments regarding it.
Wishing you success in your trading activities!

Nifty levels - Nov 23, 2023Nifty support and resistance levels are valuable tools for making informed trading decisions, specifically when combined with the analysis of 5-minute timeframe candlesticks and VWAP. By closely monitoring these levels and observing the price movements within this timeframe, traders can enhance the accuracy of their entry and exit points. It is important to bear in mind that support and resistance levels are not fixed, and they can change over time as market conditions evolve.
The dashed lines on the chart indicate the reaction levels, serving as additional points of significance to consider. Furthermore, take note of the response at the levels of the High, Low, and Close values from the day prior.
We hope you find this information beneficial in your trading endeavors.
* If you found the idea appealing, kindly tap the Boost icon located at the bottom right. We encourage you to share your thoughts and comments regarding it.
Wishing you success in your trading activities!