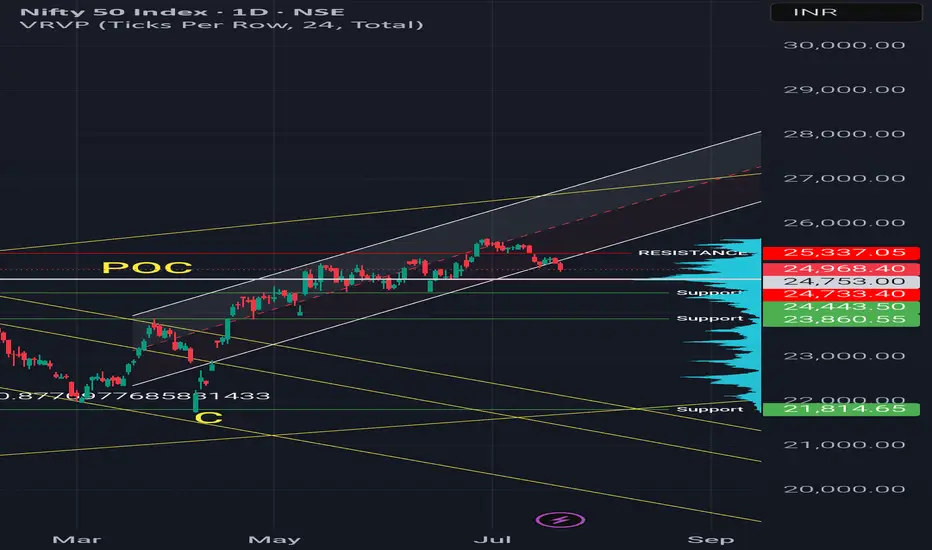
Regression channel breakout - Short term Shift1. Price is out of regression channel — signaling short-term weakness.
2. POC around 24,750 — That is most traded level.
Option Chain Data:
Call writing at 25,300 & 25,500 — clear resistance
But
Yesterday we got positive earnings of ICICI & HDFC Bank.
There is a expectation of pullback as long as nifty is above 24450, long term view is positive
Niftytradesetup
Nifty 50 Intra day setupnifty at 4 hour support
Chart for the reference
~~ Disclaimer ~~
This analysis is based on recent technical data and market sentiment from web sources. It is for informational \ educational purposes only and not financial advice. Trading involves high risks, and past performance does not guarantee future results. Always conduct your own research or consult a SEBI-registered advisor before trading.
# Boost and comment will be highly appreciated.

NIFTY50Nifty could 📉 fall to below level 24850 within 18th July 2025 or to the white line marked on the chart.
Even there's a high possibility that 24850 could break and it could even fall 📉 to below red dashed line 24370 within last week of july 2025.
Disclaimer:
It's a personal view not a financial advice and I assume no responsibility and liability whatever outcome arises.

niftynifty on 2 support zone rising channel and fibbo 60%. nifty may be reverse from here upto 25400. may be on august 1 week. we see nifty 24550-24500 level.

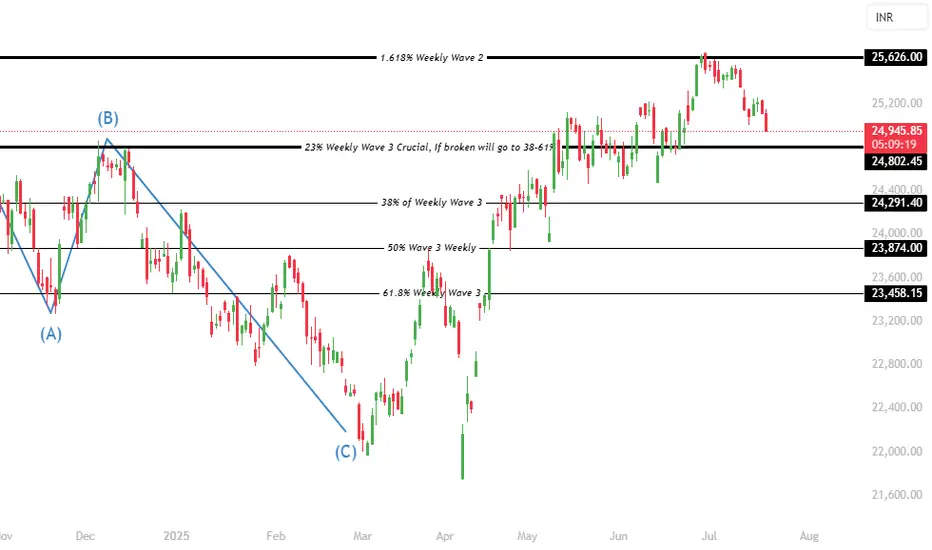
Nifty 50 Trend Analysis A detailed wave analysis in larger times frames indicates that nifty is beginning to trigger a sharp or moderate momentum deep correction. The correction & downtrend can last upto 23874 & 23458 potentially. In a downtrend, institutions will sell on every rise, hence its not the right time to make new investments directly in the stocks. Currently nifty is trading at 25073 and this swing momentum can go upto 24802 without reversals, and 24802 will play a crucial role but since the wave 3 has completed its maximum levels we need to brace for 23874 & 23458.
NIFTY Analysis – 18 july 2025 ,morning update at 9 amTechnical Summary
Daily Candle:
Nifty formed a negative candle after a Doji, indicating potential weakness or indecision turning bearish.
which is a sign of weakness.
Expected Opening:
May open flat near 25143 (critical level).
Upside move possible to 25218, but likely to consolidate.
Key Observation:
If Nifty fails to sustain above 25143, downside possible towards:
25023 (1st support)
24931 (2nd support)
Strategy Advice:
Wait for a clear pattern formation.
Use BOD (Buy on Dip) or SOR (Sell on Rise) strategy.
Scalping preferred due to expected sideways move.
oday's market likely to be range-bound to weak unless strong buying comes above 25143.
Avoid aggressive trades early. Watch for confirmation.
Scalping with tight SL or quick exits is preferred.
What is Sideways or Consolidation?
Sideways market = Price moves between a narrow range without clear direction.
Consolidation = Market takes a pause after a trend (up or down) and moves within a range before the next breakout.
Today's Expected Sideways / Consolidation Range in NIFTY (Spot):
Range Type Price Range (Spot)
Sideways Zone 25143 to 25218
Lower Consolidation Range 25023 to 25143
Expanded Range (if breakout) 24932 to 25278

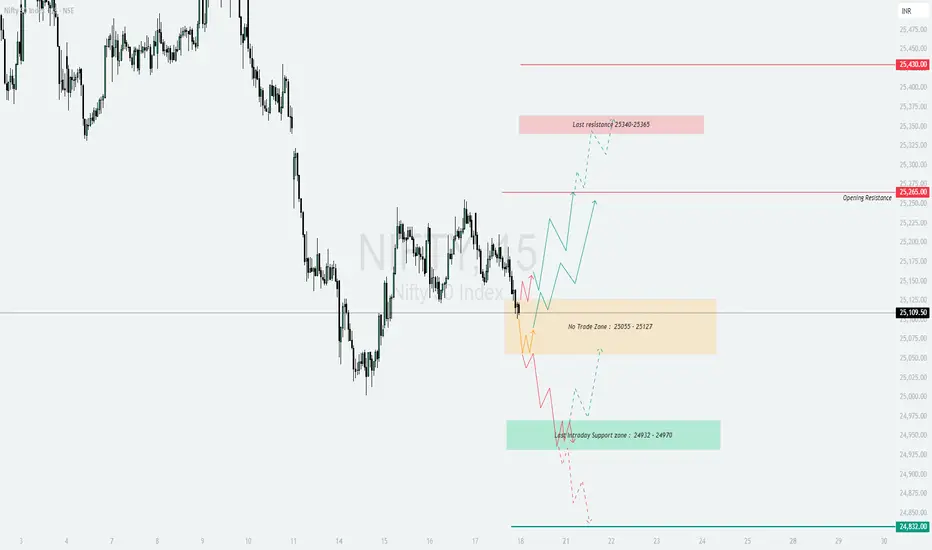
NIFTY - Trading levels and plan for 18-July-2025📊 NIFTY INTRADAY TRADING PLAN – 18-Jul-2025
Gap Opening Consideration: 100+ points from previous close
📍 KEY LEVELS TO MONITOR
🟥 Last Resistance: 25,340 – 25,365
🟥 Major Resistance: 25,430
🟧 Opening Resistance: 25,265
🟨 No Trade Zone: 25,055 – 25,127
🟩 Last Intraday Support Zone: 24,932 – 24,970
🟢 Major Support: 24,832
🚀 SCENARIO 1: GAP-UP OPENING (Above 25,365) 📈
(Gap-up considered as 100+ points above previous close)
If Nifty opens above 25,365 , it indicates bullish strength. Wait for a pullback near 25,340–25,365 for potential long entries.
If price sustains, expect a possible rally toward 25,430+ , which is the next resistance zone.
Avoid chasing entries; use 15–30 min candle confirmation to avoid false breakouts.
Options Strategy: Focus on ATM or slightly OTM Call Options or try a Bull Call Spread for limited risk.
⚖️ SCENARIO 2: FLAT OPENING (Between 25,055 – 25,127) 🟠
(Flat range aligns with the No Trade Zone )
This is a tricky zone with indecision between bulls and bears. Avoid initiating any trade immediately.
If Nifty breaks and sustains above 25,127 , bullish bias may emerge toward 25,265 – 25,340 .
On breakdown below 25,055 , a short trade setup opens targeting 24,932 – 24,970 zone .
Wait for clear hourly close before taking action in either direction.
Options Strategy: Consider Strangle or Iron Fly strategies for range-based volatility exploitation.
📉 SCENARIO 3: GAP-DOWN OPENING (Below 24,932) 🚨
(Gap-down considered below previous close by 100+ points)
If Nifty opens below 24,932 , monitor price action near the 24,832 major support .
If the support fails and prices break down below 24,832 , expect further downside pressure.
However, if price finds buying interest at 24,832 and bounces, you may consider scalping long with tight stop loss.
Options Strategy: Deploy ATM or ITM Put Options or Bear Put Spreads to play downside with defined risk.
💡 RISK MANAGEMENT & OPTIONS TRADING TIPS
🛑 Never risk more than 1–2% of your capital on any single trade.
⏳ Avoid entering trades during the first 15–30 minutes ; let volatility settle.
📉 Use Hourly candle close to determine validity of breakouts/breakdowns.
⚖️ Prefer spread strategies like Bull Call or Bear Put to cap your risk.
🧠 Avoid revenge trading after losses—stick to your trading plan.
📌 SUMMARY & CONCLUSION
Bullish View: Above 25,365, look for long opportunities up to 25,430 with stop-loss below 25,340.
Range-Bound View: Between 25,055–25,127 (No Trade Zone) – wait for breakout/breakdown confirmation.
Bearish View: Below 24,932 – focus on support at 24,832; breach can accelerate fall.
Action Plan: Wait for price behavior near key levels before committing capital.
⚠️ DISCLAIMER: I am not a SEBI-registered analyst. This analysis is for educational and informational purposes only. Please consult your financial advisor before taking any trade or investment decisions.
Nifty may nosedive from here! So that missing piece - closing above 25200 - we lost again.
Reason - FIIs are taking out cash from Indian market as per data.
Why? Because they sense many big companies might report negative earning - hence index trading is not suitable for them.
During Quarterly Earning Season, promoters shift their money from one to another. Mutual funds rebalance their portfolio from weak to stronger. And Institutional Money like FII don't like surprises on their positions. They go with the plan.
If I would have been the FII, what I would be doing is - wait for the earnings to announced and then see which companies have given great results and which have their sales increased. Then, after the Earning Season is over, I'll re-position myself with clean charts. Avoid any volatality. Any surprises.
So that's why they are doing exactly.
Because of that, maybe your setups won't work like they do in usual condition. So if you feel you're getting stuck or Stoloss hitting more than normal, dont be surprised.
A good practice would be to stay away from trading for while and let the market settle for a bounce back.
However, I'm a professional trader and I need to earn in any market condition. Hence I have strategy for every situation.
Me and my students use Earning Pivot to give ourselves an edge against unpredictable market structure during Earning Seasons.
So this would be wise to stick to this setup only for a time being.
Coming to the market, NSE:NIFTY has given a Supply candle today with sellers outnumbering buyers by 93 million volume.
Now if 25000 is broken we can see a deeper cut in the index. Maybe near 24750.
However, the immediate support is at 24980. Resistance now at 25155.
If we get a bounce to this, we can build a short position. Yeah, from now on market might turn on Sell-on-Rise mode.
NSE:BANKNIFTY short term support formed at 56050. Resistance 56965.
Many IPO stocks are showing good strength with bullish structure. Hence I will be focusing there.
Today I traded just one stock and also given here to all of you and that hit Upper Circuit. Remember it was from IPO sector. Name is GETTEX:NSE :#IXIGO.
Traded NSE:ANANDRATHI as Intraday and got 4% upside in that as well. So overall the day ended in positive note for our community. Cheers on that!
That would be all for today. Take care. Have a profitable day ahead.

NIFTY : Trading plan and levels for 17-July-2025📊 NIFTY INTRADAY TRADING PLAN – 17-Jul-2025
200+ Points Gap Opening Considered Significant | Educational Structured Trading Plan
📍 KEY ZONES & LEVELS TO MONITOR
🟥 Opening Resistance Zone: 25,376 – 25,340
🔴 Last Intraday Resistance: 25,430
🟧 Opening Support Zone: 25,083 – 25,102
🟩 Last Intraday Support Zone: 24,932 – 24,970
🚀 SCENARIO 1: GAP-UP OPENING (Above 25,376) 📈
If NIFTY opens above 25,376 with 100+ points gap-up, expect buyers to dominate initially, pushing towards 25,430 (Last Intraday Resistance) .
Avoid aggressive longs exactly at the open. Let the first 15-minute candle settle to confirm strength.
If price sustains above 25,430 with volume, look for further upside, but be mindful of exhaustion near round numbers.
Options Tip: Prefer ATM Call Options with tight stop-loss or Bull Call Spread to manage risk better.
📊 SCENARIO 2: FLAT OPENING (Between 25,102 – 25,376) ⚖️
This range marks the consolidation area between Opening Support and Opening Resistance Zone .
Price behavior here is crucial for intraday direction bias.
If price holds above 25,224.40 post-open, bias is slightly bullish towards the Resistance Zone.
If price breaks below 25,102 , sellers may drag it towards Last Intraday Support 24,932 – 24,970 .
Options Tip: Consider Iron Fly or Strangle setups if premiums are attractive. Be patient for breakouts.
📉 SCENARIO 3: GAP-DOWN OPENING (Below 25,083) ⚠️
If NIFTY opens below 25,083 with 100+ points gap-down, expect weakness to persist.
Primary downside target becomes Last Intraday Support Zone: 24,932 – 24,970 .
Sell-on-rise strategy is preferred after 15-minute candle confirmation below 25,083 .
Options Tip: Focus on ATM or ITM Put Options or use Bear Put Spreads for safer execution.
💡 RISK MANAGEMENT TIPS FOR OPTIONS TRADERS
📏 Always risk only 1–2% of total capital per trade.
⏳ Avoid trades during the first 15–30 minutes to let volatility settle.
🔐 Respect Hourly Candle Close stops rather than reacting to wicks.
⚖️ Prefer Spreads and Hedged Strategies in highly volatile or uncertain conditions.
🚫 Avoid over-leveraging especially in expiry week or event-heavy days.
📌 SUMMARY & CONCLUSION
Bullish Bias: Gap-up above 25,376 → Target 25,430
Neutral Range: Between 25,102 – 25,376 → Wait for breakout confirmation
Bearish Bias: Gap-down below 25,083 → Target 24,932 – 24,970
Trade with a calm mindset, respecting the levels and waiting for candle confirmations to reduce false entries.
⚠️ DISCLAIMER: I am not a SEBI-registered analyst. This plan is purely for educational and informational purposes. Always consult your financial advisor before making any investment decisions.

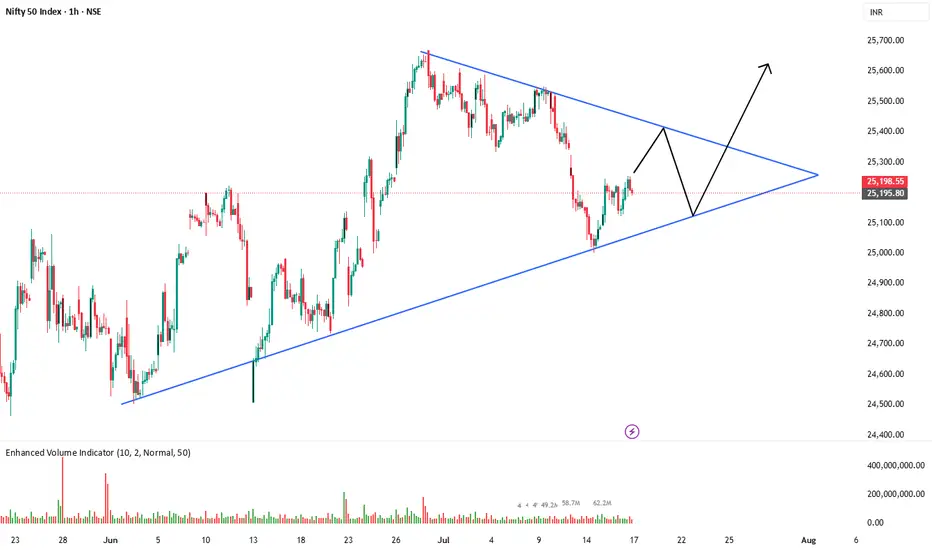
Nifty 50 - Symmetrical Triangle Breakout WatchNifty is currently consolidating within a symmetrical triangle pattern on the 1-hour chart. Price is respecting both the rising support and descending resistance trendlines.
Key observations:
Clear higher lows indicate underlying bullish pressure.
Lower highs show selling pressure near resistance.
Expecting a possible pullback toward the lower trendline before a potential breakout to the upside.
Trade Plan (if breakout occurs):
📈 Bullish breakout above the upper trendline could lead to a sharp rally.
✅ Confirmation needed with strong volume and candle close above resistance.
Invalid if price breaks below the support trendline.
Stay alert for a breakout or breakdown — both scenarios possible, but current structure slightly favors bulls.
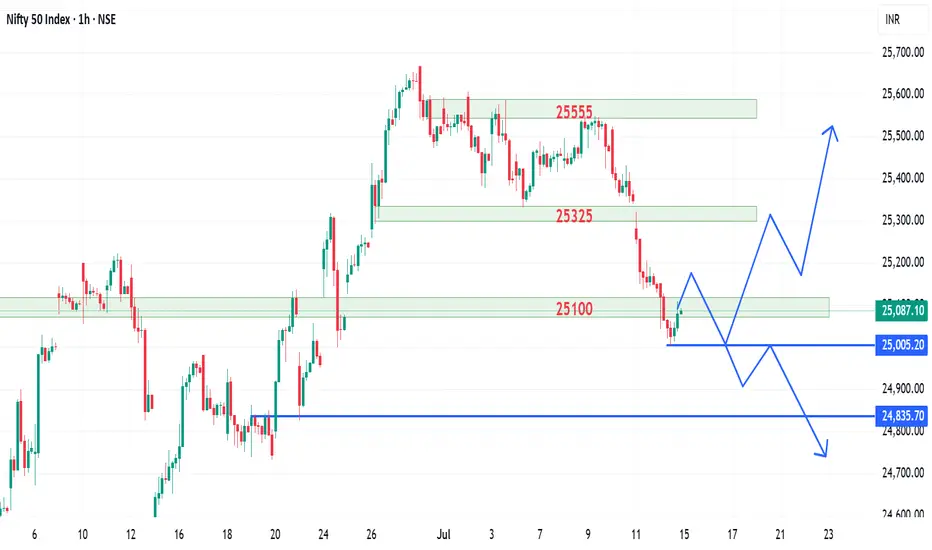
Nifty Holds Positive Trend, BankNifty Eyes New High - Key LevelsThe missing piece we talked about yesterday — a close above 25200 — is now complete.
Selling pressure has reduced, although we didn’t get the strong follow-up buying we expected.
But from a trading perspective, today was superb:
- NSE:SPORTKING , which we bought yesterday, gained another 7% today.
- NSE:EDELWEISS intraday setup delivered a solid 6% move.
- NSE:TATAPOWER ATM options shot up by 100%.
- As mentioned in yesterday’s commentary, NSE:CNXPSUBANK performed well — I’m holding NSE:BANKBARODA and had added #SBIN a few days back.
- NSE:SHYAMMETL closed strong today; I’ve taken it as a positional trade.
- I exited NSE:CUPID today and replaced it with $NSE:MOBIKWIK.
In total, I’m holding 4 open positions, and I’ll continue to hold them until they overextend.
Coming to the market:
Nifty formed a Supply Candle today as sellers’ volume was 33 million higher than buyers.
The positive takeaway is that selling pressure has eased, and the trend has moved back to the positive zone.
Considering these conditions, tomorrow is likely to remain sideways.
NSE:NIFTY levels for tomorrow:
- Resistance: 25250 — a close above this could trigger short covering up to 25500
- Support: 25155
BankNifty looks stronger than Nifty and seems ready for a new all-time high.
NSE:BANKNIFTY levels for tomorrow:
- Support: 57000
- Resistance: 57300 — a breakout above this can push it to fresh highs
Sector-wise, #PSUBANKS remained the strongest today.
That’s all for today.
Take care.
Have a profitable tomorrow.

NIFTY : Trading plan for 16-Jul-2025📊 NIFTY 50 INTRADAY TRADING PLAN – 16-Jul-2025
Strategy prepared with 15-Min chart observation. Gap openings 100+ points considered significant for intraday volatility.
📍 IMPORTANT LEVELS TO WATCH
🟥 Opening / Last Intraday Resistance: 25,340
🟧 Opening Resistance / Support Zone: 25,225
🟧 Opening Support: 25,132 – 25,150
🟩 Last Intraday Support: 25,053
🟩 Buyer’s Support Zone: 24,950 – 24,981
🟥 Profit Booking Zone: 25,408 – 25,430
🚀 SCENARIO 1: GAP-UP OPENING (Above 25,340) 📈
If NIFTY opens above 25,340 , it indicates a strong bullish sentiment. However, watch for immediate profit booking around the Profit Booking Zone 25,408 – 25,430 .
Do not rush into trades immediately. Wait for a 15-minute candle close above 25,340 to confirm continuation.
If it fails to hold 25,340, there can be a quick dip toward 25,225 again.
Options Tip: Prefer ATM or Slightly ITM CE for momentum continuation. Avoid far OTM options due to theta risk on gap-up days.
📊 SCENARIO 2: FLAT OPENING (Between 25,132 – 25,225) 🔄
A flat opening suggests an indecisive mood. Watch how prices behave around Opening Resistance 25,225 and Opening Support 25,132 – 25,150 .
If price sustains above 25,225 with good volume, expect a bullish move toward 25,340 .
If price breaks and sustains below 25,132 , expect weakness toward 25,053 or even 24,950 – 24,981 .
Options Tip: Use ATM Straddles/Strangles if market consolidates between 25,132 – 25,225 for premium decay setups.
📉 SCENARIO 3: GAP-DOWN OPENING (Below 25,053) ⚠️
A gap-down opening below 25,053 creates immediate bearish pressure. First downside support to monitor is 24,950 – 24,981 (Buyer’s Support Zone) .
If this zone holds, expect reversal buying with a stop-loss below 24,950 .
If 24,950 breaks, avoid fresh longs. Downtrend extension possible below this zone.
Options Tip: On gap-down days, prefer Bear Put Spreads or ATM Put Options for controlled risk instead of buying far OTM PEs.
💡 RISK MANAGEMENT TIPS FOR OPTIONS TRADERS
Risk only 1–2% of your capital per trade.
Avoid chasing prices in the first 15 minutes after the opening bell.
Prefer ATM/ITM options for directional trades.
Always mark Stop Loss and Stick to it strictly.
Control position sizing—don’t over-leverage on gap opening days.
📌 SUMMARY & CONCLUSION
Bullish Scenario: Above 25,340 → Target 25,408–25,430.
Range-Bound Scenario: Between 25,132 – 25,225 → Watch consolidation before acting.
Bearish Scenario: Below 25,053 → Target 24,950–24,981.
Always stay disciplined with entries and exits. Risk control should be your primary focus as an options trader.
⚠️ DISCLAIMER: I am not a SEBI-registered analyst. This trading plan is shared purely for educational purposes. Please do your own analysis or consult a certified financial advisor before acting on this information.

Pivot Low Formed, Follow-Up Buying Crucial – Nifty and BankniftyYesterday, i mentioned that sellers’ volume was 40 million higher than buyers, and for a new trend to emerge, today’s candle needed to absorb that supply.
And look what happened — today, buyers’ volume surpassed sellers’ by 82 million.
All the setups I traded today blasted exactly as expected:
NSE:SWARAJENG (Earnings Pivot) – +10%
NSE:SPORTKING – +5.92%
NSE:MOBIKWIK – +4.16%
For the short term, I am still holding NSE:CUPID , which has already given a 22% move in the last 3 sessions since my entry!
Now, coming to today’s market action:
NSE:NIFTY formed a Demand Candle today, and along with that, a Pivot Low has also been created.
The only missing piece is that the index hasn’t yet closed above 25200.
The message is clear — if we get follow-up buying tomorrow, the index could be ready for a fresh high.
For tomorrow:
Resistance: 25244 — once crossed, short covering can push it directly to 25350/25500.
Support: will be at 25180.
NSE:BANKNIFTY looks more positive, and this time, NSE:CNXPSUBANK could be the key driver.
For BankNifty:
- Support: 56965
- Resistance: 57260 — a close above this could trigger a move towards a new high.
Talking about sector rotation — in the short-term timeframe, a new sector has emerged: NSE:NIFTY_CONSR_DURBL
NSE:NIFTY_IPO stocks remain strong, and for intraday trades, NSE:CNXAUTO and NSE:NIFTY_EV stocks are at the top of the list. So if you’re planning tomorrow’s intraday trades, focus on these sectors.
That’s all for today.
Take care.
Have a profitable tomorrow.
Market Analysis and Nifty AnalysisIn this video, I have provided an overall market analysis. :
Although the market is green today, it's important to stay cautious.
Small caps are forming range-bound bullish engulfing candles, but we need to wait for the closing.
Nifty continues to form lower lows on the lower time frame. A reversal can be confirmed once strength appears on the lower time frame and is reflected in the daily chart.

NIFT : INTRADAY TRADING PLAN – 15-Jul-2025📊 NIFTY 50 INTRADAY TRADING PLAN – 15-Jul-2025
Planned according to the provided chart, focusing on Gap Opening 100+ points scenarios
💡 Previous Close: 25,067.10
⏱️ Timeframe: 15-Min Chart
⚙️ Gap Opening Threshold: 100+ Points considered significant
📍 IMPORTANT LEVELS
🟥 Last Intraday Resistance: 25,340
🟥 Opening Resistance: 25,210
🟧 Opening Support Zone: 24,949 – 25,020
🟩 Last Intraday Support: 24,949
🟩 Buyer's Support: 24,774
🚀 SCENARIO 1: GAP-UP OPENING (Above 25,210) 📈
If Nifty opens above 25,210 , it directly enters the resistance zone. Caution: Do not buy blindly on a gap-up as there is a risk of profit booking.
Wait for a 15-minute candle to close above 25,210 for confirmation. Post-confirmation, upside targets are 25,340 and possibly higher.
Failure to hold above 25,210 can lead to a quick reversal towards the Opening Support Zone 24,949 – 25,020 .
Options Tip: Prefer ITM CE options for momentum continuation. Avoid far OTM on gap-ups to manage theta decay risk.
📊 SCENARIO 2: FLAT OPENING (Between 25,020 – 25,210) 🔄
Flat openings near these levels suggest a balance between bulls and bears. Observe price behavior carefully in the first 15–30 minutes.
A sustained move above 25,210 opens room for bullish continuation up to 25,340 .
Failure to hold Opening Support 24,949 indicates weakness. Below this, prices can drift toward the Buyer's Support 24,774 .
Options Tip: Avoid buying options immediately after a flat open. Monitor structure. Focus on ATM Straddles/Strangles for premium selling if prices remain range-bound.
📉 SCENARIO 3: GAP-DOWN OPENING (Below 24,949) ⚠️
Gap-down below 24,949 brings immediate focus on Buyer's Support 24,774 .
If this zone holds, look for reversal buying opportunities with stop-loss below 24,774 .
A breakdown below 24,774 may trigger a larger downside. Be conservative in this scenario; wait for retest/rejection candles.
Options Tip: IV spike expected. Prefer Bear Put Spreads instead of naked PEs to manage risk and avoid premium erosion on rebounds.
💡 RISK MANAGEMENT TIPS FOR OPTIONS TRADERS
Stick to maximum 1–2% risk of total capital per trade.
Always observe the first 15–30 minutes before trading aggressively.
Use ATM/ITM strikes to control theta decay.
Respect key support/resistance zones. Do not overtrade.
Avoid chasing prices; let the market confirm direction post-gap.
📌 SUMMARY & CONCLUSION
Bullish Zone: Above 25,210 → Target 25,340.
Range Zone: 25,020 – 25,210 → Watch for structure clarity.
Bearish Zone: Below 24,949 → Target 24,774.
Trade mindfully and focus on capital preservation before chasing profits.
⚠️ DISCLAIMER: I am not a SEBI-registered analyst. This trading plan is shared for educational purposes only. Please do your own research or consult a qualified financial advisor before trading.

July is Historically a Bullish Month for NiftySaid earlier that NSE:NIFTY could pull back till 25000 and then bounce. And that's exactly what happened.
The quarterly rotation in the market seems to have completed. And today, supply started getting absorbed.
I’ve already mentioned before — July has historically been a positive month for the markets, and that view still stands.
The outlook remains bullish.
Today’s candle in Nifty is a demand candle — it has absorbed nearly half of the selling pressure.
However, the remaining supply is still there, since sellers outnumbered buyers by around 40 million today.
So we’ll turn aggressive only if tomorrow’s early session absorbs this supply.
Ideally, the first hourly candle should take care of it. If that happens, strong momentum can follow.
Otherwise, Nifty might just consolidate for a bit.
Intraday levels for tomorrow:
- Support: 25044
- Resistance: 25202
If 25202 breaks, direct upside target is 25350.
Coming to NSE:BANKNIFTY — today’s candle is indecisive.
If strong momentum doesn’t follow soon, it could drop again.
So it’s important for BankNifty to close above 57098 within the first hour tomorrow.
Support zone will be around 56590.
Talking about sector rotation — NSE:CNXMEDIA topped the charts today. So special focus should be there for intraday trades.
That said, short-term leadership is still with IPOs, Pharma, and Realty sectors.
Right now is the best time to identify quality breakout stocks.
But remember, you also need a solid position management strategy.
Most traders make the mistake of exiting too early in bull markets with small profits — that’s greed.
In bull phases, the goal should be to ride the trend. Don’t follow feelings. Follow your setup.
Stocks like NSE:HPL and NSE:DBREALTY are showing great setups.
Study these setups carefully. Learn from them. Never blindly copy others.
That’s all for today.
Take care.
Have a profitable day ahead.

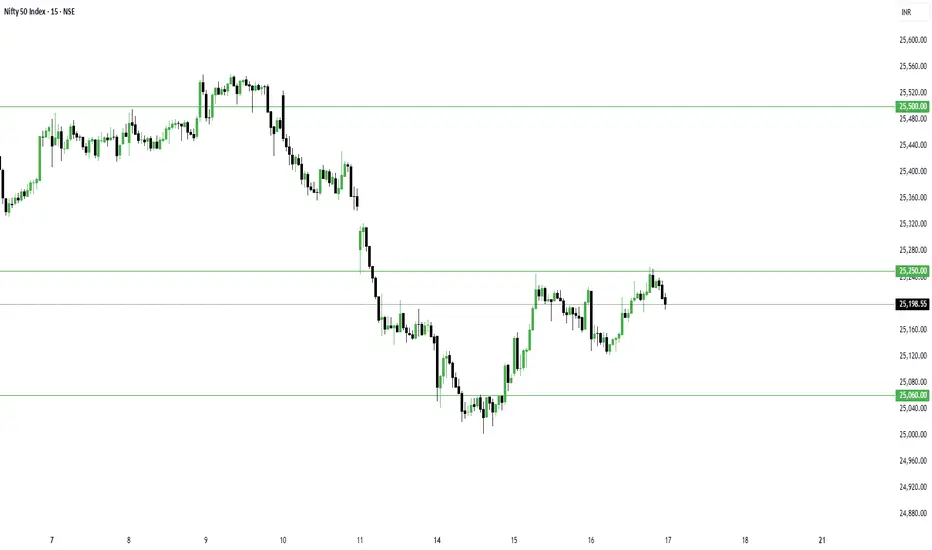
Nifty possible movement for the upcoming trading session.Nifty closed around the support zone forming a long lower tail showing some bullishness today.
Though the market has moved after a long time and can move on the either side.
Levels are marked and possible movements are also plotted.
Wait for the price action and trade accordingly.
NIFTY : Trading levels and Plan for 14-Jul-2025b]📊 NIFTY 50 INTRADAY PLAN – 14 JULY 2025 (15-Min Chart Study)
Educational insights for all opening scenarios: Gap-Up, Flat, and Gap-Down.
📍 Previous Close: 25,140.55
📌 Gap opening threshold considered: 100+ points
⏱️ Tip: Let the first 15–30 minutes settle before entering trades based on levels.
📌 KEY LEVELS TO MONITOR
Resistance Zone: 25,460
Last Intraday Resistance: 25,318
Opening Support / Resistance Zone: 25,247
Opening Support / Resistance Zone: 25,152 – 25,123
Last Intraday Support Zone: 25,088 – 25,050
🚀 SCENARIO 1: GAP-UP OPENING (Above 25,247) 📈
Bias: Bullish continuation possible
If Nifty opens above 25,247 , watch for continuation towards 25,318 (Last Intraday Resistance) .
Sustainable strength above 25,318 can lead to 25,460 . That’s the upper profit booking zone.
If price shows exhaustion candles near 25,460, avoid fresh longs. Instead, look for selling opportunities with tight stop-loss.
Options Traders: Prefer ATM or slightly ITM calls; avoid chasing far OTM CE after gap-up. Time decay will be sharp in such cases.
📊 SCENARIO 2: FLAT OPENING (Near 25,140 – 25,152) 🔄
Bias: Neutral-to-bearish bias
If the market opens around 25,140 – 25,152 , focus on whether the 25,152 – 25,123 zone holds as support or flips as resistance.
If price holds above 25,152, there’s potential for a bounce towards 25,247.
If price breaks and sustains below 25,123, expect a gradual drift towards the Last Intraday Support: 25,088 – 25,050 .
Avoid quick trades here — observe the first 30 minutes’ range before committing capital.
📉 SCENARIO 3: GAP-DOWN OPENING (Below 25,050) ⚠️
Bias: Bearish with bounce attempt from lower supports
If Nifty opens below 25,050 , immediate attention should be given to Last Intraday Support: 25,088 – 25,050 .
If that zone breaks, next major support becomes psychological round numbers or extreme supports which may form intraday.
Aggressive selling should only be considered if prices show no reaction around this zone. Watch for hammer or reversal patterns before taking contra long trades.
Options Traders: Avoid buying deep OTM puts after a large gap-down as premiums often get inflated due to IV spikes.
💡 OPTIONS TRADING – RISK MANAGEMENT TIPS
Focus on ATM or ITM strikes to reduce theta impact on both CE and PE buying.
Apply Stop-Loss based on 15-minute candle closes instead of absolute price ticks to avoid noise.
If VIX is high, hedge with vertical spreads instead of naked options buying.
Strictly maintain a 1–2% max risk of your capital per trade.
Avoid over-trading after 2:45 PM as theta erosion accelerates in options.
Keep tracking Bank Nifty as well for broader market cues.
📌 SUMMARY & CONCLUSION
Bullish Trigger: Above 25,247 → Target 25,318 – 25,460
Neutral Zone: 25,140 – 25,152 → Wait and watch zone
Bearish Trigger: Below 25,123 → Watch 25,088 – 25,050 for bounce
Keep your discipline intact and avoid emotional trades.
Options premium decay is real — always respect time and structure.
⚠️ DISCLAIMER: I am not a SEBI-registered analyst. This trading plan is for educational purposes only. Please do your own analysis or consult with a financial advisor before making trading decisions.
Nifty ready to Bounce As mentioned in Friday’s commentary — a gap-down was expected in NSE:NIFTY , and that’s exactly what we saw.
I highlighted that the gap-down could happen below 25285 — and the market opened at 25255.
A bounce was expected near 25333 — and the bounce actually came, up to 25322.
It was clearly stated that selling should be done on bounce — and from there, the market dropped nearly 180 points from the high.
In short — the analysis played out exactly as planned.
Now, since everything is moving as per plan, it would be incorrect to assume that the market has turned bearish.
The Nifty chart is simply indicating that due to the earnings season, institutional money is rotating from one set of stocks to another.
So, this is not a downtrend or a selloff — it’s just a basic quarterly rotation which mutual funds are required to do every quarter as part of their rule-book.
Funds are being booked from run-up or overbought stocks, and re-invested into undervalued stocks — stocks that are now setting up for a fresh move and belong to stronger indices or sectors.
✅Your focus should be on spotting such stocks and sectors early.
Now, coming to Friday’s Nifty candle — it’s showing a bullish hidden divergence.
Which means — there’s a high probability of a strong bounce.
However, there’s a caution: the first one hour of the market might remain sideways or slightly bearish.
So avoid early entries — wait for a clear bounce signal.
Let’s talk about the key technical levels:
Resistance: 25225 — once crossed, the next resistance is at 25350.
Support: 25125 — if this breaks, index may fall to 25071, and further to 24955 if pressure continues
The time-wise correction seems almost complete — and next week looks promising for a solid move.
Sector-wise, IPOs, Healthcare, FMCG, and Pharma are currently showing the most strength.
Speaking of NSE:BANKNIFTY — it has already shown the first sign of bounce by holding support at 56600. Immediate resistance is at 56900.
From today, you can start scanning for strong breakout stocks — like NSE:HPL
That’s all for today’s commentary.
Take care. Have a profitable tomorrow.

NIFTY INDEX INTRADAY LEVELS ( EDUCATIONAL PURPOSE ) 11/07/2025📈 Nifty 50 Index Intraday Trade Plan – 11 July
🕒 Analysis on 15-min | Trades on 1-min TF
🔍 Market Context:
Nifty is approaching key support zone near 25,340–25,350
If broken, downside momentum expected
If it holds, intraday bounce possible
🟢 BUY Setup (Bounce from Support Zone)
✅ BUY above 25,365
🎯 Target 1: 25,410
🎯 Target 2: 25,450
🛑 Stop Loss: 25,330
🔎 Entry Trigger: Bullish engulfing or strong 1-min green candle after bounce
🔴 SELL Setup (Breakdown of Support)
✅ SELL below 25,330
🎯 Target 1: 25,280
🎯 Target 2: 25,240
🛑 Stop Loss: 25,365
🔎 Entry Trigger: Volume spike on breakdown; avoid first red candle trap
⚠️ Flat Opening (Between 25,340–25,365)
🔄 Range Play until breakout
🔁 Buy dips at 25,340 with SL: 25,320
🔁 Sell rallies near 25,400–25,420 with SL: 25,440
⚙️ 1-Min Scalping Tips
🕔 Wait 5 mins post market open
🚫 Avoid trading in first 1–2 candles unless breakout/breakdown confirmed
🔍 Volume + structure-based confirmation needed
📊 Follow strict 1:2 risk-reward ratio
We Might See 25000 Level Testing in Nifty Today's price action in NSE:NIFTY formed a classic Supply Candle—indicating strong seller dominance with hardly any buying interest throughout the session.
Heading into tomorrow, we are likely to witness one of two potential scenarios:
Scenario 1:
We may open with a gap-down, driven by the pressure of today’s supply. If that happens, expect the opening to be below 25285.
In this case, avoid buying the dip. Instead, look to sell on any intraday bounce near 25333.
Scenario 2:
Alternatively, we could see a mild gap-up due to call unwinding, triggered by the emergence of a new resistance zone.
If the index approaches 25400, that will be a strong supply area. In such a scenario, look to initiate short positions near 25400 with a stop-loss around 25433 (on hourly closing basis).
Also, keep an eye on 25222. If we bounce from this level in the second half, it would suggest strength returning for the coming week.
However, a failure to hold this support and a close below it could push us towards the 25000 mark.
NSE:BANKNIFTY also continues to show weakness. Immediate support is around 56700, while resistance stands at 57100.
With earnings season underway, this is a crucial time to focus on the Earning Pivot strategy.
Stay selective—only trade setups with strong earnings-backed pivots.
On the sectoral front, Power continues to lead. I traded NSE:HPL today which still looks good.
Next in line are NSE:CNXFMCG and #SUGAR—both sectors showing early signs of strength.
Let me remind you—chaos often breeds the best opportunities. Use this phase to curate your watchlist for the next leg of the rally.
That will be all for today. Trade smart and have a profitable tomorrow.
NIFTY: Trading levels and plan for 11-Jul-2025📈 NIFTY INTRADAY PLAN – 11 JULY 2025 (15-min TF)
A level-based, educational breakdown to help traders plan trades across opening scenarios.
📍 Previous Close: 25,348.25
📊 Consider 100+ points for Gap classification
⏱️ Pro Tip: Allow first 15–30 mins of price action to settle and confirm direction before entering trades.
📌 KEY ZONES TO MONITOR
Resistance for Sideways: 25,574 – 25,605
Last Intraday Resistance: 25,506
Opening Resistance for Sideways: 25,439
Opening Resistance/Support Zone: 25,377
Opening Support Zone: 25,288 – 25,311
Buyer's Support Zone (Must Try Zone): 25,221 – 25,246
🚀 SCENARIO 1: GAP-UP OPENING (Above 25,439)
Bias: Bullish but expect sideways to resistance at higher zones
If Nifty opens above 25,439 , it may retest the Last Intraday Resistance: 25,506 quickly.
Sustainable strength above this level can lead to the upper resistance zone between 25,574 – 25,605 , where profit booking is expected.
Avoid fresh CE buying if prices reach the top resistance zone too quickly after open – wait for price cooling or consolidation.
On sharp gap-up days, wait for a pullback to 25,439 to see if it acts as support before continuing higher.
📊 SCENARIO 2: FLAT OPENING (Near 25,348 – 25,377)
Bias: Neutral-to-bearish depending on early structure
If Nifty opens flat between 25,348 – 25,377 , it may face immediate selling pressure.
Support lies around 25,288 – 25,311 ; bulls will try to defend this zone.
Breakdown below this zone can trigger a drift toward Buyer’s Support Zone: 25,221 – 25,246 , which is ideal for reversal trades.
Look for strong reversal candles like hammer or engulfing patterns at buyer's zone to take call side trades.
📉 SCENARIO 3: GAP-DOWN OPENING (Below 25,288)
Bias: Bearish with potential buy-on-dip opportunities
If Nifty opens below 25,288 , initial support comes in the Buyer’s Support Zone: 25,221 – 25,246 .
Watch for price reaction here – if bulls defend this zone, expect a sharp bounce-back move.
If this zone is breached with volume, don’t force counter-trades – wait for re-entry signals above 25,246 again.
On the bounce, target toward 25,311 – 25,377, but trail stop as we approach resistance.
💡 OPTIONS TRADING – RISK MANAGEMENT TIPS
Use ATM or ITM options to reduce the impact of time decay, especially in sideways zones.
Avoid trading aggressively in the first 5-minute candle — let price structure settle.
Stick to 15-min candle SL closing logic to reduce false stop-outs.
Avoid buying both CE & PE (straddle) blindly on volatile days — pick a side with confirmation.
If VIX is high, consider hedged strategies like spreads.
Secure profits early after 2:30 PM – avoid fresh entries late unless very high conviction.
📌 SUMMARY & CONCLUSION
Bullish Pathway: Above 25,439 with target toward 25,605
Neutral Zone: 25,348 – 25,377 (watch for confirmation)
Bearish Trigger: Below 25,288, eyes on reversal from 25,221 – 25,246
Observe volume, candle structure, and overall market tone to validate bias
Discipline and execution with risk control are more important than direction
⚠️ DISCLAIMER: I am not a SEBI-registered analyst. This analysis is for educational purposes only. Please consult your financial advisor before taking trades.