What is database trading ?**Database trading** refers to the use of databases to store, analyze, and manage large volumes of financial market data to inform trading strategies and decisions. Traders, especially quantitative and algorithmic traders, rely heavily on databases to organize and manipulate market data such as stock prices, volume, economic indicators, and other financial metrics. By using database-driven systems, traders can access vast amounts of data quickly, perform complex analyses, and backtest strategies.
### **How Database Trading Works**:
1. **Data Collection and Storage**:
- In database trading, market data is collected from various sources such as exchanges, financial reports, and APIs. This data includes price histories, order book information, trading volume, technical indicators, news sentiment, and more.
- The data is stored in **databases** (such as relational databases like **MySQL**, **PostgreSQL**, or NoSQL databases like **MongoDB**) where it can be structured for easy retrieval, querying, and analysis.
2. **Data Analysis**:
- Traders use databases to organize and query market data. For example, a trader might query the database to retrieve historical price data for a specific asset, calculate moving averages, or identify patterns.
- Advanced analysis is typically carried out using tools like **SQL** for querying databases, and **Python**, **R**, or **MATLAB** for data manipulation, statistical analysis, and developing trading algorithms.
3. **Backtesting**:
- One of the key uses of databases in trading is **backtesting**. Traders use historical data stored in databases to test their trading strategies. They can simulate how a strategy would have performed in the past by applying it to the data and calculating metrics like returns, risk, and drawdowns.
- **Backtesting engines** often pull data from databases and execute simulated trades based on the historical market conditions stored in the database.
4. **Real-Time Data Processing**:
- Some database systems, especially when integrated with **real-time market data feeds**, allow traders to monitor live market conditions and execute trades automatically based on predefined algorithms.
- Databases play a critical role in storing and processing real-time data, ensuring that algorithms can access up-to-date information and respond to market movements promptly.
5. **Machine Learning and AI**:
- **Machine learning algorithms** can be applied to the data stored in databases to identify trends, correlations, or anomalies that can inform trading decisions.
- Traders can use databases to train models on historical data and then deploy these models in live markets to predict price movements or optimize strategies.
---
### **Why Database Trading is Important**:
1. **Efficient Data Management**:
- Financial markets generate massive amounts of data every second. Databases allow traders to **store, organize, and retrieve** this data efficiently, even when dealing with vast datasets across multiple assets and timeframes.
2. **Scalability**:
- Databases can handle **large datasets** with millions of data points. This is crucial for traders who require a scalable solution to process high-frequency trading data, tick-level data, or large historical datasets.
3. **Speed and Accessibility**:
- Trading systems need to be fast, particularly in high-frequency or algorithmic trading. Databases provide a structured and efficient way to store and query data, ensuring that traders can access the data they need quickly to make real-time trading decisions.
- **Low latency** is especially important when trading in fast-moving markets where decisions must be made in fractions of a second.
4. **Backtesting and Strategy Optimization**:
- The ability to backtest trading strategies with historical data is one of the core advantages of database trading. Traders can assess the viability of their strategies over different market conditions before applying them in live trading.
- This allows for **strategy optimization** by tweaking parameters and testing different variations of a strategy to find the most effective approach.
5. **Data Integrity and Accuracy**:
- Databases provide mechanisms for ensuring the **integrity** and **accuracy** of data, which is crucial for making reliable trading decisions. Traders can perform thorough data validation and cleaning before using the data in their models.
6. **Data-Driven Decision Making**:
- Database trading enables **data-driven decision-making** by providing traders with the ability to analyze and interpret large sets of financial data. This minimizes emotional decision-making and helps traders make rational, systematic choices.
---
### **Types of Data Used in Database Trading**:
1. **Market Data**:
- **Price data**: Historical and real-time price information for various assets (stocks, options, forex, etc.).
- **Volume data**: Data related to the number of shares or contracts traded.
- **Bid/Ask data**: The best available prices for buying (bid) and selling (ask) an asset at a given time.
- **Order book data**: Information about the orders waiting to be executed in the market.
2. **Fundamental Data**:
- **Earnings reports**, **balance sheets**, and **cash flow statements** of companies.
- **Economic indicators** such as GDP growth, inflation, interest rates, and employment numbers.
3. **Technical Indicators**:
- Data generated by calculating moving averages, RSI (Relative Strength Index), MACD (Moving Average Convergence Divergence), Bollinger Bands, and other common indicators used for technical analysis.
4. **Sentiment Data**:
- Data extracted from **news feeds**, **social media**, and **financial reports** to gauge market sentiment.
- Sentiment analysis can help predict how market participants might react to news events or earnings announcements.
5. **Alternative Data**:
- **Geolocation data**, **weather data**, and other unconventional datasets that might provide an edge in predicting market moves.
---
### **How Database Trading Can Be Profitable**:
1. **Automated Trading Strategies**:
- Traders can design **algorithmic trading strategies** that use data stored in the database to execute trades automatically based on certain criteria. By leveraging historical data, these strategies can identify patterns and opportunities that would be hard for human traders to spot.
2. **High-Frequency Trading (HFT)**:
- High-frequency traders rely on **fast, automated decision-making** systems that use real-time data stored in databases. By processing large volumes of data quickly, high-frequency trading algorithms can capture small price movements across numerous assets, leading to profitability through sheer volume of trades.
3. **Risk Management**:
- By leveraging databases for real-time data analysis, traders can implement **dynamic risk management** systems that adjust position sizes, stop losses, and take profits based on market conditions. This helps protect profits and minimize losses.
4. **Predictive Analytics**:
- Machine learning models and predictive analytics can be applied to the data in the database to forecast price movements, asset correlations, and volatility patterns. Traders can use these insights to make informed decisions about entry and exit points.
5. **Improved Strategy Development**:
- With access to vast amounts of data, traders can continuously test, optimize, and improve their strategies. This allows them to stay ahead of market trends and make adjustments to their trading algorithms when necessary.
6. **Diversification**:
- Traders can use databases to analyze a wide range of assets, strategies, and timeframes. This allows them to implement **diversified strategies** and reduce the overall risk of their trading portfolio.
---
### **Challenges of Database Trading**:
1. **Data Quality and Integrity**:
- If the data stored in the database is incomplete, inaccurate, or inconsistent, it can lead to incorrect trading decisions. Ensuring data quality is paramount to successful database trading.
2. **Complexity and Maintenance**:
- Database-driven trading systems require regular maintenance, updates, and tuning. Traders need to manage both the infrastructure (databases, servers, etc.) and the software (trading algorithms, data processing pipelines) to ensure the system runs efficiently.
3. **Computational Power**:
- Analyzing large volumes of data in real-time can require significant computational resources. For high-frequency or machine learning-based strategies, having access to powerful servers or cloud-based infrastructure is crucial.
4. **Latency**:
- In fast-moving markets, even small delays in data processing can affect trading outcomes. High-frequency and algorithmic trading strategies require **low-latency systems** to ensure that orders are executed quickly and accurately.
### **Summary**:
**Database trading** is a powerful approach for managing, analyzing, and executing trades using vast amounts of financial data. It provides traders with a structured and efficient way to store, analyze, and access data, which is essential for developing profitable trading strategies. By using databases, traders can automate their strategies, backtest their models, and analyze large datasets in real time to gain a competitive edge in the market.
Niftytrend

what is support and resistance and why it is crucial ?**Support and resistance** are fundamental concepts in technical analysis, widely used by traders to predict potential price levels where an asset's price might reverse or consolidate. They represent key price levels on a chart that help identify areas where the supply and demand forces are in balance, leading to price pauses or reversals.
### **What is Support?**
**Support** is the price level at which an asset tends to find buying interest, preventing the price from falling further. It’s seen as a "floor" in the market because, when the price drops toward this level, there is an increased likelihood that buyers will enter, leading to a bounce or reversal. In simple terms, it's where demand is strong enough to stop the price from declining.
- **Support levels** are typically identified by looking for past price points where the asset has repeatedly stopped falling and reversed direction.
- When the price approaches support, it is considered a potential buying opportunity if the level holds.
### **What is Resistance?**
**Resistance** is the opposite of support. It’s the price level at which an asset faces selling pressure, preventing the price from rising further. It’s seen as a "ceiling" because when the price rises toward this level, selling increases, potentially causing the price to reverse or consolidate. In simple terms, resistance represents a level where supply overwhelms demand, causing prices to retreat.
- **Resistance levels** are marked by price points where the asset has had trouble moving past or has reversed in the past.
- When the price approaches resistance, it’s often considered a potential selling or shorting opportunity if the level holds.
### **Why Support and Resistance are Crucial in Trading:**
1. **Key Decision-Making Points**:
- **Entry and Exit Points**: Support and resistance levels provide traders with clear points to make decisions on buying or selling. Traders typically look to enter **buy trades near support** levels (if the market is in an uptrend) and **sell trades near resistance** levels (if the market is in a downtrend).
- **Stop Loss Placement**: Support and resistance are often used to place stop-loss orders. For example, traders may place stop losses just below a support level (in case it breaks down) or just above a resistance level (in case it breaks out).
2. **Predicting Price Reversals and Breakouts**:
- **Reversals**: When the price approaches a support or resistance level, it often reverses direction because these levels represent points where supply and demand meet. Traders use these levels to anticipate potential market reactions, such as a bounce off support or a rejection at resistance.
- **Breakouts**: A breakout occurs when the price moves through support or resistance with increased momentum. This can signal a trend change or continuation. For instance, a breakout above a resistance level can indicate that the price will rise further, and traders often use this as an entry signal for long trades.
3. **Market Sentiment and Psychology**:
- **Psychological Importance**: Support and resistance levels are important because they reflect the collective sentiment of market participants. A price level that has repeatedly acted as support or resistance reflects a shared belief among traders that this price represents a fair value for the asset.
- **Self-fulfilling Prophecies**: Many traders use support and resistance levels, meaning these levels can become self-fulfilling prophecies. For example, if many traders place stop losses just below a key support level, the price may dip below that support and trigger a cascade of stop-loss orders, leading to further price declines.
4. **Risk Management**:
- Support and resistance levels help traders define their risk by setting targets for potential price moves. Traders can set **profit targets** near the next resistance level and use **support levels** to determine where the price might fall to, allowing them to set a stop loss accordingly.
- The closer a stop loss is placed to the support or resistance level, the smaller the risk in a trade, and the better the risk-to-reward ratio.
5. **Trend Confirmation**:
- **Support in an Uptrend**: In an uptrend, a price retracing to a support level and bouncing higher can confirm the strength of the trend. It suggests that buyers are continuing to step in at that level, reinforcing the uptrend.
- **Resistance in a Downtrend**: In a downtrend, price retracing to a resistance level and falling lower can confirm the strength of the downtrend. It indicates that sellers are dominating at that level.
6. **Understanding Market Ranges**:
- In sideways or range-bound markets, support and resistance levels are crucial in identifying the boundaries within which the asset is moving. Traders can look to buy near support and sell near resistance as the price oscillates between these levels.
---
### **How to Identify Support and Resistance:**
1. **Horizontal Support and Resistance**:
- This is the most basic form, where traders draw horizontal lines at levels where the price has repeatedly bounced (support) or faced rejection (resistance). These levels are typically marked at significant price points where the price has reversed several times in the past.
2. **Trendline Support and Resistance**:
- Support and resistance levels can also be identified using **trendlines**. For an uptrend, a trendline drawn along the lows (support) can help identify the price at which buyers are likely to step in. For a downtrend, a trendline drawn along the highs (resistance) can help identify price points where selling pressure may emerge.
3. **Moving Averages as Dynamic Support/Resistance**:
- **Moving averages** (like the 50-day or 200-day) can act as dynamic support or resistance levels. When the price is above the moving average, the moving average can act as support. When the price is below the moving average, it can act as resistance. This can be useful for trending markets.
4. **Fibonacci Retracement Levels**:
- Fibonacci retracement levels are another tool traders use to identify potential support and resistance areas. These levels are based on the mathematical Fibonacci sequence and are often used to predict potential reversal points after a price move.
---
### **How to Spot Winning Trades Using Support and Resistance**:
1. **Buying Near Support in an Uptrend**:
- In an uptrend, **buying near support** (when the price pulls back to a support level) can provide a favorable risk-to-reward ratio. The idea is that the price is likely to bounce off support and continue upward.
- **Example**: If the price of a stock is trending higher and pulls back to a well-established support level, traders may enter a long position, expecting the price to bounce.
2. **Selling Near Resistance in a Downtrend**:
- In a downtrend, **selling near resistance** (when the price moves up to resistance) allows traders to profit from the downward move after the price faces rejection at the resistance level.
- **Example**: If a stock is in a downtrend and rallies up to resistance, traders might short the stock, expecting a decline.
3. **Breakout Strategy**:
- A **breakout** above resistance or below support can signal the start of a new trend. A breakout is often accompanied by high volume, confirming that there is significant buying (or selling) interest behind the move.
- **Example**: A stock breaks above resistance with strong volume. Traders may enter a long position, expecting the price to continue higher.
4. **False Breakouts**:
- Sometimes the price breaks a support or resistance level but fails to sustain the move, resulting in a **false breakout**. Traders can use false breakouts as opportunities for counter-trend trades, entering short near resistance in an uptrend or long near support in a downtrend, once the breakout fails and the price returns within the range.
5. **Range Trading**:
- In a sideways market, traders can buy near support and sell near resistance, taking advantage of price oscillations within the range. This type of trading works well in markets with low volatility.
- **Example**: A stock has been bouncing between $50 (support) and $60 (resistance). Traders might buy at $50 and sell at $60, repeating the process until a breakout occurs.
---
### **Key Takeaways:**
- **Support and resistance** are essential tools for predicting price movements and making informed trading decisions.
- Support levels act as potential **buying zones**, while resistance levels act as potential **selling zones**.
- They provide traders with a framework to set **stop-loss orders**, **take-profit targets**, and **entry points**.
- Support and resistance levels reflect market psychology, as they represent price points where market participants expect reversals or consolidation.
- Traders use support and resistance to anticipate price reactions, confirm trends, and manage risk effectively.

what is the importance of trendlines & how to spot winning trade**Trendlines** are one of the most fundamental tools in technical analysis. They are simple lines drawn on a price chart to help identify the direction of the market, confirm trends, and predict future price movements. By connecting key price points (such as swing highs or swing lows), trendlines give traders a visual representation of support and resistance levels, making them crucial for decision-making in trading.
### **The Importance of Trendlines:**
1. **Identify the Direction of the Trend**:
- **Uptrend**: An uptrend is marked by higher highs and higher lows. A trendline drawn along the lows (connecting at least two significant points) helps identify the underlying upward direction of the market. A break below this trendline may signal a trend reversal.
- **Downtrend**: A downtrend is marked by lower highs and lower lows. Trendlines drawn along the highs indicate resistance levels. A break above this trendline could suggest the end of the downtrend and the potential start of an uptrend.
- **Sideways (Range-bound) Market**: In a range-bound market, trendlines help identify key support and resistance levels. The price moves between these levels until it breaks out in one direction.
2. **Support and Resistance**:
- **Support**: In an uptrend, the trendline acts as **support**, where the price tends to bounce off the line and continue higher.
- **Resistance**: In a downtrend, the trendline acts as **resistance**, where the price is likely to reverse or face selling pressure when it hits the trendline.
- Trendlines help traders identify key levels where price may reverse, consolidating their trading strategy.
3. **Spotting Breakouts**:
- **Breakouts** occur when the price moves beyond a key trendline (either support or resistance), suggesting a potential continuation or reversal of the trend. A breakout above a resistance trendline could signal a shift to an uptrend, while a breakdown below support might indicate a downtrend.
- Trendline breaks are often used as entry points for new trades, with the expectation that the breakout will lead to a strong price move in the direction of the trend.
4. **Trend Confirmation**:
- Trendlines confirm whether a trend is strong or weakening. A consistent price pattern touching the trendline multiple times can confirm that the trend is intact. Conversely, when the price moves sharply away from the trendline or fails to touch it at multiple points, it may suggest that the trend is losing momentum.
5. **Predict Future Price Movements**:
- Traders use trendlines not only to see where the price has been but also to predict where the price might go in the future. By extending the trendline beyond the current price action, traders can estimate potential support, resistance, or breakout levels for future trades.
---
### **How to Spot Winning Trades Using Trendlines:**
1. **Look for Trendline Touches**:
- **Ideal Touches**: The more times a trendline is touched without being broken, the stronger and more reliable it becomes. If the price comes close to the trendline again and bounces back (respecting the trendline), it can present a **buy opportunity** in an uptrend or a **sell opportunity** in a downtrend.
- **Validating the Trend**: If the price is consistently bouncing off the trendline in an uptrend or downtrend, it gives traders confidence that the trend is intact and could continue.
2. **Confirm with Other Technical Indicators**:
- **RSI (Relative Strength Index)**: When the price is approaching a trendline and the RSI is not yet overbought (for an uptrend) or oversold (for a downtrend), it indicates that the trend might have enough momentum to continue.
- **Moving Averages**: Use moving averages to confirm the trend direction. A price above a rising moving average supports an uptrend, while a price below a falling moving average supports a downtrend.
- **MACD (Moving Average Convergence Divergence)**: MACD can help confirm the trend’s strength and potential reversals. For example, a MACD crossover in the direction of the trend can signal an ideal entry when the price is near the trendline.
3. **Look for Trendline Breaks**:
- A break above a resistance trendline in an uptrend or below a support trendline in a downtrend can be a **high-probability trade signal**. After a trendline break, the price often follows through in the direction of the breakout, presenting an opportunity for entry.
- Use **volume analysis**: A trendline break accompanied by high volume can strengthen the likelihood that the breakout will be valid and that a strong price move will follow.
4. **Entry Points at Trendline Retests**:
- After a trendline break, the price might pull back to the trendline level and retest it. If the price holds the retest and bounces off, it’s a high-probability entry signal, especially when supported by other indicators (like a bullish candlestick pattern or volume confirmation).
- For example, after an upward breakout, the price might return to retest the broken resistance (now acting as support) and then continue higher, providing a "second chance" entry for traders.
5. **Use Trendlines with Chart Patterns**:
- Trendlines can be used to identify chart patterns that have high-probability outcomes, like **triangles**, **channels**, and **flags**.
- **Triangle Patterns**: Ascending triangles in an uptrend and descending triangles in a downtrend can provide breakout opportunities once the trendlines of the pattern are broken.
- **Channels**: In a trending market, price moves between two parallel trendlines. A breakout from the channel can signal the start of a new trend.
- **Flags**: Flags are short-term consolidation patterns that form after a sharp price move. A breakout from the flag trendline often results in a continuation of the prior trend.
6. **Use Stop Loss and Take Profit with Trendlines**:
- **Stop-Loss**: Place stop-loss orders just beyond the trendline in the opposite direction. For example, if you enter a buy trade after a breakout above the trendline, place your stop-loss below the broken resistance (now acting as support) to protect against a false breakout.
- **Take-Profit**: You can use trendlines to project price targets. For instance, after a trendline breakout, you can project a price target by measuring the height of the pattern (like a triangle or flag) and adding or subtracting it from the breakout point.
---
### **Examples of Spotting Winning Trades with Trendlines:**
#### **Example 1: Uptrend with Support Trendline**
- **Scenario**: The price of a stock is trending upward, and a clear upward trendline has been formed by connecting two significant swing lows. The price approaches the trendline again, but it bounces upward, showing that buyers are stepping in.
- **Action**: This is a strong indication that the uptrend is likely to continue. You can enter a **long position** with a stop loss just below the trendline to minimize risk.
#### **Example 2: Breakout Above Resistance Trendline**
- **Scenario**: A stock has been trading in a range and is approaching a key resistance trendline. Volume begins to increase, and the price breaks above the trendline with significant momentum.
- **Action**: This is a breakout signal. Enter a **long position** after the price breaks above resistance and holds above it. A stop loss can be placed just below the breakout point.
#### **Example 3: Trendline Retest**
- **Scenario**: After a breakout above resistance, the price pulls back to retest the broken resistance level (now support) and holds there. A bullish candlestick pattern (such as a hammer or engulfing candle) forms at the trendline.
- **Action**: This is a strong confirmation to enter a **long position**. The trendline support has held, and the retest suggests that the uptrend is likely to continue.
---
### **Risks of Trendline Trading**:
- **False Breakouts**: Sometimes, the price may break a trendline only to reverse quickly, leading to losses. It’s essential to use additional indicators (like volume or candlestick patterns) to confirm trendline breaks.
- **Over-reliance on Trendlines**: Trendlines are valuable, but relying only on them without other forms of analysis can be risky. It's important to combine trendlines with other tools (indicators, chart patterns, etc.) to increase your odds of success.
- **Subjectivity**: Drawing trendlines can be somewhat subjective. Different traders might draw trendlines differently, leading to varying interpretations of market trends.
---
In conclusion, **trendlines** are invaluable tools for spotting winning trades by identifying trends, support and resistance levels, and breakout points. When combined with other technical indicators and proper risk management, trendlines can significantly improve a trader's ability to make profitable decisions.

what is volume based trading ?**Volume-based trading** refers to a strategy where traders focus on trading decisions based on **trading volume**, which is the total number of shares, contracts, or units of an asset traded within a specific time period. The core idea behind volume-based trading is that volume is a crucial indicator of the strength of a price move. By analyzing volume patterns, traders can make more informed decisions about the direction of the market, trend strength, or potential reversals.
Volume plays a key role in confirming price action. If a price move is supported by high volume, it typically indicates that the move is strong and more likely to continue. Conversely, a price move with low volume may indicate a weak or unsustainable trend, which could be prone to reversal or consolidation.
### Key Concepts in Volume-Based Trading:
1. **Volume and Price Action**:
- **Volume Spike**: A sudden surge in volume can indicate significant interest in an asset, often due to news, earnings reports, or other catalysts. When this volume spike happens during a price move, it may signal that the trend is strong and could continue.
- **Price Movement Without Volume**: A price move without corresponding high volume can be a sign of a weak trend. For example, a stock may rise slightly in price, but if it’s not supported by volume, it may not have the momentum to sustain that move.
2. **Volume and Trend Confirmation**:
- **Trend Continuation**: In an uptrend, increasing volume often signals that there is strong buying interest, suggesting the trend will continue. Similarly, in a downtrend, increasing volume can signal that selling pressure is strong, and the downtrend will persist.
- **Trend Reversal**: A volume surge during a price reversal could be an early warning sign that a trend is about to change. For instance, a sharp price drop with a large volume could indicate that the selling pressure is about to give way to buying pressure, signaling a potential reversal or the end of a downtrend.
3. **Volume Indicators**:
- **On-Balance Volume (OBV)**: This indicator uses volume flow to predict changes in price. It works by adding or subtracting volume based on the direction of the price (if the price rises, add volume; if the price falls, subtract volume). The OBV line helps to identify whether volume is supporting the current price movement or diverging from it.
- **Accumulation/Distribution (A/D) Line**: This indicator measures the cumulative flow of money into and out of an asset, similar to OBV but with an emphasis on the relationship between price and volume for each period. A rising A/D line suggests buying pressure, while a falling line indicates selling pressure.
- **Volume Moving Average**: A volume moving average smooths out volume data to help traders identify volume spikes more easily. If current volume exceeds the moving average by a significant amount, it could signal that something important is happening in the market.
- **Chaikin Money Flow (CMF)**: This indicator measures the amount of money flow into or out of an asset over a specific period, taking both price and volume into account. A positive CMF suggests that the buying pressure is dominant, while a negative CMF indicates that selling pressure is leading the market.
4. **Volume and Support/Resistance**:
- **Breakout with Volume**: A breakout above a key resistance level on high volume is often seen as a confirmation that the price will continue moving higher. The same logic applies to a breakdown below support, where increased volume can confirm the strength of the breakdown.
- **Volume at Support/Resistance Levels**: If an asset approaches a support or resistance level and volume increases, it can signal that the level is about to be broken or that there is strong interest in reversing the price at that level.
5. **Divergence Between Price and Volume**:
- **Bullish Divergence**: If the price is making new lows but volume is decreasing, it may indicate a potential reversal to the upside. This could signal that selling pressure is weakening.
- **Bearish Divergence**: If the price is making new highs but volume is decreasing, it could signal a potential reversal to the downside. This indicates that buying pressure is losing strength.
---
### How to Use Volume-Based Trading:
1. **Confirm Breakouts and Breakdowns**:
- When an asset breaks out of a consolidation or a resistance level, it’s important to see if this is supported by increasing volume. This confirms that the breakout is likely to be legitimate.
- Similarly, when a price breaks below a key support level, increasing volume can suggest that the breakdown is real, not just a temporary dip.
2. **Spot Potential Reversals**:
- A price move with unusually high volume that contradicts the previous trend (e.g., a strong price drop after an uptrend) could signal that the trend is about to reverse.
- A sharp increase in volume during a pullback in an existing trend can signal that the pullback is temporary, and the main trend will continue once the consolidation phase is over.
3. **Monitor Volume During Consolidation**:
- When a stock is in a period of consolidation or trading sideways, low volume typically accompanies the consolidation. A sudden increase in volume during this period might signal that the stock is about to break out in either direction.
4. **Use Volume to Support Technical Indicators**:
- Combine volume analysis with other technical indicators (like moving averages, RSI, or MACD) to confirm trade signals. For example, a moving average crossover coupled with a surge in volume could provide a strong buy signal.
- Similarly, if the RSI is showing overbought conditions, but there’s a decrease in volume, it could suggest that the trend is weakening, and a reversal may be near.
5. **Understand Market Sentiment**:
- High volume can reflect significant market interest, whether it's bullish or bearish. For example, if a stock is rising in price and volume is rising along with it, it suggests that buyers are in control. On the other hand, rising volume during a falling price indicates that sellers are driving the market.
---
### Example of Volume-Based Trading Strategy:
**Bullish Breakout with Volume**:
- **Scenario**: A stock is consolidating around a key resistance level, trading in a narrow range. The price then breaks above the resistance level, and the volume spikes significantly.
- **Action**: The volume spike confirms that the breakout is strong, and you enter a long position, expecting the price to continue upward. You may set a stop loss just below the breakout point in case the breakout turns out to be false.
**Bearish Breakdown with Volume**:
- **Scenario**: A stock is trading in an uptrend and reaches a key support level. The price breaks below the support level on heavy volume.
- **Action**: The volume confirms that selling pressure is strong, and you may enter a short position, anticipating further declines. A stop-loss can be placed above the broken support level to limit potential losses if the trend reverses.
---
### Risks of Volume-Based Trading:
- **False Breakouts or Breakdowns**: Sometimes, price moves accompanied by high volume can be "false signals," meaning the price could reverse quickly after breaking support or resistance.
- **Volume Can Lag Price**: Volume is a lagging indicator, meaning it confirms trends after they have already started. This can lead to missed opportunities if you're trying to catch the beginning of a trend.
- **Low Volume Can Lead to Price Manipulation**: In markets with low volume, large players (e.g., institutional traders) can manipulate prices more easily, leading to sudden and unpredictable price movements.
---
In summary, **volume-based trading** is a powerful strategy that helps traders confirm the strength of a trend, identify breakouts, and spot potential reversals. By combining volume analysis with price action and other technical indicators, traders can enhance their decision-making and improve their chances of success.

what is momentum trading & how to become profitable ?**Momentum trading** is a strategy where traders seek to capitalize on the continuation of an existing price trend. The idea is to buy securities that are trending up and sell securities that are trending down, with the expectation that the trend will persist for some time. In other words, momentum traders try to ride the wave of price movements, profiting from short-term trends rather than long-term value.
### Key Concepts of Momentum Trading:
1. **Trend Following**: Momentum traders believe that assets that are moving in one direction (up or down) will continue to do so for a period. The core idea is to "buy high, sell higher" or "sell low, buy lower," depending on whether the trend is bullish (upward) or bearish (downward).
2. **Technical Indicators**: Momentum traders rely heavily on technical analysis, using indicators to confirm the strength of a trend. Common tools include:
- **Relative Strength Index (RSI)**: Measures whether an asset is overbought or oversold, helping identify potential reversal points or trend strength.
- **Moving Averages**: Moving averages like the 50-day or 200-day moving average help determine the overall direction of a trend.
- **MACD (Moving Average Convergence Divergence)**: Tracks the relationship between two moving averages to help identify potential buy or sell signals.
- **Volume**: Increased trading volume often indicates strong momentum, as it confirms that the price move is supported by market participation.
3. **Time Horizon**: Momentum trading can range from **day trading** to **swing trading** or even longer positions depending on the trader’s strategy and market conditions.
4. **Momentum Shift**: Momentum traders look for signs of a trend reversal or a shift in momentum, like a sudden spike in price or volume, as an opportunity to either enter or exit a trade.
---
### How to Become Profitable with Momentum Trading:
1. **Identify Strong Trends**:
- **Look for Assets with Strong Price Moves**: Profitable momentum trades often involve assets that have recently seen sharp upward or downward movements. This could be a result of earnings announcements, news, or market sentiment.
- **Use Trend Indicators**: Rely on moving averages and trend lines to confirm that an asset is in a strong uptrend or downtrend. The more clearly defined the trend, the better.
2. **Timing Your Entry and Exit**:
- **Enter at the Right Moment**: In momentum trading, timing is crucial. The goal is to enter a trade as close to the start of the trend as possible. Look for technical signals like a breakout above resistance or a bounce off a support level.
- **Exit Before the Trend Reverses**: Profitable momentum traders know when to take profits. One way to do this is by setting predefined exit points (e.g., resistance levels or a target price) or using trailing stops to lock in profits as the price moves in your favor.
- **Avoid Chasing**: Don’t chase a move once it’s already well underway. It’s better to wait for a brief pullback or consolidation before entering, rather than jumping in too late.
3. **Use Stop Losses**:
- **Protect Against Reversals**: Momentum trading can be risky because trends can reverse unexpectedly. Always use stop-loss orders to protect your capital and limit potential losses. For example, you might place a stop just below a recent low (for a long position) or above a recent high (for a short position).
- **Adjust Stops Dynamically**: As the trend continues in your favor, you can adjust your stop-loss to break even or lock in profits. This helps you stay in the trade while protecting your gains.
4. **Monitor Market Sentiment**:
- **News and Events**: Momentum is often driven by news, earnings reports, economic events, or announcements. Be aware of major upcoming events, and try to position yourself before the news breaks or after it has been absorbed by the market.
- **Follow Volume**: Volume is crucial in momentum trading. If a price move is accompanied by high volume, it signals strength in the trend. Low volume can indicate a weak or short-lived move.
5. **Trade with the Trend, Not Against It**:
- **Buy in Uptrends, Sell in Downtrends**: Momentum traders make profits by trading with the direction of the trend. If the market is in an uptrend, focus on buying (long positions). If it's in a downtrend, consider selling (short positions).
- **Don’t Fight Reversals**: Even if a trend seems like it will reverse, it’s better to wait for confirmation before betting against it. Prematurely shorting an uptrend or going long in a downtrend can lead to significant losses.
6. **Control Your Emotions**:
- **Stay Disciplined**: Momentum trading can be fast-paced, and it’s easy to get caught up in emotions like fear or greed. Stick to your strategy and don’t make decisions based on impulse.
- **Cut Losses Early**: If a trade isn’t working out as expected, cut your losses quickly rather than hoping the trend will reverse. The quicker you get out, the less impact a losing trade will have on your overall profitability.
7. **Backtest and Refine Your Strategy**:
- **Test Your Approach**: Before committing real money, backtest your momentum trading strategy on historical data to see how it would have performed. This helps you refine entry and exit points, risk management rules, and trade timing.
- **Adapt to Changing Market Conditions**: Momentum can work differently in different market environments (e.g., trending vs. range-bound markets). Be prepared to adjust your strategy based on current market conditions.
---
### Example of a Momentum Trading Strategy:
- **Buy Signal**:
- The price of stock XYZ breaks through a key resistance level on high volume.
- The RSI is above 50 but not overbought (below 70), confirming a strong upward momentum.
- You enter a long position when the price breaks out.
- **Sell Signal**:
- The stock hits a key price target or resistance level.
- RSI shows overbought conditions, or the price starts showing signs of reversal (e.g., a small bearish candlestick pattern).
- You exit the position and take profits, or you set a trailing stop to lock in gains if the price continues to rise.
---
### Risks of Momentum Trading:
- **Reversals**: Trends can reverse suddenly, causing momentum traders to lose money quickly. It’s important to react fast and cut losses.
- **Chasing the Trend**: Entering a trade after a trend has already been established can result in buying at high prices or selling at low prices.
- **Market Noise**: Momentum traders can get whipsawed in choppy, sideways markets, as trends are not clear and the price moves unpredictably.
---
### How to Be Profitable in Momentum Trading:
1. **Start Small**: Begin with a small position size until you gain experience with the strategy and develop your skills.
2. **Master Risk Management**: Always use stop-loss orders and know your risk-to-reward ratio before entering any trade.
3. **Stay Disciplined and Follow a Plan**: Avoid emotional decision-making and stick to your strategy.
4. **Track Your Performance**: Keep a trading journal to analyze your trades and learn from both your successes and mistakes.

what is smart money trading psychology ?"Smart money" trading psychology refers to the mindset, strategies, and behaviors of experienced and institutional traders, as opposed to individual retail traders. These traders are often well-funded, have access to more sophisticated tools, and can move the market in ways that less experienced traders cannot. Their approach to trading tends to be more disciplined, patient, and based on a deeper understanding of market dynamics, rather than emotion or speculation.
Here's a breakdown of what smart money trading psychology entails:
### 1. **Patient and Strategic Decision-Making**:
- **Long-Term Focus**: Smart money traders don’t focus on short-term gains or panic-driven decisions. They often look at the bigger picture, using fundamental and technical analysis to identify high-probability setups.
- **Patient Entry and Exit**: They wait for the right conditions and aren't in a rush to make trades. They are less likely to chase the market or make impulsive moves.
### 2. **Risk Management**:
- **Defined Risk**: Smart money traders always know the amount of risk they are taking on a trade. They define stop-loss levels, position sizes, and risk-to-reward ratios before entering a trade.
- **Capital Preservation**: Protecting their capital is a top priority. This is why they use proper risk management techniques like diversification and hedging to minimize losses.
### 3. **Contrarian Mindset**:
- **Market Sentiment**: Smart money often goes against the crowd. While retail traders may react emotionally to market trends, smart money traders look for opportunities when the masses are overly optimistic or pessimistic. This contrarian approach often leads them to buy when others are selling and vice versa.
- **Following Institutional Money**: They are aware of where the bigger players (institutional investors, hedge funds, banks) are positioned and tend to align their trades with these larger market movers.
### 4. **Emotional Control**:
- **No Emotional Trading**: Unlike retail traders who might panic in times of loss or greedily hold onto winning positions for too long, smart money traders maintain composure. They avoid chasing after quick gains or letting fear drive their actions.
- **Objectivity**: Emotions like fear and greed are minimized. Smart money traders follow their plan and strategy and do not allow the market noise to disrupt their decision-making process.
### 5. **Understanding Market Liquidity and Volume**:
- **Liquidity Awareness**: They are mindful of market liquidity, ensuring there’s enough volume in a market to enter and exit trades without significant slippage or price manipulation.
- **Volume Analysis**: Smart money traders often use volume as a key indicator. High trading volume can confirm the strength of a trend, while low volume might signal potential reversals or consolidation.
### 6. **Information Edge**:
- **Access to Research and Data**: Smart money traders typically have access to better information, tools, and research. They use this edge to identify trends or opportunities that other retail traders might miss.
- **Fundamental Analysis**: They often analyze the underlying value of assets (such as stocks, commodities, or currencies) by studying macroeconomic data, company financials, and other relevant factors that influence price movements.
### 7. **Consistency Over Time**:
- **Building Wealth Gradually**: Instead of trying to make quick profits, smart money traders focus on consistency. They aim for steady growth and avoid risky, one-off bets.
- **Refining Strategies**: They continuously learn from past trades, refining their approach over time based on what works and what doesn’t.
### 8. **Market Manipulation Awareness**:
- **Avoiding the "Noise"**: Smart money traders are aware of market manipulation tactics (like "pump and dump" schemes) and don't get caught up in hype-driven rallies or crashes.
- **Understanding Market Cycles**: They have a deep understanding of market cycles and often recognize when prices are being artificially inflated or deflated.
### How to Adopt Smart Money Psychology:
1. **Develop a Trading Plan**: Like the pros, smart money traders always have a clear plan. It includes strategies, risk management techniques, and exit plans. If you lack a plan, it's easy to make emotional decisions.
2. **Keep Emotions in Check**: It can be hard, but detaching emotion from trading is essential. Practice self-discipline, and don't act impulsively.
3. **Use Proper Risk Management**: Define your risk per trade, set stop losses, and calculate risk-to-reward ratios before you enter a position.
4. **Learn Continuously**: Smart money traders are constantly learning and evolving. Stay updated on financial news, trends, and market conditions, and never stop improving your trading skills.
5. **Watch the Bigger Players**: Pay attention to what large institutional traders are doing. You can often find clues in volume patterns, options activity, or reports from major financial institutions.
In summary, smart money trading psychology is all about discipline, patience, risk management, and staying objective. It requires a strategic approach, rather than relying on gut feelings or reacting emotionally to market movements. By adopting these principles, individual traders can better position themselves for long-term success.

What is option trading and how to use it ?Option trading involves buying and selling options contracts on financial instruments, such as stocks, commodities, or indices. An option gives the buyer the right, but not the obligation, to buy or sell an underlying asset at a specific price (called the **strike price**) within a specified period (called the **expiration date**).
There are two main types of options:
1. **Call options**: Gives the holder the right to **buy** the underlying asset at the strike price.
2. **Put options**: Gives the holder the right to **sell** the underlying asset at the strike price.
### Key Terms:
- **Premium**: The price paid for the option itself.
- **Strike Price**: The price at which the option holder can buy (for calls) or sell (for puts) the underlying asset.
- **Expiration Date**: The date the option expires. After this date, the option becomes worthless if not exercised.
- **In the Money (ITM)**: When exercising the option would lead to a profit (e.g., a call option's strike price is below the current market price of the asset).
- **Out of the Money (OTM)**: When exercising the option would not lead to a profit.
- **At the Money (ATM)**: When the strike price is equal to the current market price of the asset.
### How to Use Option Trading:
1. **Hedging**: Options can be used to protect against price movements in an asset you already own. For example, buying put options can protect your stock holdings from a potential drop in price.
2. **Speculation**: Traders can buy options to profit from expected movements in the price of an underlying asset. For example, buying call options when you expect the stock price to rise, or buying put options when you expect it to fall.
3. **Income Generation (Writing Options)**: You can also write (sell) options to generate income through premiums. The risk here is that, if the option is exercised, you will have to fulfill the terms of the contract (buying or selling the underlying asset at the strike price).
### Example:
- **Buying a Call Option**: If you think a stock will rise in price, you could buy a call option. If the stock price rises above your strike price, you can either exercise the option to buy at the lower price or sell the option for a profit.
- **Buying a Put Option**: If you think a stock will fall in price, you could buy a put option. If the stock price falls below your strike price, you can either exercise the option to sell at the higher price or sell the option for a profit.
### Risks:
- **Limited Loss**: For option buyers, the maximum loss is limited to the premium paid for the option.
- **Unlimited Loss (for Sellers)**: If you're selling options (writing options), your potential losses are theoretically unlimited, especially when selling uncovered (naked) options.
### Strategy Tips:
1. **Start Simple**: Beginners should focus on buying options rather than writing them.
2. **Understand Volatility**: Options are highly sensitive to volatility, so understanding how market fluctuations affect options prices is crucial.
3. **Practice with a Demo Account**: Many brokers offer paper trading or demo accounts that let you practice options trading without real money at risk.
4. **Diversify**: Don't put all your capital into options; consider it a tool within a broader investment strategy.

What is candlestick patterns ?**Candlestick patterns** are formations created by one or more candlesticks on a price chart, used by traders to predict future price movements in financial markets. Each candlestick represents the price action for a specific time period (e.g., 1 minute, 1 hour, daily), and the pattern they form can provide insights into market sentiment and potential price direction.
### Basic Components of a Candlestick:
A single candlestick consists of the following parts:
- **Body**: The thick part of the candlestick that represents the difference between the opening and closing prices.
- **Bullish Body**: If the closing price is higher than the opening price (typically represented by a white or green body).
- **Bearish Body**: If the closing price is lower than the opening price (typically represented by a black or red body).
- **Wicks (Shadows)**: The thin lines above and below the body that represent the highest and lowest prices reached during the time period.
- **Upper Wick (Shadow)**: The line above the body showing the highest price.
- **Lower Wick (Shadow)**: The line below the body showing the lowest price.
### Types of Candlestick Patterns:
Candlestick patterns can be categorized into **single candlestick patterns** (formed by one candlestick) and **multiple candlestick patterns** (formed by two or more candlesticks). These patterns are used to identify potential reversals or continuations in market trends.
#### **Single Candlestick Patterns**:
1. **Doji**:
- A Doji candlestick occurs when the opening and closing prices are almost the same, resulting in a very small body with long wicks on both sides.
- **Interpretation**: It indicates indecision in the market. A Doji after a strong trend can signal a potential reversal or slowdown in price movement.
- **Example**: If a Doji appears after a strong uptrend, it might indicate that the buying pressure is weakening, suggesting a possible reversal to a downtrend.
2. **Hammer**:
- A **Hammer** has a small body near the top with a long lower wick and little or no upper wick.
- **Interpretation**: It occurs after a downtrend and can signal a potential reversal to the upside, as the price moved lower during the session but closed near the opening price.
3. **Inverted Hammer**:
- An **Inverted Hammer** has a small body at the bottom and a long upper wick.
- **Interpretation**: It can appear after a downtrend and signals potential bullish reversal, as it shows that buyers tried to push the price higher but closed near the opening price.
4. **Shooting Star**:
- A **Shooting Star** has a small body near the bottom, a long upper wick, and little or no lower wick.
- **Interpretation**: It appears after an uptrend and indicates a potential bearish reversal. It shows that buyers pushed the price up during the session, but sellers took control by the close.
#### **Multiple Candlestick Patterns**:
1. **Engulfing Pattern**:
- **Bullish Engulfing**: A small red (bearish) candlestick followed by a large green (bullish) candlestick that completely engulfs the previous one.
- **Interpretation**: It suggests a potential reversal to the upside from a downtrend.
- **Bearish Engulfing**: A small green (bullish) candlestick followed by a large red (bearish) candlestick that completely engulfs the previous one.
- **Interpretation**: It suggests a potential reversal to the downside from an uptrend.
2. **Morning Star**:
- The **Morning Star** is a three-candlestick pattern. It consists of:
1. A long bearish candlestick.
2. A small candlestick (which can be bullish or bearish) that gaps down.
3. A long bullish candlestick that closes above the midpoint of the first candlestick.
- **Interpretation**: It is a strong bullish reversal pattern that appears after a downtrend.
3. **Evening Star**:
- The **Evening Star** is the opposite of the Morning Star and is a three-candlestick pattern consisting of:
1. A long bullish candlestick.
2. A small candlestick (which can be bullish or bearish) that gaps up.
3. A long bearish candlestick that closes below the midpoint of the first candlestick.
- **Interpretation**: It indicates a potential bearish reversal, occurring after an uptrend.
4. **Harami**:
- **Bullish Harami**: A small green candlestick contained within the body of a preceding large red candlestick.
- **Interpretation**: It suggests a potential reversal to the upside after a downtrend.
- **Bearish Harami**: A small red candlestick contained within the body of a preceding large green candlestick.
- **Interpretation**: It suggests a potential reversal to the downside after an uptrend.
5. **Piercing Pattern**:
- The **Piercing Pattern** is a two-candlestick pattern where the first is a long red candlestick, and the second is a long green candlestick that opens below the low of the previous red candle but closes above its midpoint.
- **Interpretation**: It indicates a potential bullish reversal after a downtrend.
6. **Dark Cloud Cover**:
- The **Dark Cloud Cover** is the opposite of the Piercing Pattern. It consists of a long green candlestick followed by a long red candlestick that opens above the high of the green candle but closes below its midpoint.
- **Interpretation**: It signals a potential bearish reversal after an uptrend.
#### **Key Takeaways and Practical Use**:
1. **Trend Reversal**: Many candlestick patterns indicate potential **trend reversals**. For example, **Hammer**, **Shooting Star**, **Engulfing Patterns**, **Morning/Evening Stars**, and **Harami** patterns are all signs of a possible shift in market sentiment and trend direction.
2. **Trend Continuation**: Some patterns indicate that the existing trend is likely to continue, such as **Bullish Engulfing** in an uptrend or a **Bearish Engulfing** in a downtrend.
3. **Context is Key**: Candlestick patterns work best when interpreted in the context of the broader market trend. For instance, a **Hammer** pattern after a prolonged downtrend might be more significant than one appearing in a sideways or uptrend market.
4. **Confirmation**: It’s often advisable to wait for confirmation of a candlestick pattern before taking action. This could mean waiting for the price to close beyond a certain level or using additional technical indicators (like **RSI**, **MACD**, or **Moving Averages**) to confirm the signal.
5. **Risk Management**: Like all trading strategies, candlestick pattern analysis should be used with **risk management techniques** (such as **stop-loss** orders) to minimize potential losses in case the pattern fails.
### Conclusion:
Candlestick patterns are a vital part of technical analysis, offering valuable insights into market sentiment and potential future price movements. By understanding the significance of individual candlesticks and multi-candle patterns, traders can make more informed decisions. However, candlestick patterns should be used in combination with other tools and indicators to improve accuracy and avoid false signals.

What is macd divergence ?**MACD Divergence** refers to a situation in technical analysis where the **MACD indicator** (Moving Average Convergence Divergence) and the price of an asset move in opposite directions. Divergence can provide valuable clues about potential trend reversals or weakening trends, as it signals that the current price trend may not be sustainable.
The **MACD** is a popular momentum indicator that shows the relationship between two moving averages of a security’s price: the **12-day exponential moving average (EMA)** and the **26-day EMA**. The **MACD line** is the difference between these two EMAs, and the **signal line** is the 9-day EMA of the MACD line.
### Types of MACD Divergence:
1. **Bullish Divergence** (Reversal to the Upside)
2. **Bearish Divergence** (Reversal to the Downside)
#### **1. Bullish Divergence**:
- **Definition**: Bullish divergence occurs when the price of an asset makes **lower lows** (indicating a downtrend), but the MACD forms **higher lows**. This indicates that while the price is falling, the momentum is weakening, suggesting that the downtrend might be losing steam, and a reversal to the upside could be coming.
- **Interpretation**: Bullish divergence can signal a potential **trend reversal** from bearish to bullish. Traders might look for **buy signals** or consider entering long positions when this occurs.
- **Example**: The price forms lower lows, but the MACD shows higher lows. This divergence suggests that selling pressure is weakening, and the price might soon start moving upward.
#### **2. Bearish Divergence**:
- **Definition**: Bearish divergence occurs when the price of an asset makes **higher highs** (indicating an uptrend), but the MACD forms **lower highs**. This indicates that while the price is rising, the momentum is weakening, suggesting that the uptrend may be running out of steam and a reversal to the downside could occur.
- **Interpretation**: Bearish divergence signals a potential **trend reversal** from bullish to bearish. Traders may look for **sell signals** or consider entering short positions when this occurs.
- **Example**: The price forms higher highs, but the MACD shows lower highs. This divergence suggests that buying pressure is weakening, and the price might soon start moving downward.
### How to Identify MACD Divergence:
1. **Price Action**: Look at the price chart and identify whether the price is making higher highs or lower lows.
2. **MACD Indicator**: Observe the MACD line and see if it is making higher highs or lower lows. Compare the movement of the MACD with the price action.
3. **Divergence**: If the price and MACD are moving in opposite directions (e.g., higher highs in price but lower highs in MACD), you have a potential divergence.
### Example of Bullish Divergence:
- **Price**: The stock is making lower lows, meaning the price is declining.
- **MACD**: The MACD is making higher lows, indicating that the momentum behind the downtrend is weakening.
- **Conclusion**: A bullish divergence suggests that the downtrend may be ending and that a reversal to the upside is possible.
### Example of Bearish Divergence:
- **Price**: The stock is making higher highs, meaning the price is climbing.
- **MACD**: The MACD is making lower highs, signaling that the momentum of the uptrend is weakening.
- **Conclusion**: A bearish divergence suggests that the uptrend may be reaching its peak, and a reversal to the downside is likely.
### How to Trade Using MACD Divergence:
1. **Confirm Divergence**: Look for clear divergence between the MACD and price action. For bullish divergence, the price should be making lower lows, while the MACD forms higher lows. For bearish divergence, the price should be making higher highs, while the MACD forms lower highs.
2. **Wait for Confirmation**: Divergence alone is not a guarantee of a reversal. After identifying the divergence, traders should wait for further confirmation, such as:
- **Crossovers**: A MACD crossover above or below the signal line (bullish crossover or bearish crossover) can confirm the reversal.
- **Candlestick Patterns**: Look for reversal candlestick patterns (like **Engulfing** or **Doji**) near the divergence point to confirm the potential change in trend.
3. **Set Entry and Exit Points**:
- For **bullish divergence**, you may consider entering a long position once the price starts moving above the previous resistance level or shows bullish momentum.
- For **bearish divergence**, you may consider entering a short position when the price starts falling below the previous support level or shows bearish momentum.
4. **Risk Management**: Always use **stop-loss orders** to protect against unexpected price movements. For example, you could place a stop loss just below the recent low (for long positions) or above the recent high (for short positions).
### Pros and Cons of MACD Divergence:
#### **Pros**:
- **Early Reversal Signals**: MACD divergence can help identify potential trend reversals early, giving traders a chance to enter at more favorable prices.
- **Widely Used**: MACD is one of the most commonly used indicators, making divergence patterns familiar and useful across many financial markets.
- **Works Well in Trending Markets**: MACD divergence is particularly effective in trending markets (both bullish and bearish) where momentum can change direction.
#### **Cons**:
- **Lagging Indicator**: The MACD is a lagging indicator, meaning it is based on past price action, so the divergence might not signal a reversal until after some of the move has already occurred.
- **False Signals in Range-Bound Markets**: Divergence in range-bound or choppy markets can lead to **false signals**, as the price may not follow through on the divergence, causing losses.
- **Not Always Reliable**: Divergence does not guarantee a trend reversal. The price can continue in the same direction, or the divergence may be part of a consolidation phase rather than a true reversal.
### Conclusion:
MACD divergence is a powerful tool used by technical analysts to spot potential trend reversals by observing the relationship between price action and momentum. **Bullish divergence** suggests a potential reversal from a downtrend to an uptrend, while **bearish divergence** suggests a potential reversal from an uptrend to a downtrend. However, it’s essential to confirm divergence signals with other indicators and patterns before making trading decisions, as divergence alone may not always lead to a reversal. Proper risk management and confirmation techniques can improve the effectiveness of trading using MACD divergence.

what is momentum trading ?**Momentum trading** is a strategy in which traders buy assets that are trending upwards (bullish momentum) and sell or short assets that are trending downwards (bearish momentum). The underlying principle of momentum trading is that **prices that are moving in a certain direction will continue to do so** for some time, as market participants continue to push the price in that direction.
### Key Concepts of Momentum Trading:
1. **Momentum**:
- Momentum refers to the rate of acceleration or speed of price changes in an asset. In momentum trading, traders try to capitalize on **strong price movements** by following the current trend.
- The idea is that once an asset starts moving in one direction (up or down), it will continue in that direction due to market psychology, institutional buying or selling, and momentum among other traders.
2. **Trend Following**:
- Momentum traders follow the **trend**, whether it’s bullish (uptrend) or bearish (downtrend), believing that the momentum will persist in the direction of the current trend.
- The goal is to enter trades when an asset shows signs of gaining momentum and exit when the momentum starts to fade or reverse.
3. **Time Horizon**:
- Momentum trading can be employed in both **short-term** (intraday, daily, or weekly) and **medium-term** (weeks or months) timeframes.
- The time horizon depends on the trader's strategy, but momentum traders typically look for quick price movements over a short to medium period.
4. **Entry and Exit Points**:
- **Entry**: Momentum traders typically enter a trade when they observe strong price movement and volume that indicate the momentum is building.
- **Exit**: Traders exit the trade when the momentum starts to weaken or reverse. This can be identified using technical indicators, patterns, or price action signals.
### Tools and Indicators Used in Momentum Trading:
1. **Technical Indicators**:
- **Moving Averages (MAs)**: Traders use moving averages to identify the overall trend. A crossover of short-term moving averages (e.g., 10-day) over long-term moving averages (e.g., 50-day) is a common signal to buy.
- **Relative Strength Index (RSI)**: RSI helps traders identify whether an asset is overbought or oversold. In momentum trading, an RSI over 70 (overbought) might indicate the momentum is weakening, and an RSI below 30 (oversold) could signal a potential reversal.
- **Moving Average Convergence Divergence (MACD)**: The MACD helps identify momentum shifts by comparing short-term and long-term moving averages. A bullish crossover or a bearish crossover can signal the beginning of a momentum-driven move.
- **Bollinger Bands**: If the price is trading near the upper Bollinger Band, it indicates strong upward momentum, while trading near the lower band indicates strong downward momentum.
- **Volume**: Volume is a key indicator in momentum trading. A price move accompanied by high volume signals stronger momentum, while low volume suggests weak momentum.
2. **Chart Patterns**:
- **Breakouts**: When an asset breaks through a key resistance level, momentum traders may buy, expecting the price to continue rising.
- **Pullbacks**: After a strong rally, a minor pullback can provide an entry point for momentum traders, who may look for the price to resume its upward movement.
3. **Candlestick Patterns**:
- **Bullish Candlestick Patterns**: Traders look for bullish patterns like **engulfing**, **morning star**, or **hammer** that suggest a continuation of upward momentum.
- **Bearish Candlestick Patterns**: Conversely, bearish patterns like **evening star**, **shooting star**, or **dark cloud cover** can signal weakening momentum or a potential reversal to the downside.
### How Momentum Trading Works:
1. **Identifying the Trend**:
- Momentum traders start by identifying stocks or assets that are showing strong price movements, typically those that have been trending in one direction for some time.
- Traders use technical indicators like **RSI**, **MACD**, and moving averages to spot whether the asset is in an uptrend or downtrend.
2. **Entry Point**:
- The trader enters a position when they observe strong momentum, ideally after a small pullback or consolidation during an uptrend (for buying) or a rally during a downtrend (for selling/shorting).
- An entry might also be triggered by a **breakout** above resistance (buy) or below support (sell/short).
3. **Exiting the Trade**:
- Traders exit when the momentum starts to fade or reverse, often indicated by a decrease in price volatility, a change in technical indicators (e.g., MACD crossover), or price reaching a target level.
- Some traders use **trailing stops** (stop-loss orders that move with the price) to protect profits while allowing the trade to run as long as momentum continues.
4. **Risk Management**:
- Since momentum trading can be volatile, risk management is crucial. Traders often use **stop-loss orders** to limit losses if the momentum reverses unexpectedly.
- Position sizing and maintaining a favorable risk-to-reward ratio (e.g., risking $1 to make $2) is essential to managing the inherent risks in momentum trading.
### Types of Momentum Traders:
1. **Day Traders**:
- Day traders who use momentum strategies typically hold positions for minutes or hours, capitalizing on intraday price movements. They focus on assets that exhibit rapid momentum within a single trading day.
2. **Swing Traders**:
- Swing traders use momentum to hold positions for a few days or weeks, aiming to capture price swings. They enter trades when momentum is strong and exit when the momentum begins to fade.
3. **Position Traders**:
- Position traders who use momentum strategies might hold positions for months, especially in stocks or assets that are in a long-term strong trend. They focus on longer-term momentum-driven price moves.
### Advantages of Momentum Trading:
1. **Profitable During Strong Trends**:
- Momentum trading works particularly well in markets that exhibit strong trends, either bullish or bearish, as momentum traders can ride the wave of the trend to capture profits.
2. **Clear Entry and Exit Points**:
- Momentum strategies often provide clear signals, using technical indicators and chart patterns, making it easier for traders to decide when to enter or exit a trade.
3. **Leverages Market Psychology**:
- Momentum trading capitalizes on the psychology of other traders. When more traders follow the trend, the price often continues to move in the same direction, creating a self-fulfilling prophecy.
### Disadvantages of Momentum Trading:
1. **Risk of Reversals**:
- Momentum trading can be risky because trends can reverse suddenly. A trend that seems to have strong momentum might quickly lose steam, leading to losses if the trader is caught on the wrong side.
2. **Volatility**:
- Momentum stocks or assets can be very volatile, especially when there is high trading volume. Sudden price swings can cause sharp losses if the trader is not careful.
3. **Requires Quick Decision Making**:
- Momentum trading demands quick action and the ability to make decisions under pressure. The momentum may change quickly, and failing to act swiftly could result in missing opportunities or losing out.
4. **False Signals**:
- Sometimes, momentum indicators and chart patterns can give false signals. A price may appear to be moving in a strong direction but may reverse unexpectedly due to market conditions or news events.
### Conclusion:
Momentum trading is a strategy where traders aim to profit from the continuation of existing price trends. By identifying assets with strong momentum, entering trades at the right time, and exiting when momentum fades, traders attempt to capture significant price moves in a short-to-medium timeframe. However, this strategy requires careful attention to technical indicators, chart patterns, and risk management, as the markets can be volatile, and momentum can shift quickly. It’s a strategy that works well in trending markets but carries risks in choppy or range-bound conditions.

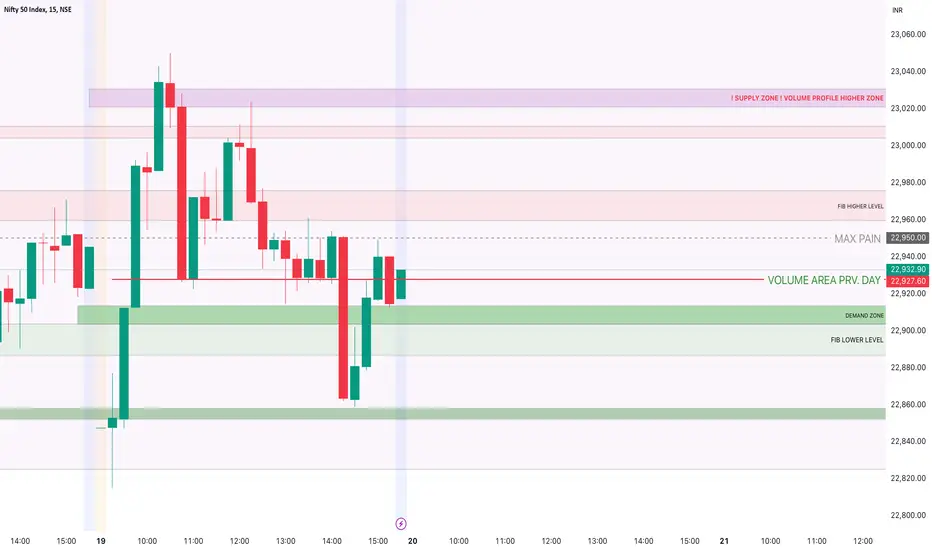
NIFTY IMPORTANT LEVELS FOR 20.02.2025important levels for nifty for intraday. important levels on the chart has beem marked and just observe how good these levels will react.
what is vwap statergy ?**VWAP (Volume-Weighted Average Price)** is a popular trading indicator that represents the average price of a security, weighted by volume, over a specific time period (usually a trading day). The VWAP strategy is a technique used by traders to determine the average price at which an asset has traded throughout the day, factoring in both the price and volume of the trades. It is particularly useful for assessing the fairness of the current price relative to the overall trading activity and volume during the day.
### How VWAP Works:
- **VWAP** is calculated by taking the sum of the value of all trades (price × volume) over a specific time period and then dividing that sum by the total volume for that period. The result is the average price at which the asset has traded, weighted by volume.
The formula for VWAP is:
\
Where:
- **Price** = the price at which the asset was traded.
- **Volume** = the number of shares/contracts traded at that price.
### Key Points:
1. **Time Frame**: VWAP is typically calculated for each trading day, and it resets at the start of each new day.
2. **Volume-Weighted**: Unlike a simple moving average (SMA), VWAP considers volume in its calculation, which gives more weight to prices where more trades have occurred.
3. **Dynamic Indicator**: VWAP moves throughout the day as new trades occur, making it a dynamic, real-time indicator.
### VWAP Strategy:
Traders use VWAP as a reference point to make trading decisions, particularly in **intraday** trading. The key idea is that prices above or below VWAP can signal bullish or bearish conditions, respectively. Here are some of the ways the VWAP strategy is typically used:
#### 1. **VWAP as a Trend Indicator**:
- **Above VWAP**: If the price is trading **above** the VWAP, it is considered to be in a **bullish trend**. Traders may look for long (buy) opportunities as this suggests that the market is generally in an uptrend.
- **Below VWAP**: If the price is trading **below** the VWAP, it is considered to be in a **bearish trend**. Traders may look for short (sell) opportunities as this suggests the market is in a downtrend.
#### 2. **VWAP as Support/Resistance**:
- The **VWAP line** can act as **support** in an uptrend and as **resistance** in a downtrend. If the price is moving higher and retraces towards the VWAP, traders may look for buying opportunities near the VWAP, expecting the price to bounce off the VWAP and continue upwards.
- Conversely, if the price is falling and retraces towards the VWAP in a downtrend, traders may look for selling opportunities, anticipating the VWAP to act as resistance and the price to continue downwards.
#### 3. **VWAP and Reversals**:
- **Reversal Signal**: A reversal from the VWAP can be a significant signal for a change in trend. For example:
- If the price has been below the VWAP and suddenly crosses above it, traders may interpret this as a **bullish reversal** and look for long entry points.
- Conversely, if the price has been above the VWAP and suddenly crosses below it, traders may interpret this as a **bearish reversal** and look for short entry points.
#### 4. **VWAP Crossovers**:
- **Bullish Crossover**: When the price crosses above the VWAP from below, it can be a sign that buying momentum is building, and traders may use this as a **buy signal**.
- **Bearish Crossover**: When the price crosses below the VWAP from above, it can signal that selling pressure is increasing, and traders may interpret it as a **sell signal**.
#### 5. **VWAP and Volume**:
- VWAP works well in conjunction with **volume analysis**. High volume during a price move above the VWAP suggests strong buying interest and can confirm the strength of the trend.
- Low volume while the price is near the VWAP can indicate lack of conviction, suggesting that the price may stay near VWAP or move sideways until stronger volume emerges.
### Advantages of VWAP Strategy:
1. **Helps Identify Trend Strength**: VWAP allows traders to determine whether the market is trending up or down and helps confirm whether the trend has strength based on price relative to VWAP.
2. **Good for Intraday Trading**: VWAP is especially useful for **day traders**, as it gives real-time information on the average price level for the day, helping them make decisions based on the broader market's movement.
3. **Provides Context for Entry and Exit Points**: VWAP helps traders decide when to enter or exit trades. Prices near or at VWAP can present buying or selling opportunities, depending on the broader trend.
4. **Objective Indicator**: Since VWAP is calculated objectively based on price and volume, it removes emotion from the trading decision and provides clear signals that traders can rely on.
### Disadvantages of VWAP Strategy:
1. **Lagging Indicator**: Since VWAP uses past price and volume data, it can be a **lagging indicator**, meaning it reacts to price movements rather than predicting them. As a result, it might be slower to react to fast-changing market conditions.
2. **Not Suitable for Long-Term Trading**: VWAP is best suited for **intraday trading** or short-term trades, as it resets at the beginning of each trading day. It is not ideal for swing traders or long-term investors.
3. **Whipsaw in Choppy Markets**: In volatile or sideways markets, VWAP can produce false signals. For example, if the price is bouncing around the VWAP in a range-bound market, it might generate many false breakouts or crossovers that lead to losses.
4. **Requires Other Indicators**: While VWAP can provide valuable signals, it is often more effective when used in combination with other indicators, such as **RSI**, **MACD**, or **Moving Averages**, to confirm trends and signals.
### Practical Example of VWAP Strategy:
Let's say you're trading a stock during the day, and the price has been trending **above the VWAP** for most of the morning, indicating a bullish sentiment. You then notice that the stock experiences a pullback towards the VWAP, but instead of falling below it, the price holds steady or bounces back higher, signaling continued bullish momentum.
In this scenario, you might:
- **Buy the stock near the VWAP** as the pullback to VWAP is acting as support.
- **Set a stop-loss just below the VWAP** to protect against a reversal in case the price fails to hold above it.
- **Target a price level above the VWAP**, following the continuation of the bullish trend.
If the price moves **below VWAP**, this could be a signal to **exit the trade** or even **short the stock** (if you trade in a downtrend), depending on your strategy and risk tolerance.
### Conclusion:
The **VWAP strategy** is a highly effective tool for intraday traders to identify the direction of the market and spot entry and exit points based on the volume-weighted average price. It works best when used as part of a broader strategy, incorporating trend-following principles and confirming signals from other indicators. However, traders must be cautious of its lagging nature and adapt the strategy to the prevailing market conditions, especially in volatile or range-bound markets.

what is option chain pcr ?**Option Chain PCR (Put-Call Ratio)** is a popular metric used by traders and investors to gauge market sentiment and make decisions regarding the strength of a market move. It’s derived from the **option chain**, which is a listing of all the available **call** and **put** options for a specific asset (e.g., stocks, indices) and their various strike prices and expiration dates.
### Key Concepts of Option Chain PCR:
1. **Put-Call Ratio (PCR)**:
- The **Put-Call Ratio** is the ratio of the total number of **put options** (bearish bets) to the total number of **call options** (bullish bets) traded in the market for a specific underlying asset, during a particular time period (like a day or week).
- The formula for PCR is:
\
Where:
- **Total Puts Open Interest**: The total open interest (the number of outstanding contracts) for put options.
- **Total Calls Open Interest**: The total open interest for call options.
2. **Interpretation of PCR**:
- **PCR > 1**: If the PCR is greater than 1, it indicates that there are more put options being traded compared to call options. This suggests a **bearish sentiment** in the market, as traders are anticipating a potential decline in the underlying asset's price.
- **PCR < 1**: If the PCR is less than 1, it indicates that there are more call options being traded compared to put options. This suggests a **bullish sentiment**, as traders expect the price of the underlying asset to rise.
- **PCR = 1**: A PCR of 1 indicates a neutral sentiment, meaning the number of calls and puts is balanced, showing no strong directional bias from the options market.
3. **What PCR Can Tell You**:
- **Bullish Sentiment**: A low PCR (below 1) often indicates that traders are more inclined toward buying call options, which reflects a positive outlook on the asset. The market participants are expecting an upward movement in the price.
- **Bearish Sentiment**: A high PCR (above 1) usually signals that more traders are buying put options, indicating a bearish outlook. It suggests that the market expects a decline in the price of the asset.
- **Contrarian Indicator**: The PCR can also be a **contrarian indicator**. For example, when the PCR is extremely high (indicating heavy bearish sentiment), it could signal that the market is overly pessimistic and a potential reversal to the upside could occur. Similarly, an extremely low PCR might suggest that the market is overly optimistic, and a price correction or reversal could be imminent.
4. **PCR in Context**:
- The PCR can be more useful when analyzed in conjunction with other factors. For example:
- **High PCR during a market selloff**: It may indicate that the market is reaching extreme pessimism, and a reversal could be on the horizon.
- **Low PCR during a market rally**: It might suggest overconfidence, and a pullback or correction could be possible.
5. **PCR on Different Timeframes**:
- **Daily PCR**: Measures the sentiment based on daily option activity, often reflecting short-term sentiment.
- **Weekly/Monthly PCR**: Provides a broader perspective on market sentiment over a longer horizon. For long-term investors, looking at the weekly or monthly PCR can provide insights into general market sentiment and expectations.
### How to Use Option Chain PCR in Trading:
1. **Market Sentiment Analysis**:
- PCR is a tool for assessing overall **market sentiment** and helps traders understand whether the market is currently dominated by bulls (call buyers) or bears (put buyers). This helps in forming a general view of market direction.
2. **Spotting Market Extremes**:
- A very **high PCR** (e.g., above 1.5 or 2) could indicate excessive pessimism and might signal an **oversold condition**, suggesting that the market is due for a reversal to the upside.
- A very **low PCR** (e.g., below 0.5 or 0.4) could indicate excessive optimism and could point to an **overbought condition**, suggesting the market might be due for a pullback or reversal.
3. **Trend Confirmation**:
- If the PCR is rising steadily in a bull market, it can indicate that the market is becoming increasingly bearish, and a reversal could be imminent.
- Conversely, a rising PCR during a bear market could indicate growing bullish sentiment, signaling the possibility of a reversal or market bottom.
4. **Combination with Other Indicators**:
- The PCR should ideally be combined with other technical indicators like **Moving Averages**, **RSI**, and **MACD** to confirm trends and avoid false signals.
- **Open interest data** (how many contracts are open) in addition to PCR can also provide additional confirmation about the strength of a trend.
### Example of Using PCR:
1. **Bullish Market**:
- You notice that the PCR has been consistently **below 1** during a market rally, indicating that traders are buying more calls than puts, reflecting strong bullish sentiment.
- The PCR moves even lower, indicating extreme optimism, but no significant signs of reversal in price are seen. In this case, the PCR supports the continuation of the bullish trend.
2. **Bearish Market**:
- During a market correction or downtrend, the PCR is consistently **above 1**, suggesting that more traders are buying puts, and the market sentiment is largely bearish.
- If the PCR becomes **extremely high**, this could indicate **overbought conditions** in terms of bearish sentiment, suggesting that the market may be oversold and could reverse.
### Conclusion:
The **Option Chain PCR (Put-Call Ratio)** is a valuable tool for measuring market sentiment, providing insights into whether the market is overly bullish or bearish. A high PCR indicates bearish sentiment, while a low PCR suggests bullish sentiment. The PCR can help traders assess the likelihood of a market reversal, but it should be used in conjunction with other technical analysis tools and indicators to get a more comprehensive view of the market. It's also important to note that extreme values in PCR (both high and low) could signal a potential change in trend or price direction, but this should be verified with other confirmation signals.

what is technical analysis ?**Technical analysis** is the study of past market data, primarily **price and volume**, to forecast future price movements. It involves using historical price charts, patterns, and various technical indicators to make informed trading or investment decisions. The fundamental premise behind technical analysis is that all information (including news, earnings, and economic data) is reflected in the price, and price moves in trends that are likely to continue.
### Key Concepts in Technical Analysis:
1. **Price Charts**:
- Price charts are the foundation of technical analysis. The most common types of charts are **line charts**, **bar charts**, and **candlestick charts**.
- **Line Chart**: Shows the closing prices over time, making it simple but less informative.
- **Bar Chart**: Shows the open, high, low, and close (OHLC) for each period.
- **Candlestick Chart**: Similar to bar charts but visually more appealing and easy to interpret, showing the same OHLC data.
2. **Trends**:
- Technical analysis is based on the idea that prices move in trends. A trend is defined as the general direction in which the market is moving.
- **Uptrend**: A series of higher highs and higher lows.
- **Downtrend**: A series of lower highs and lower lows.
- **Sideways Trend**: A flat or consolidating market where the price moves within a range.
3. **Support and Resistance**:
- **Support** is a price level at which demand is strong enough to prevent the price from falling further.
- **Resistance** is a price level at which selling is strong enough to prevent the price from rising further.
- Price tends to bounce off support and resistance levels, making them important for identifying entry or exit points.
4. **Volume**:
- **Volume** refers to the number of shares or contracts traded during a specific period. High volume confirms the strength of a price movement, while low volume can indicate a lack of conviction in the price direction.
5. **Technical Indicators**:
- Technical indicators are mathematical calculations based on price and volume that help traders analyze market conditions. Some commonly used technical indicators include:
- **Moving Averages** (Simple Moving Average - SMA, Exponential Moving Average - EMA)
- **Relative Strength Index (RSI)**
- **Moving Average Convergence Divergence (MACD)**
- **Bollinger Bands**
- **Stochastic Oscillator**
- **Average Directional Index (ADX)**
6. **Chart Patterns**:
- **Chart patterns** are shapes or formations in price charts that signal potential price movements. These patterns often reflect market psychology and can be used to predict future trends. Some common chart patterns include:
- **Head and Shoulders**
- **Double Top and Double Bottom**
- **Triangles** (Symmetrical, Ascending, Descending)
- **Flags and Pennants**
- **Cup and Handle**
7. **Candlestick Patterns**:
- **Candlestick patterns** are formed by one or more candles and can signal a reversal or continuation in the market. Examples include:
- **Doji**: Signals indecision in the market.
- **Engulfing Pattern**: Indicates a reversal, either bullish or bearish.
- **Hammer** and **Hanging Man**: Potential reversal patterns.
- **Morning Star** and **Evening Star**: Reversal patterns often indicating bullish or bearish changes.
8. **Momentum**:
- Momentum measures the strength of a price movement. It helps traders determine if a trend is strong or losing steam. Common momentum indicators include the **RSI**, **Stochastic Oscillator**, and **MACD**.
9. **Risk Management**:
- Risk management is an essential part of technical analysis. Traders often use tools like **stop-loss orders** and **take-profit levels** to manage their trades and protect themselves from large losses.
- Proper risk-to-reward ratios are also important. A trader might aim for a reward that is two or three times the risk taken on a trade.
### Principles Behind Technical Analysis:
1. **Price Discounts Everything**:
- According to technical analysis, all information (public or private) is reflected in the price. This includes economic factors, news, earnings, and even market sentiment.
2. **Price Moves in Trends**:
- Price tends to move in trends, whether they are upward, downward, or sideways. Identifying the trend is key in technical analysis because trends tend to continue until proven otherwise.
3. **History Tends to Repeat Itself**:
- Market psychology often repeats itself. Traders and investors tend to react similarly to certain situations, creating recurring price patterns and trends.
### How Technical Analysis is Used:
1. **Short-Term Trading (Day Trading, Swing Trading)**:
- Traders often use technical analysis for short-term trading, including day trading and swing trading, to identify entry and exit points based on price movements and patterns.
- Indicators like RSI, MACD, and moving averages are commonly used to gauge market momentum and timing.
2. **Long-Term Investing**:
- Even long-term investors use technical analysis to identify key levels of support and resistance, understand market cycles, and make buy/sell decisions based on long-term trends.
- For example, investors may look for "buy the dip" opportunities when the price hits key support levels.
3. **Market Timing**:
- Traders use technical analysis to predict the best time to enter or exit a position. By analyzing patterns and indicators, they try to capture short-term price movements in trending or range-bound markets.
### Benefits of Technical Analysis:
1. **Objectivity**: Technical analysis provides clear signals, which can help reduce emotional decision-making.
2. **Versatility**: It can be applied to all types of markets (stocks, forex, commodities, crypto, etc.) and across different timeframes (from minutes to years).
3. **Quantitative**: It relies on measurable data (price and volume), which can be analyzed using charts and indicators.
4. **Pattern Recognition**: By recognizing certain patterns and setups, traders can anticipate market moves and increase their chances of successful trades.
### Limitations of Technical Analysis:
1. **Lagging Indicators**: Many technical indicators are based on past price data, so they might not provide timely signals during fast-moving markets.
2. **False Signals**: Technical analysis is not foolproof. It can sometimes give false or misleading signals, especially in choppy or sideways markets.
3. **Subjectivity**: Although technical analysis relies on objective data, chart patterns and signals can sometimes be interpreted differently by different traders.
4. **No Fundamentals**: Technical analysis does not consider the underlying fundamentals of an asset, such as financial health, earnings reports, or macroeconomic factors. This can be a disadvantage when market movements are driven by news or fundamental events.
### Conclusion:
Technical analysis is a widely used method for analyzing and forecasting price movements by examining historical price data, volume, chart patterns, and technical indicators. It's primarily used for identifying trends, entry and exit points, and managing risk. While it has its strengths, such as providing clear signals and being versatile across different markets and timeframes, it also has limitations, including its reliance on past data and the potential for false signals. Traders and investors often use technical analysis in combination with fundamental analysis and solid risk management techniques to make more informed decisions.

what is rsi and how it is useful?The **RSI (Relative Strength Index)** is a popular momentum oscillator used in technical analysis to measure the strength and speed of a price movement. It was developed by **J. Welles Wilder** and is used to determine whether an asset is overbought or oversold, helping traders identify potential reversal points or continuation signals.
### 1. **How RSI Works**:
- The RSI is calculated using the formula:
\
Where **RS** (Relative Strength) is the average of **n** days' up closes divided by the average of **n** days' down closes.
- **RS = (Average Gain) / (Average Loss)** over a specified period, typically 14 periods (which is the default setting).
- The RSI ranges from **0 to 100**, and the most commonly used levels for interpreting the RSI are:
- **Overbought**: RSI above 70, indicating that the asset may be overbought and a price correction or reversal could happen.
- **Oversold**: RSI below 30, suggesting that the asset may be oversold, and a potential upward reversal or bounce could occur.
However, the overbought and oversold levels are not absolute; they vary depending on the asset, market conditions, and timeframe.
### 2. **RSI Interpretations**:
- **RSI above 70 (Overbought)**:
- An RSI above 70 suggests that an asset may be **overbought**, meaning it has experienced a strong rally and could be due for a pullback or price correction.
- However, assets can remain overbought for extended periods in strong uptrends, so it doesn't necessarily mean the asset will reverse immediately.
- **RSI below 30 (Oversold)**:
- An RSI below 30 indicates that an asset may be **oversold**, meaning it has likely experienced a sharp decline and could be due for a rebound.
- Like overbought conditions, oversold conditions can persist for a while in strong downtrends, so caution is advised when interpreting oversold readings.
- **RSI between 30 and 70**:
- An RSI between 30 and 70 indicates that the asset is **neither overbought nor oversold**. In this range, the market is often considered to be in a neutral state, where trends can continue or pull back based on other factors.
### 3. **How to Use RSI in Trading**:
- **Overbought/Oversold Conditions**:
- **Buy Signal**: When RSI falls below 30 (oversold) and then crosses back above it, it may signal a **potential buying opportunity**, suggesting a reversal or a bounce.
- **Sell Signal**: When RSI rises above 70 (overbought) and then crosses below it, it could indicate a **potential selling opportunity**, suggesting that the asset might reverse or experience a pullback.
- **Divergence**:
- **Bullish Divergence**: Occurs when the price forms a lower low, but the RSI forms a higher low. This can indicate that the downward momentum is weakening, and a potential upward reversal may occur.
- **Bearish Divergence**: Occurs when the price forms a higher high, but the RSI forms a lower high. This suggests that the upward momentum is weakening, and a potential downward reversal may occur.
- **RSI with Trendlines**:
- Traders can also draw **trendlines** on the RSI chart itself. If RSI breaks a trendline to the upside in a downtrend, or to the downside in an uptrend, it could signal a shift in momentum or a potential reversal in price.
- **RSI and Trend Confirmation**:
- **RSI in Uptrends**: In an uptrend, the RSI tends to stay above 30 and often fluctuates between 40 and 70. Traders may wait for an RSI pullback to 40–50 as a potential buying opportunity.
- **RSI in Downtrends**: In a downtrend, the RSI often stays below 70 and fluctuates between 30 and 60. A rally in the RSI towards 60 or 70 might provide a potential sell opportunity.
### 4. **RSI Settings**:
- While the default setting for the RSI is 14 periods, traders can adjust this number depending on the timeframe they are analyzing.
- **Shorter periods (e.g., 7 or 10)** will make the RSI more sensitive, providing more signals but also more noise.
- **Longer periods (e.g., 21 or 28)** will make the RSI smoother and less responsive, which might be better for identifying longer-term trends.
### 5. **Example of Using RSI in Trading**:
- Suppose you are analyzing a stock in an uptrend. The stock price has been rising steadily for the past few days, and the RSI reaches above **70**, indicating overbought conditions.
- You might wait for the RSI to **drop below 70**, and then look for a **bearish reversal candle** (e.g., a doji or engulfing candle) on the price chart. This could be a signal to sell or short the stock, anticipating a pullback.
- Alternatively, in a downtrend, the RSI falls below **30**, indicating the stock is oversold. After a brief rally, the RSI crosses back above **30**, and the stock starts showing signs of support. This could be a potential buy signal.
### 6. **RSI Limitations**:
- **False Signals in Strong Trends**: In strong trends (both up and down), RSI can remain in overbought (above 70) or oversold (below 30) territory for extended periods. Traders should be cautious and not rely solely on RSI signals in such conditions.
- **Lagging Indicator**: Like many technical indicators, RSI is a **lagging indicator**—it reacts to price changes, rather than predicting them. This can sometimes result in late signals.
- **Range-Bound Markets**: RSI is most effective in range-bound or consolidating markets. In trending markets, the oscillator can be less reliable, as prices can remain in overbought or oversold conditions for long periods.
### 7. **Combining RSI with Other Indicators**:
- **Moving Averages**: Use RSI with moving averages (e.g., 50-day, 200-day) to confirm trends. For example, you might wait for an RSI confirmation after the price crosses above a moving average.
- **MACD (Moving Average Convergence Divergence)**: Combining RSI with the MACD indicator can give better clarity on the trend's strength and momentum.
- **Support and Resistance Levels**: Use RSI in conjunction with support and resistance levels. A reversal from overbought or oversold conditions near key price levels can be more significant.
### 8. **Conclusion**:
The RSI is a versatile and widely used momentum oscillator in technical analysis. It helps traders gauge whether an asset is overbought or oversold and identifies potential reversal points or trend continuations. While the RSI is effective in many market conditions, it’s important to use it in conjunction with other indicators and tools, and to consider the overall market context, especially during strong trends. Proper risk management is essential when using RSI to ensure the best trading decisions.

what is price action ?**Price action** refers to the movement of an asset’s price over time, depicted through charts. It is the study of historical price data to make trading decisions, without relying on technical indicators or other external tools. In other words, price action traders focus purely on the price itself—its patterns, trends, and movements—believing that all necessary information is contained within the price action.
### Key Concepts in Price Action:
1. **Candlestick Patterns**:
- **Candlestick charts** are commonly used in price action analysis. These charts show the open, high, low, and close prices for a given time period.
- Certain candlestick patterns (like Doji, Engulfing, Hammer, or Shooting Star) are used to identify potential market reversals or continuations.
2. **Support and Resistance**:
- **Support** is the price level at which an asset tends to find buying interest, causing the price to bounce upward.
- **Resistance** is the price level at which an asset tends to encounter selling pressure, causing the price to move lower.
- Price action traders often watch these levels to predict potential reversals or breakouts.
3. **Trends**:
- Price action trading is largely based on understanding market trends (uptrends, downtrends, or sideways movement).
- Traders use **higher highs and higher lows** in an uptrend, and **lower highs and lower lows** in a downtrend to identify and trade with the trend.
- The idea is to "trade with the trend" rather than against it, as trends tend to persist over time.
4. **Price Patterns**:
- Traders look for recurring price patterns such as **triangles**, **flags**, **head and shoulders**, **double tops**, and **double bottoms**. These patterns help in forecasting future price movements.
- For instance, a **double top** pattern (a resistance level followed by a pullback, then another attempt to break the resistance) can signal a potential bearish reversal.
5. **Market Structure**:
- **Higher highs** and **higher lows** indicate an uptrend.
- **Lower highs** and **lower lows** indicate a downtrend.
- A trader’s goal is to identify the structure of the market and trade based on whether it’s in an uptrend, downtrend, or consolidation phase.
6. **Breakouts and Pullbacks**:
- **Breakouts** occur when the price moves beyond a defined support or resistance level, signaling the start of a new trend.
- **Pullbacks** (or retracements) are temporary reversals within the existing trend, and traders often look to enter positions during pullbacks to trade in the direction of the trend.
### How to Use Price Action in Trading:
1. **Identify the Trend**:
- The first step in price action trading is identifying whether the market is trending (up, down, or sideways).
- In an uptrend, you’d typically look for buying opportunities when the price pulls back to a level of support or a previous low.
- In a downtrend, you’d look for selling opportunities at resistance or previous highs.
2. **Look for Key Levels**:
- Identify major **support** and **resistance** levels where price has historically reversed. These levels act as psychological barriers for traders, and price action often tends to react to them.
- **Breakouts** above resistance or below support can indicate the start of a new trend.
3. **Trade Patterns**:
- Watch for **candlestick patterns** (like pin bars, engulfing candles, or dojis) at key levels. These can act as signals for potential trend reversals or continuations.
- For example, a **bullish engulfing candle** at a support level could suggest the start of an uptrend, while a **bearish engulfing** at a resistance level could signal a downtrend.
4. **Wait for Confirmation**:
- Price action traders often wait for price to confirm a setup before entering a trade. For instance, if the price breaks above resistance, they may wait for a pullback to test the new support before entering a long trade.
5. **Risk Management**:
- Price action traders use **stop-loss** orders placed at logical levels based on the price structure (for example, below a recent low in an uptrend).
- **Position sizing** is also crucial. Since price action can often be subjective, it’s important to use proper risk management to avoid large losses.
### Benefits of Price Action Trading:
- **No Indicators Needed**: Price action trading is based purely on price data, making it simple and easy to follow, without relying on technical indicators.
- **Flexibility**: Price action can be used across different time frames, from minute charts to daily or weekly charts.
- **Versatility**: It works across all asset classes (stocks, forex, commodities, crypto, etc.), and it is ideal for both short-term and long-term traders.
- **Clear Signals**: Price action trading gives direct, clear signals based on price movements, which many traders find easier to interpret than complex indicators.
### Drawbacks of Price Action Trading:
- **Subjectivity**: Interpreting price action can sometimes be subjective, as it depends on the trader’s understanding of the price movements and patterns.
- **Requires Experience**: Price action trading involves a lot of nuance and requires experience to recognize and act on subtle price signals effectively.
- **Lack of Confirmation**: Without indicators, traders may sometimes miss the confirmation signals, leading to false or untimely trades.
### Example of Price Action in a Trade:
- A trader sees that a stock has been in a **bullish trend** for a few weeks (price making higher highs and higher lows).
- The stock pulls back to a level of **previous support** (a point where price has reversed before).
- At that support level, the trader notices a **bullish engulfing candlestick pattern** forming.
- The trader enters a **buy** position, placing a stop loss just below the support level, aiming to capture the next upward movement.
### Conclusion:
Price action trading is a straightforward yet powerful method for analyzing and trading markets based on price movements alone. By focusing on patterns, trends, and key price levels, traders can make decisions without relying on complex indicators. However, it does require a keen eye and experience to interpret price movements correctly, and it’s essential to combine it with sound risk management practices.

what is adx and how to use it ?**ADX (Average Directional Index)** is a technical indicator used to measure the strength of a trend, regardless of whether the trend is bullish or bearish. It’s part of the **Directional Movement System**, developed by J. Welles Wilder. ADX helps traders identify whether a market is trending or in a range-bound (sideways) phase, and how strong that trend is.
### 1. **Components of ADX**
The ADX indicator consists of three components:
- **ADX Line**: The main line that measures the strength of the trend.
- **+DI (Positive Directional Indicator)**: Shows the strength of upward price movement.
- **-DI (Negative Directional Indicator)**: Shows the strength of downward price movement.
These three components work together to give traders an overall sense of the market's direction and strength.
### 2. **How ADX Works**
- **ADX Line**:
- The ADX line itself ranges from 0 to 100, with the following interpretations:
- **0–25**: Weak or no trend. The market is range-bound or moving sideways.
- **25–50**: Moderate trend. The market is starting to develop a trend but it’s not overly strong yet.
- **50–75**: Strong trend. The market is trending well and the trend is likely to continue.
- **75–100**: Very strong trend. The market is experiencing a highly directional trend, and it’s often harder to trade against it.
- **+DI and -DI**:
- **+DI** represents the strength of upward price movements, while **-DI** measures the strength of downward price movements.
- When **+DI** crosses above **-DI**, it signals potential upward momentum (bullish trend).
- When **-DI** crosses above **+DI**, it signals potential downward momentum (bearish trend).
### 3. **How to Use ADX for Trading**
- **Trend Strength Identification**:
- **ADX below 25**: Market is weak and moving sideways. There’s no clear trend, so this is usually a time for range trading.
- **ADX between 25 and 50**: A trend is forming, and it’s a good time to trade in the direction of the trend. The higher the ADX, the stronger the trend.
- **ADX above 50**: The trend is very strong, and it’s usually better to follow the direction of the trend, as reversals are less likely.
- **Crossovers of +DI and -DI**:
- When **+DI** crosses above **-DI**, it’s a potential signal for a bullish trend.
- When **-DI** crosses above **+DI**, it’s a potential signal for a bearish trend.
- **Trend Reversals and Continuations**:
- If the ADX is rising above 25 and **+DI** is above **-DI**, it indicates a strengthening bullish trend.
- If the ADX is rising above 25 and **-DI** is above **+DI**, it signals a strengthening bearish trend.
- A falling ADX, even with a crossover between +DI and -DI, may indicate a potential trend reversal or that the trend is losing strength.
### 4. **Using ADX in Combination with Other Indicators**
- **ADX and Moving Averages**: Moving averages can help confirm the direction of the trend. For example, if ADX is above 25 and the price is above a long-term moving average, this confirms a strong uptrend.
- **ADX and RSI (Relative Strength Index)**: While ADX measures trend strength, RSI measures overbought or oversold conditions. Combining these two can give better insights into when a trend might be nearing its end (for example, if the ADX shows a strong trend but RSI indicates overbought/oversold levels, a reversal could be imminent).
- **ADX and MACD (Moving Average Convergence Divergence)**: The MACD can show momentum in the trend, while ADX shows its strength. Using them together can help confirm whether a strong trend is likely to continue.
### 5. **Example of How to Trade Using ADX**
- **Buy Signal**:
- ADX rises above 25 (indicating the start of a trend).
- +DI crosses above -DI (indicating a bullish trend).
- Consider entering a **long** (buy) position.
- **Sell Signal**:
- ADX rises above 25 (indicating the start of a trend).
- -DI crosses above +DI (indicating a bearish trend).
- Consider entering a **short** (sell) position.
- **Exit Signal**:
- If ADX starts falling below 25, it may suggest the trend is weakening or the market is entering a sideways phase. This might be a good time to exit the trade or tighten stop losses.
### 6. **Limitations of ADX**
- **Lagging Indicator**: ADX is a lagging indicator, meaning it confirms trends after they have started. Therefore, it may not give early signals.
- **No Directional Signal**: ADX doesn’t tell you whether the trend is up or down. It only measures the strength of the trend, so you need to use it alongside other indicators like +DI and -DI to determine the trend direction.
- **False Signals in Sideways Markets**: In choppy or sideways markets, ADX may fluctuate around low levels and give false signals, so it’s important to combine ADX with other tools to ensure you’re trading in the right conditions.
### 7. **Conclusion**
ADX is a useful tool for determining the strength of a trend, helping traders decide whether to enter a trade or not based on trend strength. For effective use, it’s best combined with other indicators, such as the moving averages, RSI, or MACD, to ensure you're trading in the right direction and under the right market conditions.

what is option chain analysis ?Option chain analysis is the study of the option chain data, which is a listing of all the available option contracts for a particular underlying asset (like a stock, index, or commodity) and their corresponding strike prices, expiration dates, and trading volumes. By analyzing this data, traders can gain insights into market sentiment, potential price movements, and liquidity. It helps investors make more informed decisions about buying or selling options.
Here's how option chain analysis works and what traders typically look for:
### 1. **Components of an Option Chain**
- **Strike Price**: The price at which the option holder can buy or sell the underlying asset.
- **Expiration Date**: The date by which the option must be exercised.
- **Call Options**: These give the holder the right to buy the underlying asset at the strike price.
- **Put Options**: These give the holder the right to sell the underlying asset at the strike price.
- **Open Interest (OI)**: The total number of open (outstanding) option contracts for a given strike price and expiration.
- **Volume**: The number of contracts traded during the day.
- **Implied Volatility (IV)**: A measure of expected price fluctuation in the underlying asset; higher IV suggests higher uncertainty.
### 2. **Key Indicators in Option Chain Analysis**
- **Open Interest**: Higher open interest at a particular strike price often indicates strong support or resistance at that level. A sudden increase can signal growing market interest in that strike.
- **Volume**: High trading volume suggests a lot of activity or interest in a particular strike, which may indicate potential price movement.
- **Put/Call Ratio**: A ratio that compares the trading volume or open interest of put options to call options. A high put/call ratio can indicate a bearish sentiment, while a low ratio can indicate bullish sentiment.
- **In-the-Money (ITM), At-the-Money (ATM), and Out-of-the-Money (OTM)**: These terms describe the relationship of the strike price to the underlying asset's market price.
- ITM: The option has intrinsic value (e.g., for calls, the stock price is above the strike price).
- ATM: The strike price is near the current price of the underlying asset.
- OTM: The option has no intrinsic value (e.g., for calls, the stock price is below the strike price).
- **Implied Volatility (IV)**: High IV typically indicates an expectation of significant price movement in the underlying asset. Traders look for changes in implied volatility to gauge market sentiment.
### 3. **Using Option Chain Analysis for Insights**
- **Identifying Support and Resistance**: By observing where the highest open interest is, traders can determine key support and resistance levels. For example, a large number of open call options at a specific strike price can suggest resistance, while a large number of open put options might indicate support.
- **Predicting Price Movement**: Changes in open interest and volume can signal a potential price move. A rise in call option open interest may suggest bullish sentiment, while an increase in put option open interest may indicate bearish sentiment.
- **Sentiment Analysis**: Traders often use the put-call ratio and the implied volatility to gauge overall market sentiment. A shift in sentiment can indicate possible trend reversals or price movements.
- **Price Targets and Breakouts**: Option chain analysis helps traders spot potential price targets where large numbers of options may be concentrated, signaling potential price breakouts.
### 4. **Example:**
- If you see high open interest in a strike price of a stock's call options, especially at levels close to or above the stock's current price, and there is a lot of trading volume in these contracts, it could indicate that traders expect the stock to move upwards, possibly indicating a bullish sentiment.
- Conversely, if there’s high open interest in put options with a strike price below the current market price of the stock, it could indicate a bearish outlook.
### Conclusion
Option chain analysis is a powerful tool that can give traders valuable insights into potential price movements, market sentiment, and areas of high interest. By carefully studying the data, including open interest, volume, strike prices, and implied volatility, investors can make better decisions when it comes to entering or exiting trades in the options market.

NIFTY - LONGNifty showing Positive Consolidation near 22800 and multiple rejections indication of good base formation.
We might see 23200, 23300 & 23600 in upcoming sessions with Stop Loss below 22900 on CLosing basis.
Disclaimer: Please do your own analysis before investing.

Shyam Metalics and Energy Ltd.### **Comprehensive Analysis of Shyam Metalics and Energy Ltd.**
#### **1. Fundamental Analysis:**
**Overview:**
Shyam Metalics and Energy Ltd. is a leading player in the Indian steel manufacturing industry, specializing in the production of long steel products, including rebars, billets, and sponge iron. The company is known for its strong presence in the Indian market, especially in Eastern India, with a significant market share in the steel and energy sectors. Shyam Metalics is part of the Shyam Group, a conglomerate with diverse interests in manufacturing, energy, and infrastructure.
**Key Financials (as of latest available data):**
- **Market Capitalization**: ₹20,000 crore (as of Feb 2025)
- **Revenue Growth**: Shyam Metalics has shown consistent revenue growth, driven by strong demand in the steel sector, increased capacity utilization, and its ability to capture market share in a growing domestic market. The company has also benefited from increasing infrastructure and construction activities in India.
- **Profitability**: Shyam Metalics enjoys robust profitability, supported by its backward integration into sponge iron production, which provides a cost advantage over peers. The company has also benefited from higher steel prices in recent years.
- **Debt Levels**: The company maintains a moderate level of debt. While it has been able to service its debt effectively, any rise in interest rates or decline in profitability could put pressure on its financials. It is important to monitor its debt-to-equity ratio in the coming quarters.
**Recent Developments:**
- **Capacity Expansion**: Shyam Metalics has been investing in expanding its manufacturing capacity, particularly in the steel and sponge iron segments. This expansion aims to meet the growing domestic demand for steel, particularly from the infrastructure and construction sectors.
- **Focus on Green Steel**: The company has been making efforts to reduce its carbon footprint by focusing on sustainable practices and the production of "green steel," which is more environmentally friendly.
- **Strategic Acquisitions**: Shyam Metalics has been expanding its footprint by acquiring or setting up new plants, particularly in underserved markets across India. This helps increase its market share and geographical reach.
- **Steel Price Volatility**: The company is vulnerable to fluctuations in global steel prices. The rising steel prices over the past few years have contributed to increased margins, but any correction in prices could impact the company’s revenue and profitability.
**Key Strengths:**
- **Backwards Integration**: Shyam Metalics’ backward integration into sponge iron production provides it with a significant cost advantage. The company produces a large portion of its raw material in-house, which helps mitigate the risk of raw material price fluctuations.
- **Market Position**: The company has a strong market presence, particularly in the eastern and northern regions of India. It is also increasing its market share in the southern part of the country.
- **Diversified Product Portfolio**: Shyam Metalics offers a wide range of steel products catering to various sectors, including infrastructure, real estate, and manufacturing, which provides stability and revenue diversification.
- **Capacity Expansion**: The company's expansion plans are focused on increasing production capacity and tapping into high-growth sectors like infrastructure and construction, which could drive future growth.
**Risks:**
- **Steel Price Volatility**: The steel industry is highly cyclical, and the company’s earnings can be impacted by fluctuations in global steel prices. A sharp decline in steel prices can reduce profitability, especially if input costs do not adjust similarly.
- **Raw Material Supply Risks**: Despite backward integration, the company still relies on the supply of iron ore, coal, and other raw materials. Any supply disruptions or price hikes in these inputs could impact production costs and margins.
- **Regulatory and Environmental Risks**: The steel manufacturing industry is subject to stringent environmental regulations. Any changes in regulatory policies or stricter environmental norms could lead to higher compliance costs.
- **Debt and Interest Rate Risks**: The company’s ability to maintain healthy profit margins could be impacted by increasing debt servicing costs if interest rates rise, as a significant portion of its financing is debt-based.
---
#### **2. Technical Analysis:**
**Current Price Action (as of February 2025):**
- **Stock Price**: ₹456 (as of Feb 2025)
- **52-week High/Low**: ₹570 (High) – ₹297 (Low)
- **Recent Trend**: The stock has been on an upward trajectory, having rallied from its 52-week low of ₹297 to its current price of ₹456. It has been consolidating around the ₹450-460 range and is trying to break past the resistance at ₹470.
**Moving Averages:**
- **50-Day Moving Average (50-DMA)**: ₹450
- **200-Day Moving Average (200-DMA)**: ₹380
- The stock is trading above both its 50-DMA and 200-DMA, indicating a positive trend. The 50-DMA is rising, supporting the bullish outlook. A sustained trade above ₹460 could trigger further upside.
**Relative Strength Index (RSI):**
- RSI is at **63**, which is approaching the overbought territory but still within a neutral range. This suggests that the stock has room to move further upwards but is approaching levels where caution may be needed if RSI enters the overbought zone (above 70).
**MACD (Moving Average Convergence Divergence):**
- The MACD line is above the signal line, indicating bullish momentum. The widening gap between the MACD line and signal line shows strong buying interest.
**Volume Analysis:**
- Volume has been gradually increasing, particularly during upward movements, which suggests strong buying interest. A breakout above the resistance at ₹470, accompanied by high volume, could lead to a move toward ₹500.
---
#### **3. Support and Resistance Levels:**
**Support Levels:**
- **₹450-460**: The immediate support zone is between ₹450 and ₹460, where the stock has found support during its recent consolidation phase. A decline below this range could bring the stock toward the next support at ₹430.
- **₹430**: A deeper pullback could bring the stock towards ₹430, which represents the next solid support level.
**Resistance Levels:**
- **₹470**: The immediate resistance is at ₹470, where the stock has encountered selling pressure in recent weeks. A breakout above this level could signal further upward momentum.
- **₹570**: The 52-week high at ₹570 serves as a key resistance point. A sustained breakout above ₹570 could lead the stock to higher levels, with ₹600 being the next psychological resistance level.
**Key Levels to Watch for Short-Term Movement:**
- **Immediate Resistance**: ₹470
- **Immediate Support**: ₹450-460
---
#### **4. Risk and Reward Outlook:**
**Risk Factors:**
- **Steel Price Volatility**: Steel prices can be volatile due to changes in global demand, international trade tariffs, and economic cycles. Any significant decline in steel prices could hurt the company’s margins, particularly as raw material prices remain high.
- **Regulatory Challenges**: Changes in government policies, especially those related to environmental regulations or tax rates, could adversely impact the company’s operations and margins.
- **Raw Material Price Fluctuations**: While Shyam Metalics has backward integration, it still faces exposure to the prices of iron ore, coal, and other raw materials, which could impact production costs if prices increase unexpectedly.
- **Debt Exposure**: The company carries some debt, and rising interest rates could affect its ability to generate consistent profits, especially if the cost of servicing debt increases significantly.
**Reward Potential:**
- **Capacity Expansion and Market Penetration**: The company’s ongoing capacity expansion plans, especially in underserved regions and high-growth sectors like infrastructure, offer significant upside potential.
- **Steel Price Strength**: If steel prices remain strong, Shyam Metalics could see a substantial improvement in its revenue and profitability. The increased demand for steel products, especially for construction and infrastructure projects, supports long-term growth.
- **Backward Integration**: The company’s cost advantage from backward integration into sponge iron production positions it well to capture more market share and improve profitability.
---
#### **5. Investment Recommendation:**
- **Long-Term Investors**: Shyam Metalics is a good long-term investment option for those looking to gain exposure to the Indian steel industry. The company’s expansion, strong product portfolio, and backward integration into the production of sponge iron provide a competitive advantage. A healthy growth outlook in infrastructure and construction sectors further supports its potential. Investors may consider buying at or near support levels of **₹450-460** for long-term growth.
- **Short-Term Traders**: Traders may look for a breakout above **₹470** to enter long positions, with a potential target of **₹500-570**. If the stock faces resistance at ₹470 and starts to consolidate, a re-entry could be considered near the support level at **₹450-460**.
---
### **Disclaimer:**
The information and analysis provided here are for educational and informational purposes only. We are not registered with SEBI (Securities and Exchange Board of India) or any other regulatory body, and this should not be construed as investment advice. Stock market investments are subject to market risks, and past performance is not indicative of future results. Before making any investment decisions, it is important to conduct thorough research, seek advice from a certified financial advisor, and understand your risk tolerance. The views expressed are based on publicly available data and personal analysis and may not necessarily reflect the views of other professionals or organizations.

cipla ltd### **Comprehensive Analysis of Cipla Ltd.**
#### **1. Fundamental Analysis:**
**Overview:**
Cipla Ltd. is one of India's largest and most well-known pharmaceutical companies, with a strong focus on manufacturing high-quality generic medications. The company is headquartered in Mumbai and operates globally, providing a wide range of medicines in areas such as respiratory, oncology, cardiology, and infectious diseases. Cipla is recognized for its leadership in the respiratory segment, particularly its inhalation products, as well as its focus on providing affordable healthcare solutions worldwide.
**Key Financials (as of latest available data):**
- **Market Capitalization**: ₹98,000 crore (as of Feb 2025)
- **Revenue Growth**: Cipla has consistently demonstrated strong revenue growth, driven by its robust product portfolio and expansion in key markets, especially the U.S. and emerging markets.
- **Profitability**: The company enjoys healthy profit margins due to its diversified product base and focus on high-margin therapeutic areas like respiratory and oncology. The profitability is further supported by its cost-effective manufacturing processes.
- **Debt Levels**: Cipla has a relatively low debt-to-equity ratio, indicating strong financial health and manageable debt levels. The company has been focusing on reducing its debt load and has a good credit rating.
**Recent Developments:**
- **Global Expansion**: Cipla has been aggressively expanding its presence in international markets, especially in the U.S., where it has a significant market share in generic drugs. The company has also been increasing its footprint in emerging markets like Africa, Latin America, and Asia.
- **Strong Pipeline**: Cipla’s pipeline of new products is promising, particularly in the respiratory and oncology segments. It is also focusing on introducing biosimilars, which are expected to become a key growth driver in the coming years.
- **Strategic Acquisitions**: Cipla has made several strategic acquisitions, including the purchase of specialty assets in areas like oncology, which complement its existing portfolio and expand its therapeutic reach.
- **COVID-19 Impact**: Cipla played an essential role in the fight against COVID-19 by manufacturing critical medicines, including antiviral and respiratory drugs. The pandemic temporarily boosted sales for some segments but also caused supply chain disruptions.
**Key Strengths:**
- **Leadership in Respiratory Drugs**: Cipla is a dominant player in the respiratory segment, particularly in inhalation products. This leadership position provides strong revenue visibility, given the rising prevalence of respiratory diseases globally.
- **Robust Product Portfolio**: Cipla’s diversified portfolio across several therapeutic segments (respiratory, oncology, cardiology, anti-infectives, etc.) reduces dependence on any single product or market, providing stability to its earnings.
- **Expanding Presence in Emerging Markets**: Cipla has a strong foothold in emerging markets, which have become a key growth driver due to increasing healthcare access and demand for affordable generic medications.
- **Focus on Research and Development**: The company has a significant focus on R&D and innovation, consistently introducing new products, especially in the biosimilars and generic drug spaces.
**Risks:**
- **Regulatory Risks**: Cipla operates in highly regulated markets and is subject to inspections by agencies like the U.S. FDA, which can impact product approvals and revenue. Any regulatory challenges, particularly in the U.S., could negatively impact the company.
- **Intense Competition**: The pharmaceutical industry is highly competitive, with several multinational and domestic companies competing in the generics space. Price pressure and market share loss to competitors remain ongoing risks.
- **Currency Risk**: Cipla generates a significant portion of its revenue from international markets, particularly the U.S. and Europe. Currency fluctuations, especially in USD/INR, could impact profitability.
- **Raw Material Costs**: Cipla relies on the supply of active pharmaceutical ingredients (APIs), which are sensitive to fluctuations in raw material prices. Any disruptions in the supply of key ingredients or price hikes could impact margins.
---
#### **2. Technical Analysis:**
**Current Price Action (as of February 2025):**
- **Stock Price**: ₹1,100 (as of Feb 2025)
- **52-week High/Low**: ₹1,245 (High) – ₹890 (Low)
- **Recent Trend**: Cipla has been in an upward trend, consolidating in a range between ₹1,100-1,150 after reaching its 52-week high of ₹1,245. The stock has been moving sideways recently, and it could either break out to the upside or face resistance at higher levels.
**Moving Averages:**
- **50-Day Moving Average (50-DMA)**: ₹1,060
- **200-Day Moving Average (200-DMA)**: ₹1,030
- The stock is trading above both its 50-DMA and 200-DMA, suggesting a positive medium-term trend. A strong support base is seen around ₹1,050, and any significant decline below this level could signal potential weakness.
**Relative Strength Index (RSI):**
- RSI is at **65**, which is in the neutral zone, approaching the overbought region. This suggests that the stock could be poised for a potential breakout if it continues to climb, but also be cautious if it enters the overbought zone (RSI above 70).
**MACD (Moving Average Convergence Divergence):**
- The MACD line is above the signal line, indicating bullish momentum. The MACD histogram shows widening momentum, suggesting that there is strong buying interest in Cipla stock.
**Volume Analysis:**
- Volume has been increasing during upward movements, which signals healthy buying interest. However, a breakout above ₹1,150 with significantly higher volume could confirm further upward momentum.
---
#### **3. Support and Resistance Levels:**
**Support Levels:**
- **₹1,050-1,060**: The immediate support lies between ₹1,050 and ₹1,060, as these levels have acted as a strong support zone for the stock in recent weeks. A breakdown below this level could lead to further downside toward ₹1,030.
- **₹1,000**: The next support level lies near ₹1,000, where the stock has shown a tendency to bounce in the past.
**Resistance Levels:**
- **₹1,150**: The immediate resistance for the stock is at ₹1,150, where the stock has encountered selling pressure in recent days. A breakout above this level would signal bullish momentum.
- **₹1,245**: The 52-week high of ₹1,245 is a major resistance point. A break above this level could open up the possibility of the stock reaching higher levels, possibly toward ₹1,300.
**Key Levels to Watch for Short-Term Movement:**
- **Immediate Resistance**: ₹1,150
- **Immediate Support**: ₹1,050-1,060
---
#### **4. Risk and Reward Outlook:**
**Risk Factors:**
- **Regulatory Risks**: Being a major player in the generic pharmaceutical space, Cipla is subject to regulatory scrutiny, particularly in the U.S., which could affect product approvals or lead to delays in new product launches.
- **Competition**: The generics market is highly competitive, with numerous companies offering similar products. This competitive landscape may result in margin compression, particularly in the U.S. market.
- **Global Economic Conditions**: Economic slowdowns, especially in key markets like the U.S., could impact Cipla's revenue growth. A weaker global economy could lead to reduced demand for certain healthcare products.
**Reward Potential:**
- **Strong Pipeline and Product Portfolio**: Cipla's solid pipeline of new drugs, particularly in the high-margin respiratory and oncology segments, offers good long-term growth potential.
- **Global Market Expansion**: The company’s expanding international presence, particularly in emerging markets, provides it with a diverse revenue stream and growth opportunities.
- **Healthy Financials**: With a strong balance sheet, low debt, and steady cash flow, Cipla is well-positioned to weather economic volatility and invest in long-term growth initiatives.
---
#### **5. Investment Recommendation:**
- **Long-Term Investors**: Cipla is well-positioned for long-term growth, driven by its strong global presence, extensive product portfolio, and focus on high-margin segments like respiratory and oncology. The company’s low debt and strong financial position make it a solid pick for investors looking for exposure to the pharmaceutical sector. Investors may consider entering near support levels of **₹1,050-1,060** for a favorable risk-reward position.
- **Short-Term Traders**: Traders may look for a breakout above **₹1,150**, signaling further upward momentum. However, if the stock fails to break above this level and faces selling pressure, a pullback to **₹1,050-1,060** could present an entry point.
---
### **Disclaimer:**
The information and analysis provided here are for educational and informational purposes only. We are not registered with SEBI (Securities and Exchange Board of India) or any other regulatory body, and this should not be construed as investment advice. Stock market investments are subject to market risks, and past performance is not indicative of future results. Before making any investment decisions, it is important to conduct thorough research, seek advice from a certified financial advisor, and understand your risk tolerance. The views expressed are based on publicly available data and personal analysis and may not necessarily reflect the views of other professionals or organizations.

Kiri Industries Ltd.### **Comprehensive Analysis of Kiri Industries Ltd.**
#### **1. Fundamental Analysis:**
**Overview:**
Kiri Industries Ltd. is a prominent player in the Indian chemicals and dyes industry. It primarily manufactures and exports a wide range of textile dyes, intermediates, and other chemical products used in various industries, including textiles, plastics, and paints. The company is based in Ahmedabad, Gujarat, and has been in operation for several decades, growing its presence both in domestic and international markets. Kiri Industries is one of the largest manufacturers of reactive dyes in India, with a strong export presence in over 50 countries.
**Key Financials (as of latest available data):**
- **Market Capitalization**: ₹3,000 crore (as of Feb 2025)
- **Revenue Growth**: Kiri Industries has experienced moderate revenue growth, driven by its expanding product portfolio and increasing demand for dyes and chemicals. The company has a diversified customer base, with major contributions coming from exports.
- **Profitability**: Kiri Industries has shown healthy profitability over the years. However, its margins can be volatile due to fluctuations in raw material costs and the cyclical nature of the textile and chemical industries.
- **Debt Levels**: The company has a manageable debt load, and it has been focusing on reducing its debt in recent years. It has maintained a relatively low debt-to-equity ratio compared to some peers in the chemicals sector.
**Recent Developments:**
- **Capacity Expansion**: Kiri Industries has been investing in expanding its production capacity and diversifying its product range to cater to the growing demand for environmentally friendly dyes and chemicals. This is in line with global trends towards sustainability and eco-friendly products.
- **Focus on Export Markets**: The company continues to strengthen its position in international markets, especially in Europe, Asia, and Africa. With the global demand for textile dyes and chemicals rising, Kiri Industries is well-positioned to capture a larger market share.
- **Environmental Initiatives**: Kiri Industries has been focusing on green chemistry and sustainable manufacturing processes. It has developed several eco-friendly and biodegradable dyes and intermediates, which cater to the growing demand for sustainable solutions in the textile industry.
- **Cost Control and Efficiency**: Kiri has been focusing on improving operational efficiencies and controlling costs, which has helped it maintain profitability despite volatile raw material costs.
**Key Strengths:**
- **Strong Product Portfolio**: Kiri Industries offers a wide range of textile dyes and chemicals, catering to both domestic and international markets. Its extensive product range gives it the ability to meet diverse customer requirements.
- **Global Presence**: The company’s established export markets, particularly in Europe and other parts of Asia, help mitigate domestic economic risks and open up growth avenues in international markets.
- **Commitment to Sustainability**: Kiri Industries has positioned itself as a leader in producing eco-friendly and sustainable products, which is a growing trend in the global textile industry.
- **Experienced Management**: The company is backed by a strong and experienced management team with a good track record in the chemicals and textiles industries, which helps in executing large-scale projects and sustaining growth.
**Risks:**
- **Volatility in Raw Material Prices**: The chemical and textile industries are sensitive to fluctuations in the prices of raw materials like petrochemicals and crude oil. Any significant rise in raw material costs can impact profitability.
- **Competition**: Kiri Industries faces stiff competition from domestic and international players, which could put pressure on pricing and market share, particularly in export markets.
- **Regulatory and Environmental Risks**: The company is subject to strict environmental regulations, and any changes in policies related to chemical manufacturing or textile dyes could impact its operations. Additionally, global shifts toward stricter environmental standards could require significant investments in compliance.
- **Economic Cycles**: As a manufacturer of industrial chemicals, Kiri Industries is exposed to the cyclical nature of the textile and industrial sectors. A slowdown in the demand for textiles or a global recession could negatively impact the company's performance.
---
#### **2. Technical Analysis:**
**Current Price Action (as of February 2025):**
- **Stock Price**: ₹745 (as of Feb 2025)
- **52-week High/Low**: ₹885 (High) – ₹480 (Low)
- **Recent Trend**: Kiri Industries has seen a strong recovery since hitting its 52-week low of ₹480, with the stock currently trading near ₹745. It has formed an upward trend over the past few months and is testing resistance at ₹750. The stock has been consolidating in a range, with buying interest emerging around the ₹700-730 levels.
**Moving Averages:**
- **50-Day Moving Average (50-DMA)**: ₹730
- **200-Day Moving Average (200-DMA)**: ₹620
- The stock is trading above both its 50-DMA and 200-DMA, indicating a positive medium- to long-term trend. A break above the immediate resistance at ₹750 could signal further bullish momentum.
**Relative Strength Index (RSI):**
- RSI is at **65**, which is approaching the overbought region (RSI above 70). This suggests that the stock may face some short-term resistance or consolidation if RSI continues to rise.
**MACD (Moving Average Convergence Divergence):**
- The MACD line is above the signal line, indicating a bullish trend. The distance between the MACD line and signal line is widening, which indicates strong momentum in the stock.
**Volume Analysis:**
- Volume has been steadily increasing, particularly during upward price movements, which suggests that buying interest is growing. A breakout above ₹750 with strong volume could lead to further upward movement.
---
#### **3. Support and Resistance Levels:**
**Support Levels:**
- **₹700-730**: The immediate support lies between ₹700 and ₹730, where the stock has been consolidating recently. A pullback towards this level could present a buying opportunity if the stock holds support.
- **₹620**: The next significant support lies around ₹620, which corresponds to the 200-DMA.
**Resistance Levels:**
- **₹750**: The immediate resistance is at ₹750, which the stock has tested multiple times. A breakout above this level could signal further upside toward the next resistance levels.
- **₹885**: The 52-week high is ₹885, and any strong bullish momentum could drive the stock toward this level in the longer term.
**Key Levels to Watch for Short-Term Movement:**
- **Immediate Resistance**: ₹750 (recent high)
- **Immediate Support**: ₹700-730 (recent low)
---
#### **4. Risk and Reward Outlook:**
**Risk Factors:**
- **Raw Material Price Fluctuations**: Kiri Industries is vulnerable to price fluctuations in key raw materials, which could affect its margin and profitability, particularly in the face of rising crude oil prices.
- **Competition**: Intense competition from both domestic and international players, particularly in the dye and chemicals space, could pressure the company's market share and profitability.
- **Regulatory Risks**: As a chemicals manufacturer, Kiri Industries faces regulatory risks related to environmental and safety standards. Any changes in regulations could lead to higher compliance costs.
- **Economic Sensitivity**: The company’s performance is closely tied to the textile industry, which is sensitive to global economic cycles. Any slowdown in demand for textiles, especially in key export markets, could negatively impact the company.
**Reward Potential:**
- **Growth in Export Markets**: With its strong export presence, particularly in Europe, Kiri Industries has the potential to grow its revenue from international markets. The growing demand for sustainable and eco-friendly products in the global textile market can drive growth.
- **Sustainability Trends**: Kiri's focus on eco-friendly dyes and chemicals positions it well to benefit from the increasing trend of sustainable practices in the textile and chemical industries.
- **Margin Improvement**: The company’s focus on expanding its product portfolio and improving efficiency could lead to better margins over time, especially as it captures more market share in the premium and sustainable product categories.
---
#### **5. Investment Recommendation:**
- **Long-Term Investors**: Kiri Industries Ltd. has a promising future, particularly in the context of rising global demand for eco-friendly and sustainable chemical products. The company’s expansion into international markets and focus on cost efficiency make it a solid long-term play for those looking to invest in the chemical sector. Investors may consider entering the stock near support levels, around **₹700-730**, for better risk-reward positioning.
- **Short-Term Traders**: Traders may look for a breakout above **₹750** to enter long positions, with the expectation of a move toward **₹885**. However, caution is advised if RSI continues to rise towards overbought levels, which could lead to a short-term consolidation or pullback.
---
### **Disclaimer:**
The information and analysis provided here are for educational and informational purposes only. We are not registered with SEBI (Securities and Exchange Board of India) or any other regulatory body, and this should not be construed as investment advice. Stock market investments are subject to market risks, and past performance is not indicative of future results. Before making any investment decisions, it is important to conduct thorough research, seek advice from a certified financial advisor, and understand your risk tolerance. The views expressed are based on publicly available data and personal analysis and may not necessarily reflect the views of other professionals or organizations.

Sobha Ltd### **Comprehensive Analysis of Sobha Ltd.**
#### **1. Fundamental Analysis:**
**Overview:**
Sobha Ltd. is a prominent player in the Indian real estate sector, known for its high-quality residential, commercial, and contractual projects. The company is primarily engaged in the development of residential and commercial spaces, including luxury and premium residential projects. Sobha Ltd. is headquartered in Bengaluru, Karnataka, and has a presence across key cities in India. It is also known for its commitment to delivering superior-quality real estate developments.
**Key Financials (as of latest available data):**
- **Market Capitalization**: ₹11,800 crore (as of Feb 2025)
- **Revenue Growth**: Sobha has seen fluctuating revenue growth in recent years, with the pandemic causing short-term disruptions in its operations. However, post-pandemic, there has been a recovery in the real estate market, particularly in the luxury and premium residential segments, which has benefited the company.
- **Profitability**: The company has historically maintained strong profit margins due to its focus on premium and luxury projects, which typically offer higher margins. However, the business is capital-intensive and can experience margin compression during periods of economic slowdown or increased input costs.
- **Debt Levels**: Sobha’s debt levels have been higher compared to some of its peers in the real estate sector, which poses a risk in periods of rising interest rates or economic uncertainty. Nonetheless, the company has been working on improving its debt position by monetizing non-core assets and focusing on reducing its debt load.
**Recent Developments:**
- **Real Estate Recovery**: The Indian real estate sector, particularly in the luxury and high-end residential segments, has seen a strong recovery post-COVID, and Sobha Ltd. has benefited from this trend with strong sales in its premium residential developments.
- **Expansion Plans**: Sobha has been expanding its footprint beyond traditional markets like Bengaluru and Pune. The company has recently ventured into newer cities like Chennai, Gurugram, and Kochi, where it is focusing on high-end residential and commercial projects.
- **Cost Management Initiatives**: The company has been implementing several cost-cutting measures, such as reducing construction costs, optimizing land acquisition strategies, and focusing on in-house construction activities to control costs.
- **Sustainability Focus**: Sobha has also been emphasizing sustainable construction practices, ensuring that its developments adhere to green building standards, which has become a growing trend in the industry.
**Key Strengths:**
- **Reputation for Quality**: Sobha is known for its commitment to delivering high-quality real estate projects, which has earned it a strong brand presence in the market.
- **Diversified Product Portfolio**: Sobha’s product portfolio includes residential, commercial, and contractual projects, offering diversification and reducing dependency on any single segment.
- **Strong Sales in Luxury Segment**: Sobha's focus on the luxury and premium real estate segment provides a strong margin profile, and the demand for such properties has been resilient in recent years.
- **Experienced Management**: The company is led by an experienced management team with a strong track record in real estate development, which ensures effective execution of projects.
**Risks:**
- **High Debt Levels**: Sobha has relatively high levels of debt, which could be a concern in the event of rising interest rates or any cash flow disruptions.
- **Real Estate Cycles**: The real estate market is cyclical, and any downturn in the sector due to economic conditions, interest rate hikes, or a slowdown in demand could impact Sobha’s financial performance.
- **Regulatory Risks**: Sobha operates in a highly regulated environment, and changes in government policies, land acquisition laws, or construction regulations could pose risks to its operations.
- **Fluctuating Raw Material Costs**: As with any real estate company, Sobha is subject to fluctuations in the prices of raw materials like steel and cement, which could affect its project costs and margins.
---
#### **2. Technical Analysis:**
**Current Price Action (as of February 2025):**
- **Stock Price**: ₹797 (as of Feb 2025)
- **52-week High/Low**: ₹944 (High) – ₹620 (Low)
- **Recent Trend**: Sobha Ltd. has shown a strong upward trend since reaching its 52-week low of ₹620, rallying to ₹797. The stock has been consolidating in a range, and it has recently tested the support zone around ₹760-780, with resistance around ₹820-840.
**Moving Averages:**
- **50-Day Moving Average (50-DMA)**: ₹790
- **200-Day Moving Average (200-DMA)**: ₹725
- The stock is currently trading above both its 50-DMA and 200-DMA, indicating that the medium-to-long-term trend is positive. If the stock sustains above the 50-DMA, it could signal continued upward momentum.
**Relative Strength Index (RSI):**
- RSI is at **58**, indicating that the stock is in neutral territory. It’s not overbought or oversold, but if the RSI approaches 70, the stock could enter overbought territory, suggesting caution.
**MACD (Moving Average Convergence Divergence):**
- The MACD line is above the signal line, suggesting a bullish momentum. A strong uptrend could continue if the MACD remains above the signal line.
**Volume Analysis:**
- Volume has been consistent, with occasional spikes during rallies, suggesting that there is support for the stock’s current price action. However, the stock needs a sustained increase in volume to confirm breakout moves above resistance levels.
---
#### **3. Support and Resistance Levels:**
**Support Levels:**
- **₹760-780**: The immediate support zone for Sobha Ltd. lies between ₹760 and ₹780, which has acted as a floor for the stock in recent weeks. A breakdown below this level could lead to further downside towards ₹725.
- **₹725**: The secondary support level is near ₹725, which corresponds to the 200-DMA.
**Resistance Levels:**
- **₹820-840**: The immediate resistance for the stock is between ₹820 and ₹840, with several price tests around this zone. A breakout above this level would indicate further bullish momentum.
- **₹900**: The next significant resistance is near ₹900, which aligns with previous highs and acts as a psychological barrier for the stock.
**Key Levels to Watch for Short-Term Movement:**
- **Immediate Resistance**: ₹820-840 (recent high)
- **Immediate Support**: ₹760-780 (recent low)
---
#### **4. Risk and Reward Outlook:**
**Risk Factors:**
- **Debt Burden**: High levels of debt in a capital-intensive industry like real estate could be risky, especially in an environment of rising interest rates or an economic downturn.
- **Regulatory Risks**: The real estate sector is subject to various regulatory changes. Any new regulations or delays in approvals could negatively impact project timelines and financial performance.
- **Economic Slowdown**: An economic slowdown or a reduction in consumer spending could impact demand for residential properties, especially in the premium and luxury segments.
**Reward Potential:**
- **Recovery in Real Estate**: The recovery in the real estate market, especially in the premium and luxury segments, provides Sobha Ltd. with strong growth prospects. With rising incomes and a growing urban population, demand for high-quality residential projects is expected to continue.
- **Brand Strength**: Sobha’s reputation for quality construction and timely delivery provides it with a competitive advantage in the real estate market. The company’s diversified project portfolio and strong market presence make it well-positioned for long-term growth.
- **Improved Financial Position**: Sobha’s focus on reducing its debt levels and monetizing non-core assets can lead to an improvement in its financial health, making it less vulnerable to macroeconomic or industry-specific risks.
---
#### **5. Investment Recommendation:**
- **Long-Term Investors**: Sobha Ltd. is a solid long-term investment in the real estate sector, particularly for those looking to capitalize on the growth of India’s urbanization and demand for premium real estate. The company’s strong brand, quality focus, and expansion into new markets position it well for future growth. Investors may consider entering around **₹760-780** for better risk-reward positioning.
- **Short-Term Traders**: Traders could look for a breakout above **₹820-840** to enter long positions. If the stock fails to break resistance and starts trending lower, a move towards **₹725** could be a potential downside.
---
### **Disclaimer:**
The information and analysis provided here are for educational and informational purposes only. We are not registered with SEBI (Securities and Exchange Board of India) or any other regulatory body, and this should not be construed as investment advice. Stock market investments are subject to market risks, and past performance is not indicative of future results. Before making any investment decisions, it is important to conduct thorough research, seek advice from a certified financial advisor, and understand your risk tolerance. The views expressed are based on publicly available data and personal analysis and may not necessarily reflect the views of other professionals or organizations.
