#NIFTY Intraday Support and Resistance Levels - 30/01/2026Nifty is expected to open on a flat note, indicating indecision after the recent recovery from lower levels. The index is currently trading around the 25420–25450 zone, which has emerged as an immediate resistance area. A flat opening near this region suggests that the market is entering a consolidation phase, where buyers and sellers are evenly matched. Early session movement may remain choppy as participants wait for a clear directional trigger.
Technically, the broader structure of Nifty has improved after holding strong support near 25000–25200 and bouncing back sharply. This recovery has shifted the short-term trend from bearish to neutral-to-positive. However, the zone between 25450 and 25550 remains a crucial supply area. Until Nifty gives a decisive breakout above this range, upside momentum may stay limited and profit booking can appear near higher levels.
On the upside, a sustained move above 25250–25300 keeps the bullish bias intact for intraday trades. If the index manages to break and hold above 25550, it can trigger fresh long positions with upside targets of 25650, 25700, and potentially 25750+ in extension. Such a breakout would indicate strength and continuation of the recovery move, especially if supported by good volume and broader market participation.
On the downside, failure to sustain above 25400–25450 can lead to a short-term reversal. A rejection from this resistance zone may drag Nifty back toward 25350 and 25300 initially. If selling pressure increases and the index slips below 25200, the downside may extend toward 25100, 25050, and even the psychological 25000 level. The 25000–25050 zone remains a strong demand area where buyers are expected to defend aggressively.
Overall, Nifty is currently placed in a consolidation range with clearly defined support and resistance levels. Traders should avoid aggressive positions during the opening phase and wait for a confirmed breakout or breakdown. Range-bound strategies with strict stop-losses can work better in such conditions, while trend trades should only be taken after a clear move beyond the key levels. Discipline and patience will be crucial as volatility may expand once the consolidation resolves.
Niftyview

NIFTY 50 – Weekly Outlook (Key Levels & Structure)
NIFTY has decisively broken below the rising trendline that was supporting the index for the past few months. This trendline had multiple confirmations, and the breakdown signals a shift from bullish to corrective / sideways-to-bearish structure in the near term.
The index is currently testing a crucial horizontal support zone around 25,000–25,050. This level will be very important for next week’s price action.
⸻
Key Levels to Watch
Support Zones:
• 25,000 – 25,050 → Immediate and psychological support
• 24,600 – 24,650 → Major demand zone (next downside support)
• 24,350 – 24,400 → Strong long-term support if selling accelerates
Resistance Zones:
• 25,350 – 25,450 → Minor pullback resistance
• 25,750 – 25,850 → Breakdown retest zone
• 26,200 – 26,350 → Strong supply / rejection zone
⸻
Market Structure View
• As long as price remains below the broken trendline, rallies may face selling pressure.
• A sustained hold above 25,450 can lead to short-term relief bounce.
• Break and hold below 25,000 may open gates for 24,600 levels in coming sessions.
• Expect volatile moves, especially around weekly expiry and global cues.
⸻
Trading Approach
• Prefer wait & watch near support levels
• Avoid aggressive trades in the middle of the range
• Let price confirm direction before taking positional bias
⸻
Disclaimer
I am not a SEBI registered analyst/advisor.
This analysis is only for educational and informational purposes.
This is NOT a buy or sell recommendation.
Trading in the stock market involves risk. Please consult your financial advisor before taking any trade.
I am not responsible for any profit or loss arising from this analysis.

#NIFTY Intraday Support and Resistance Levels - 24/12/2025A flat opening is expected in Nifty 50, with the index trading near 26,150–26,200, indicating consolidation after the recent upside move. Price is currently holding above the short-term support zone, but lack of strong follow-through suggests the market is in a pause-and-consolidate phase, waiting for a decisive trigger to define the next direction.
On the upside, a sustained move above 26,250 will be crucial to resume bullish momentum. If Nifty holds above this level, long positions can be considered with upside targets at 26,350, 26,400, and 26,450+. A breakout above this resistance zone may attract fresh buying interest and extend the upward move.
On the downside, failure to sustain above 26,200–26,180 may lead to a reversal-based selling opportunity. In such a scenario, short positions can be considered with downside targets at 26,150, 26,100, and 26,050-, where strong intraday support is placed. Until a clear breakout or breakdown occurs, traders are advised to continue focusing on level-based trades, maintain strict risk management, and avoid aggressive directional positions.

TRENT : When price corrects, smart money observes — not panics.NSE:TRENT
Technical View (Monthly)
Long-term trend bullish, currently in a healthy correction
0.618 Fibonacci support: ₹3,900–4,100 → key demand zone
Resistance: ₹4,900–5,000 (must cross for fresh uptrend)
Trend damage only if: Monthly close below ₹3,800
Expect sideways consolidation before the next big move
Fundamental View
Strong retail brands, aggressive store expansion
Earnings growth is strong, but the valuation was stretched
Current correction = valuation & time adjustment, not business issue
Future Growth Outlook
Positive long-term drivers: consumption growth + scale benefits
Near-term returns may stay muted; 3–5 year story intact
Actionable Summary
Investors: Accumulate near ₹4,000 with patience
Traders: Bullish only above ₹5,000
Risk: Breakdown below ₹3,800
Verdict: High-quality stock in correction phase, not a trend reversal.
==============
⚠️ Disclaimer:
==============
This content is shared strictly for educational and informational purposes.
We are not SEBI-registered investment advisors or analysts.
The views expressed are personal opinions, based on publicly available data and market observations.
Please consult a SEBI-registered investment advisor before taking any investment or trading decisions.
Any actions taken based on this content are entirely at your own risk and responsibility.
========================
Trade Secrets By Pratik
========================

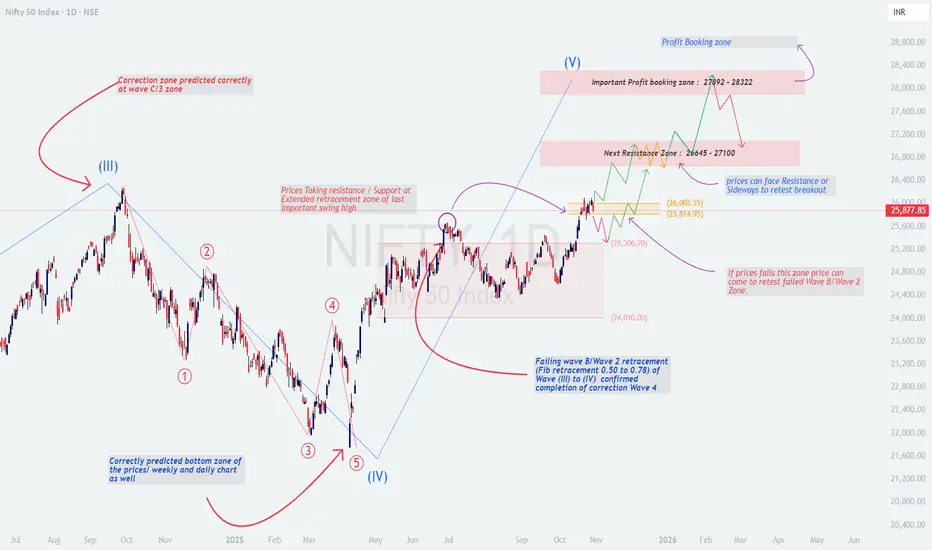
NIFTY : HIT or MISS? Next Move Explained🧠 Nifty Elliott Wave Analysis | Accurate Highs & Bottoms Predicted | Next Move Explained
I had accurately predicted both the top (Wave III) and the bottom (Wave IV) of the Nifty move — as seen in the attached chart 📈
The corrective zone at Wave C / 3 and the final retracement completion around Wave 4 were both identified in advance, confirming the accuracy of our earlier projection.
🔍 Current Technical Outlook
Nifty has completed its Wave (IV) correction and is now attempting to form an impulsive Wave (V) move.
Price is currently trading around 25,880, taking resistance near the extended retracement zone of the previous swing high.
If this level is crossed and sustained, the next upside momentum can unfold in multiple stages as shown below.
📈 Upside Projections
Next Resistance Zone: 26,645 – 27,100
🔸 Price may slow down or move sideways to retest the breakout here.
Major Profit Booking Zone: 27,892 – 28,322
🔸 This is a key Fibonacci extension and Wave (V) target area where partial booking is advised.
⚙️ Support & Risk Levels
Immediate Support: 25,814 – 26,000
Major Support: 25,306
Critical Support / Reconfirmation Zone: 24,010 (Failed Wave B / Wave 2 zone)
📉 If prices fail to hold 25,800–25,300, we may see a retest toward 24,000–24,200, which would only delay but not invalidate the long-term bullish structure.
🧭 Expected Price Behaviour
As long as Nifty stays above 25,300, the Wave (V) uptrend remains intact.
Prices can show sideways consolidation or retest near the breakout before pushing higher.
Any strong breakout above 26,650–27,100 can open the gate for 28,000+ targets.
⚠️ Keep Watch & Stay Cautious
Watch for rejection candles or low-volume breakouts near 26,600–27,000 zone.
Stay alert for profit booking or reversal signals near 27,800+.
Ideal approach: Buy on dips, book partial profits near resistance, trail stop-loss.
📅 Posted on: 30 Oct 2025
nifty50 analysis 11/11/2025.todays (11/11/2025)(nifty50 expiry).
CPR:very narrow+ascendingcpr : trending day
FII:-4,114.85sold.
DII:5,805.26bought.
Highest OI:
Resistance:25700,25800.
Support :25400,25300.
Possibilities:
1hour timeframe
1.nifty can fall from 50ma line because its not sloping upward.
2.market is not clearly uptrend so todays range is 25750 to 25300.
3.also it can take support at 200maline or can break.
conclusion:
My pov: market is can be bearish.if price in its my range i will confirm and then go short,if not i will never trade,also today is expiry, do your own research and be flexible
note:
8moving average ling is blue colour.
20moving average line is green colour
50moving average line is red colour.
200moving average line is black colour.
cpr is for trend analysis.
MA line is for support and resistance.
Disclamier:
Iam not sebi registed so i started this as a hobby,please do your own analysis,any profit/loss you gained is not my concern.I can be wrong please do not take it seriously thank you.
.

“Nifty 50 Intraday Key Levels | Buy & Sell Zones 4th Nov 2025”Want to learn more? Like this post and follow me!”
26070🔴 Above 10m closing Shot Cover Level
Strong resistance — short covering likely above this.
25938🟠 Below 10m hold PE By level /
Above 10m hold CE by level
25838🟣 Above 10M hold positive trade view
Below 10M hold negative trade view
Sentiment deciding level — crucial for trend direction.
25722⚫ Above Opening S1 10m Hold CE By level
Bullish entry level — CE hold area.
25633🟠 Below Opening R1 10m Hold PE By level
Below 10m hold PE By Risky Zone Weak zone — PE may strengthen below this.
25530🟢 Above 10M hold CE By Safe Zone level
Safe bullish zone — CE can be held confidently above.
25490🔵 BELOW 10M hold UNWINDING level
Breakdown zone — unwinding or heavy selling possible below.

“Nifty 50 Intraday Key Levels | Buy & Sell Zones 20th Oct 2025”“Want to learn more? Like this post and follow me!”
26170 🔴 Above 10m closing Shot Cover Level
Strong resistance — short covering likely above this.
26033 🟠 Below 10m hold PE By level /
Above 10m hold CE by level
25923 🟣 Above 10M hold positive trade view
Below 10M hold negative trade view
Sentiment deciding level — crucial for trend direction.
25818 ⚫ Above Opening S1 10m Hold CE By level
Bullish entry level — CE hold area.
25730 🟠 Below Opening R1 10m Hold PE By level
Below 10m hold PE By Risky Zone Weak zone — PE may strengthen below this.
25618 🟢 Above 10M hold CE By Safe Zone level
Safe bullish zone — CE can be held confidently above.
25610 🔵 BELOW 10M hold UNWINDING level
Breakdown zone — unwinding or heavy selling possible below.

“Nifty 50 Intraday Key Levels | Buy & Sell Zones 13th Oct 2025”“Want to learn more? Like this post and follow me!”
25473 🔴 Above 10m closing Shot Cover Level
Strong resistance — short covering likely above this.
25370 🟠 Below 10m hold PE By level /
Above 10m hold CE by level
25283 🟣 Above 10M hold positive trade view
Below 10M hold negative trade view
Sentiment deciding level — crucial for trend direction.
25120 ⚫ Above Opening S1 10m Hold CE By level
Bullish entry level — CE hold area.
24990 🟠 Below Opening R1 10m Hold PE By level
Below 10m hold PE By Risky Zone Weak zone — PE may strengthen below this.
24790 🟢 Above 10M hold CE By Safe Zone level
Safe bullish zone — CE can be held confidently above.
24770 🔵 BELOW 10M hold UNWINDING level
Breakdown zone — unwinding or heavy selling possible below.

“Nifty 50 Intraday Key Levels | Buy & Sell Zones 10th Oct 2025”“Want to learn more? Like this post and follow me!”
25390 🔴 Above 10m closing Shot Cover Level
Strong resistance — short covering likely above this.
25288 🟠 Below 10m hold PE By level /
Above 10m hold CE by level
25218 🟣 Above 10M hold positive trade view
Below 10M hold negative trade view
Sentiment deciding level — crucial for trend direction.
25090 ⚫ Above Opening S1 10m Hold CE By level
Bullish entry level — CE hold area.
25018 🟠 Below Opening R1 10m Hold PE By level
Below 10m hold PE By Risky Zone Weak zone — PE may strengthen below this.
24920🟢 Above 10M hold CE By Safe Zone level
Safe bullish zone — CE can be held confidently above.
24,4920 🔵 BELOW 10M hold UNWINDING level
Breakdown zone — unwinding or heavy selling possible below.

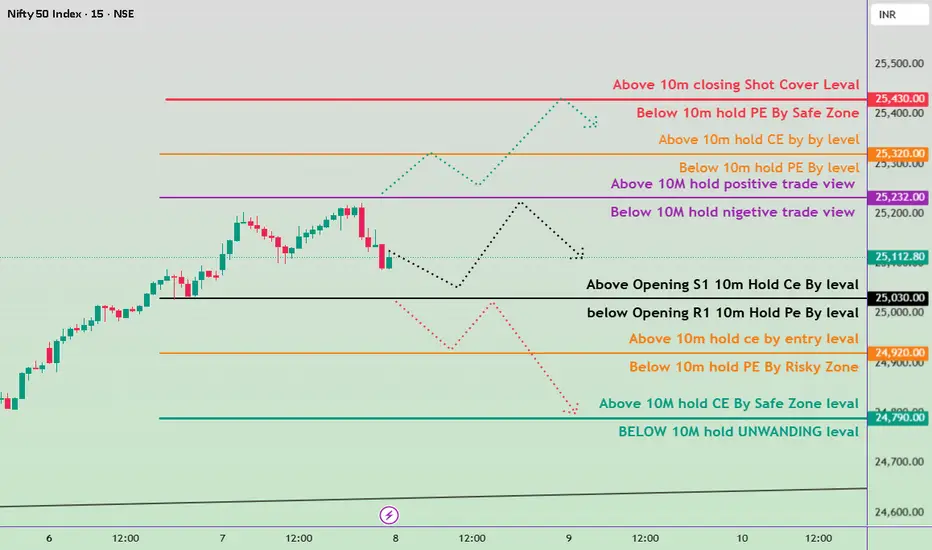
“Nifty 50 Intraday Key Levels | Buy & Sell Zones 8th Oct 2025”“Want to learn more? Like this post and follow me!”
25430 🔴 Above 10m closing Shot Cover Level
Strong resistance — short covering likely above this.
25320 🟠 Below 10m hold PE By level /
Above 10m hold CE by level
25232 🟣 Above 10M hold positive trade view
Below 10M hold negative trade view
Sentiment deciding level — crucial for trend direction.
25030 ⚫ Above Opening S1 10m Hold CE By level
Bullish entry level — CE hold area.
24920🟠 Below Opening R1 10m Hold PE By level
Below 10m hold PE By Risky Zone Weak zone — PE may strengthen below this.
24790🟢 Above 10M hold CE By Safe Zone level
Safe bullish zone — CE can be held confidently above.
24,780 🔵 BELOW 10M hold UNWINDING level
Breakdown zone — unwinding or heavy selling possible below.
“Nifty 50 Intraday Key Levels | Buy & Sell Zones 7th Oct 2025”“Want to learn more? Like this post and follow me!”
25,370 🔴 Above 10m closing Shot Cover Level
Strong resistance — short covering likely above this.
25,233 🟠 Below 10m hold PE By level /
Above 10m hold CE by level
25,128 🟣 Above 10M hold positive trade view
Below 10M hold negative trade view
Sentiment deciding level — crucial for trend direction.
24,990 ⚫ Above Opening S1 10m Hold CE By level
Bullish entry level — CE hold area.
24,890 🟠 Below Opening R1 10m Hold PE By level
Below 10m hold PE By Risky Zone Weak zone — PE may strengthen below this.
24,770 🟢 Above 10M hold CE By Safe Zone level
Safe bullish zone — CE can be held confidently above.
24,700 🔵 BELOW 10M hold UNWINDING level
Breakdown zone — unwinding or heavy selling possible below.

“Nifty 50 Intraday Key Levels | Buy & Sell Zones” 6th Oct 2025Key Levels for Tomorrow:
25,120 → Above 10m closing Short Cover Level (CE Safe Zone)
Below 10m hold PE (Risky Zone)
25,023 → Above 10m hold CE (Entry Level)
Below 10m hold PE (Risky Zone)
24930 → Above 10m hold → Positive Trade View
Below 10m hold → Negative Trade View
24,820 → Above Opening S1 hold CE (Buy Level)
Below Opening R1 hold PE (Sell Level)
24,690 → Above 10m hold CE (Buy Level)
Below 10m hold PE (Sell Level)
24,590 → Above 10m hold CE (Safe Zone)
Below 10m hold UNWINDING Level

“Nifty 50 Intraday Key Levels | Buy & Sell Zones” 3rd Oct 2025“Want to learn more? Like this post and follow me!”
25,073 → Above 10m closing Shot Cover Level
25,070 → Below 10m hold PE By Safe Zone
24,988 → Above 10m hold CE By Entry Level
24,980 → Below 10m hold PE By Risky Zone
24,888 → Above 10m hold Positive Trade View
24,790 → Above Opening S1 hold CE / Below Opening R1 hold PE
24,690 → Above 10m hold CE By Level / Below 10m hold PE By Level
24,590 → Above 10m hold CE By Safe Zone
24,580 → Below 10m hold Unwinding Level

“Nifty 50 Key Levels & Trade Zones 1st Oct 2025”
“Follow me and like this post for more learning tips!”
24890 → Above 10m closing → Short Cover Level (CE Safe Zone)
24790 → Above 10m hold CE (Entry Level)
Below 10m hold PE (Risky Zone)
24718 → Above 10m hold → Positive Trade View
Below 10m hold → Negative Trade View
24570 → Above Opening S1 hold CE (Buy Level)
Below Opening R1 hold PE (Sell Level)
24470 → Above 10m hold CE (Buy Level)
Below 10m hold PE (Sell Level)
24333 → Above 10m hold CE (Safe Zone)
Below 10m hold UNWINDING Level
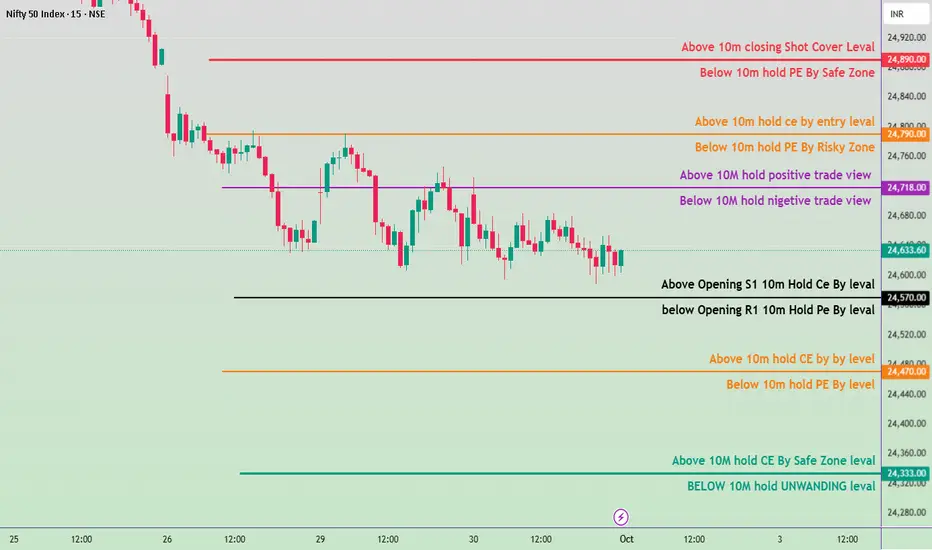
“Nifty 50 Key Levels & Trade Zones – 30th Sept 2025”
“Follow me and like this post for more learning tips!”
Key Levels from the Chart
24,890 – Above 10M Closing Shot Cover Level
24,820 –Above 10M Hold CE by Entry Level
Below 10M Hold PE by Risky Zone
24,722 –Above 10M Hold Positive Trade View
Below 10M Hold Negative Trade View
24,590 –Above Opening S1 10M Hold CE by Level
Below Opening R1 10M Hold PE by Level
24,470 –Above 10M Hold CE by Level
Below 10M Hold PE by Level
24,370 –Above 10M Hold CE by Safe Zone Level
Below 10M Hold Unwinding Level

“Nifty 50 Key Levels & Trade Zones – 29th Sept 2025”“Follow me and like this post for more learning tips!”
24,870 → Above 10m closing Shot Cover Level
24,870 → Below 10m hold PE By Safe Zone
24,778 → Above 10m hold CE By Entry Level
24,770 → Below 10m hold PE By Risky Zone
24,718 → Above 10m hold Positive Trade View
24,718 → Below 10m hold Negative Trade View
24,620 → Above Opening S1 10m hold CE By Level
24,620 → Below Opening R1 10m hold PE By Level
24,520 → Above 10m hold CE By Level
24,520 → Below 10m hold PE By Level
24,418 → Above 10m hold CE By Safe Zone Level
24,418 → Below 10m hold Unwinding Level

“Nifty 50 Key Levels & Trade Zones – 25th Sept 2025”
“Follow me and like this post for more learning tips!”
25,380 → Above 10m closing → Short Cover Level (CE Safe Zone)
25,233 → Above 10m hold CE (Entry Level)
/ Below 10m hold PE (Risky Zone)
25,133 → Above 10m hold → Positive Trade View
/ Below 10m hold → Negative Trade View
24,980 → Above Opening S1 hold CE (Buy Level)
/ Below Opening R1 hold PE (Sell Level)
24,870 → Above 10m hold CE (Buy Level)
/ Below 10m hold PE (Sell Level)
24,730 → Above 10m hold CE (Safe Zone)
/ Below 10m hold UNWINDING Level

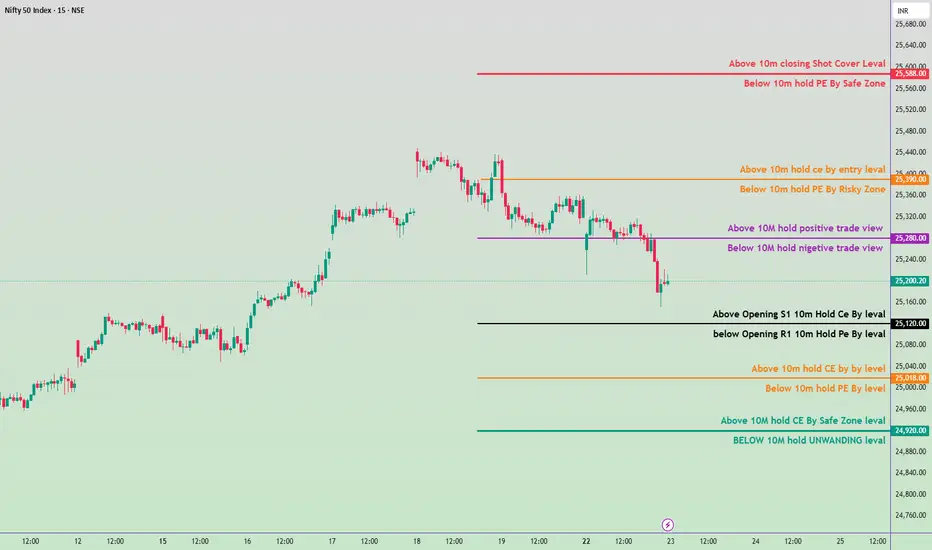
23 sep 2025 Nifty 50 Index with tomorrow’s key levels🔑 Key Levels
25,680 → Above 10m closing Short Cover Level
Below 10m hold PE by Safe Zone
25,390 → Above 10m hold CE by Entry Level
Below 10m hold PE by Risky Zone
25,280 → Above 10m hold Positive Trade View
Below 10m hold Negative Trade View
25,120 → Above Opening S1 10m Hold CE by Level
Below Opening R1 10m Hold PE by Level
25,008 → Above 10m hold CE by Level
Below 10m hold PE by Level
24,920 → Above 10m hold CE by Safe Zone Level
Below 10m hold Unwinding Level
“Stay tuned for more learning – like & follow now!”
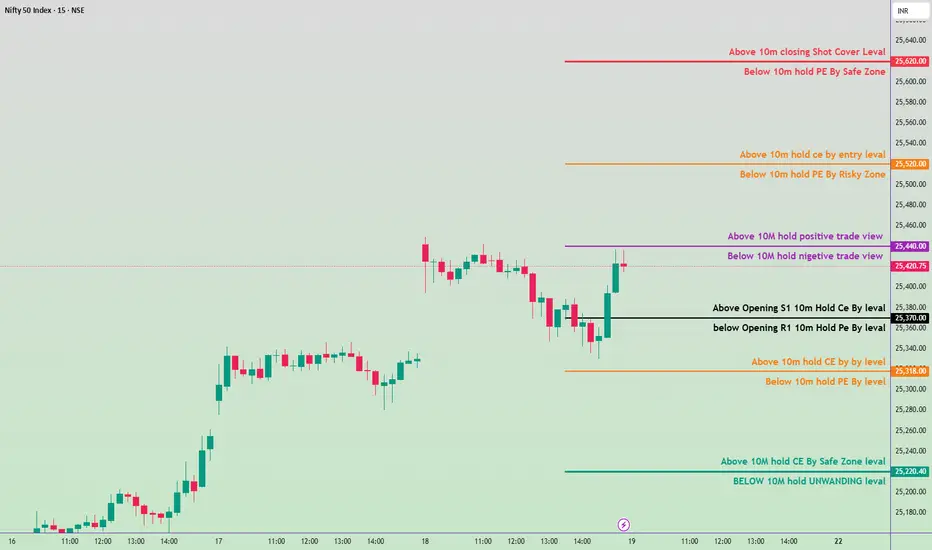
19Sep 2025 Nifty50 trading levelKey Levels
25,623 → Above 10m closing Short Cover Level
25,612 → Below 10m hold PE by Safe Zone
25,530 → Above 10m hold CE by Entry Level
25,520 → Below 10m hold PE by Risky Zone
25,440 → Above 10m hold Positive Trade View
25,430 → Below 10m hold Negative Trade View
25,370 → Below Opening R1 10m Hold PE By Level
25,380 → Above Opening S1 10m Hold CE By Level
25,323 → Above 10m Hold CE By Level
25,316 →Below 10m Hold PE By Level
25,223 → Above 10m hold CE by Safe Zone Level
25,216→ Below 10m hold Unwinding Level
18 sep 2025 support–resistance trading plan Key Levels
25,518 → Above 10m Closing Short Cover Level
(If sustained above, short covering possible)
25,500 Zone → Below 10m Hold PE Safe Zone
25,420 → Above 10m Hold CE Entry Level
Below 10m Hold PE Risky Zone
25,333 → Above 10m Hold Positive Trade View
Below 10m Hold Negative Trade View
25,270 → Above Opening S1 10m Hold CE Buy Level
Below Opening R1 10m Hold PE Buy Level
25,170 → Above 10m Hold CE Buy Level
Below 10m Hold PE Buy Level
25,070 – 25,060 →
25,070 = Above 10m Hold CE Safe Zone
25,060 = Below 10m Hold UNWINDING Level

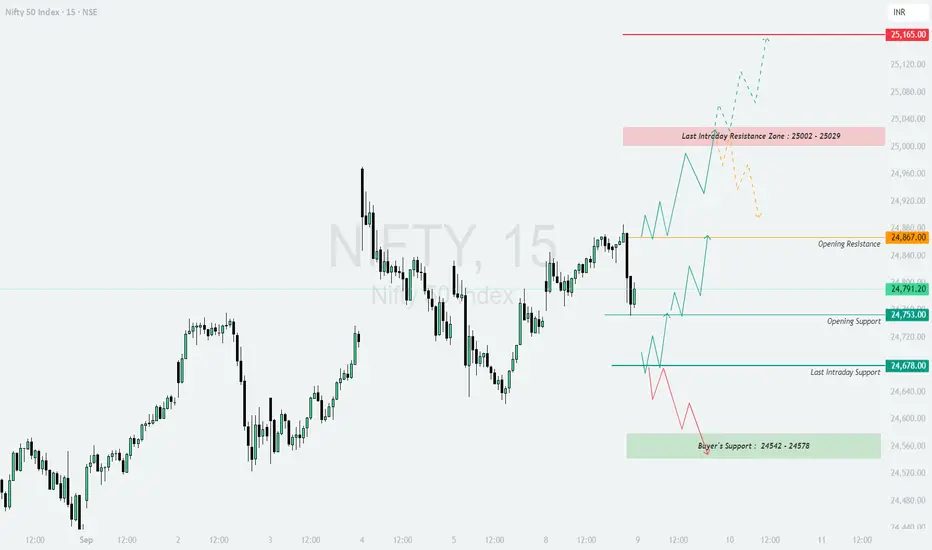
NIFTY : Trading levels and Plan for 09-Sep-2025NIFTY TRADING PLAN – 09-Sep-2025
📌 Key Levels to Watch :
Major Resistance Zone: 25,002 – 25,029
Upside Extension Resistance: 25,165
Opening Resistance: 24,867
Opening Support: 24,753
Last Intraday Support: 24,678
Buyer’s Support Zone: 24,542 – 24,578
The index is currently hovering in a consolidation phase, with clear resistance and support zones that will guide intraday moves. Price action near these levels will determine whether bulls or bears take control.
🔼 1. Gap-Up Opening (100+ points above 24,867)
If Nifty opens above the 24,867 opening resistance, it indicates strong bullish sentiment.
📌 Plan of Action :
Sustaining above 24,867 can push the index into the 25,002 – 25,029 resistance zone.
A breakout and stability above this zone may trigger a rally towards 25,165.
However, early profit booking is likely near 25,002–25,029, so traders must book partial gains and trail stop-losses.
👉 Educational Note: Gap-ups above resistance zones often trap late sellers. Patience is key — wait for at least 15–30 mins of confirmation before adding fresh longs.
➖ 2. Flat Opening (Around 24,750 – 24,820)
A flat opening provides a balanced start, allowing traders to align with early market sentiment.
📌 Plan of Action :
If Nifty sustains above 24,820, expect a move to retest 24,867, and possibly the 25,002–25,029 resistance zone.
Failure to hold 24,753 (opening support) can drag prices to 24,678.
Watch for intraday reversal candles near support zones to gauge whether buyers are defending.
👉 Educational Note: Flat openings are ideal for option writers. Buyers should wait for breakouts or breakdowns to avoid getting stuck in sideways chop.
🔽 3. Gap-Down Opening (100+ points below 24,700)
A gap-down below 24,700 can trigger nervousness among buyers and invite selling pressure.
📌 Plan of Action :
First support lies at 24,678 (last intraday support).
A breakdown below 24,678 could extend selling towards the Buyer’s Support Zone: 24,542–24,578.
If a sharp bounce occurs from this buyer’s zone, short-covering can quickly lift Nifty back to 24,753.
👉 Educational Note: Gap-downs create panic, but disciplined traders look for opportunities near strong supports. Avoid chasing shorts blindly after a big gap-down.
🛡️ Risk Management Tips for Options Traders
Always trade with a strict stop-loss on hourly closing basis.
Limit risk to 1–2% of total capital per trade .
Prefer option spreads (bull call spread / bear put spread) instead of naked calls or puts to reduce time decay impact.
Trail stop-losses as price moves in your favor — never let a winning trade turn into a loss.
Avoid overtrading in choppy zones between 24,753–24,867, as whipsaws are common there.
📌 Summary & Conclusion
🟢 Above 24,867 → Bullish continuation towards 25,002–25,029 and then 25,165 .
🟧 Flat Opening → Range-bound; strength above 24,820, weakness below 24,753 .
🔴 Below 24,700 → Bearish pressure, testing 24,678 and Buyer’s Zone 24,542–24,578 .
⚠️ Critical Zone: 25,002–25,029 (Last Intraday Resistance). Sustaining above this zone can ignite strong upside momentum.
⚠️ Disclaimer: I am not a SEBI-registered analyst. This analysis is for educational purposes only and should not be considered as financial advice. Please consult your financial advisor before making trading decisions.
Nifty 50 Index trading levels Key Levels
25,130 → Above 10m closing Shot Cover Level
Below 10m Hold PE by Safe Zone
24,970 → Above 10m Hold CE by Entry Level
Below 10m Hold PE by Risky Zone
24,821 → Above 10m Hold Positive Trade View
Below 10m Hold Negative Trade View
24,678 → Above Opening S1 10m Hold CE by Level
Below Opening R1 10m Hold PE by Level
24,570 → Above 10m Hold CE by By Level
Below 10m Hold PE by Level
24,380 → Above 10m Hold CE by Safe Zone Level
Below 10m Hold UNWINDING Level
