5th August 2025 trade plan prediction🔼 Bullish Triggers
✅ Above 24,790 = Hold CE by positive trade view
✅ Above 24,920 = Strong bullish breakout (Entry zone for CE)
✅ Above 25,028 = Shot Cover Level → Upside acceleration likely
CE (Call Option) Strategy:
Buy CE above 24,790 for 24,920 / 25,000 targets
Add CE above 25,028 for quick upside move
🔽 Bearish Triggers
🔻 Below 24,700 = Slightly negative bias starts
🔻 Below 24,670 = Below Opening R1 → PE can be bought cautiously
🔻 Below 24,533 = Risk zone → Hold PE by level
🔻 Below 24,433 = UNWINDING zone → Strong bearish momentum
🔻 Below 25,000 = Safe Zone for PE if reversal happens from higher levels
PE (Put Option) Strategy:
Buy PE if breaks 24,670 for 24,533 / 24,433 targets
Add below 24,423 for deeper downside move
Niftyview

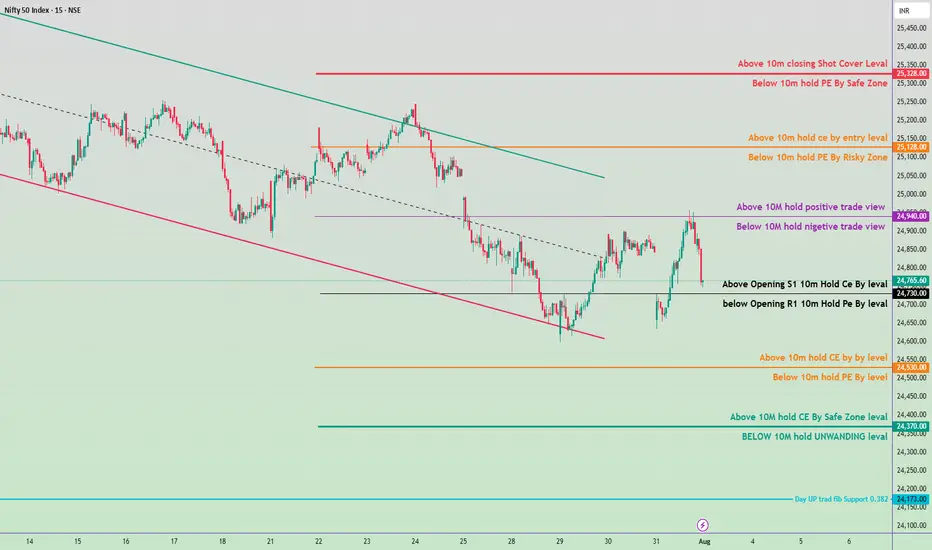
Trade Plan Description for Tomorrow August 1, 2025Bullish Zones & Strategy (Call / CE Levels)
Above 24,765 (Opening S1):
If price sustains above this, bias may shift positive.
🔹 Buy CE (Call) above this level with stop below S1.
Key Upside Resistance Levels:
24,940 – Above this, positive trade view builds (Strong CE Hold).
25,100 - 25,150 – CE entry & momentum zone.
25,350 - 25,382 – Shot Cover Zone (Strong resistance, book profit or expect reversal).
🔻 Bearish Zones & Strategy (Put / PE Levels)
Below 24,765:
Stay cautious – move toward bearish bias if price sustains below.
🔸 Buy PE (Put) below this level with stop above.
Key Downside Support Levels:
24,708 – R1 level; below this, PE strength increases.
24,550 - 24,500 – PE by-level zone.
24,370 – Safe Zone for PE traders.
24,173 - 24,130 – Unwinding + Fib Support.
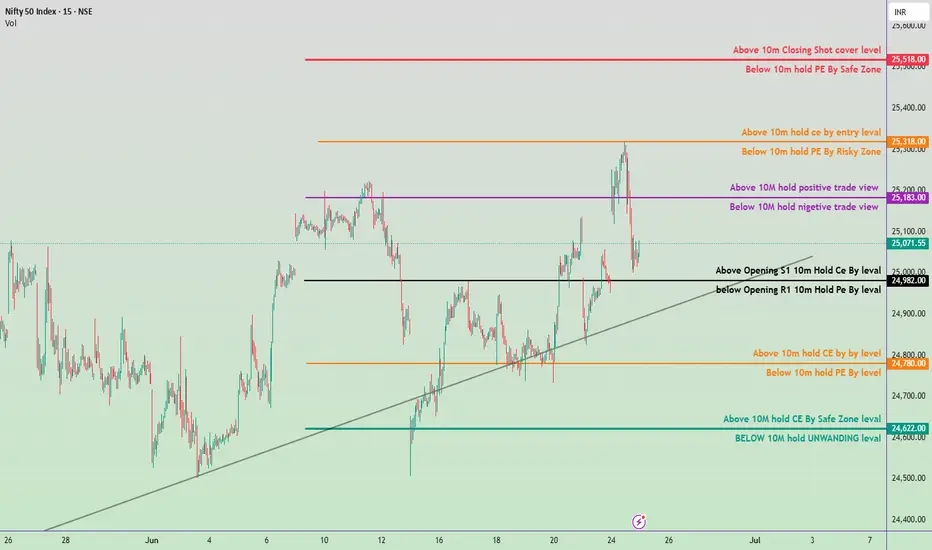
Nifty 50 Intraday Plan for July 22, 2025🔼 Bullish Levels (Call Side - CE):
Above 25,038 : If the market opens and sustains above this level for 10 minutes, you can consider buying CE. This is the first breakout point, indicating possible upward movement.
Above 25,128: Holding above this level indicates a positive trade view. Momentum is expected to increase, and buyers may become more aggressive. Good zone to initiate or add to CE positions.
Above 25,260 : This is the CE entry level where breakout confirmation happens. If price reaches and sustains this zone, it signals strong bullish strength.
Above 25,380 : This is marked as the short-covering zone. If the price reaches here, it means many short traders may exit, creating a spike. Ideal for booking profits on CE trades.
🔽 Bearish Levels (Put Side - PE):
Below 25,038 : If the price fails to sustain above this level and breaks down with 10-minute candle confirmation, it indicates weakness. PE trades can be considered from here.
Below 24,938 : This level is a clear PE entry level. Sustained trading below this suggests downward continuation.
Below 24,920 : This is the risky PE zone. If the market trades here, PE positions should be handled with caution unless strong selling pressure is seen.
Below 24,800 : This is a safe PE zone. Breakdown below this signals confirmed bearish sentiment, and you can aggressively hold PE options.
Below 24,780 : This is the unwinding level, meaning big players may start exiting their positions, possibly triggering sharp declines. Ideal for booking PE profits or trailing stop-loss tightly.

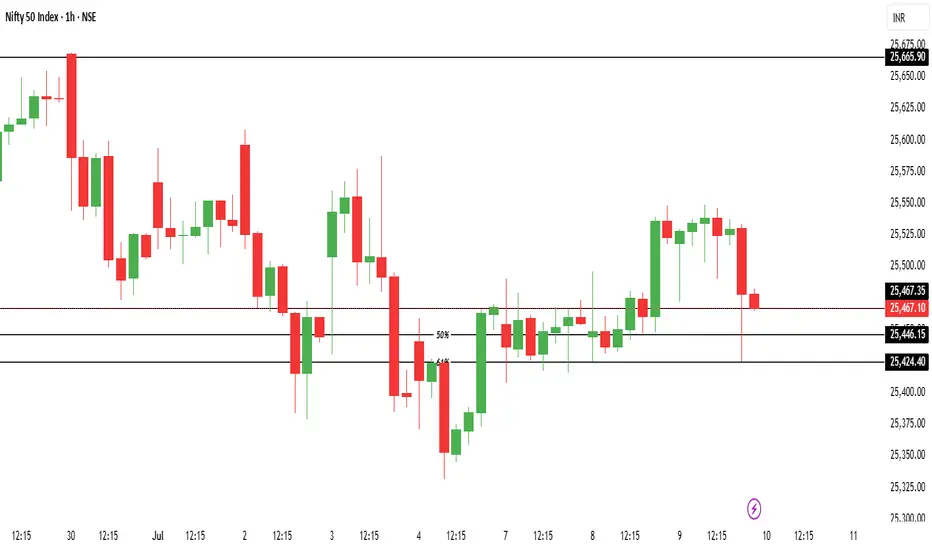
Nifty50 10-07-2025 Trend AnalysisNifty50 analysis 10-07-2025. Regardless the opening, long positions can be created at 25476 (PDC), 25446 or 25424 with swing/intraday potential targets 25665 & 25788.
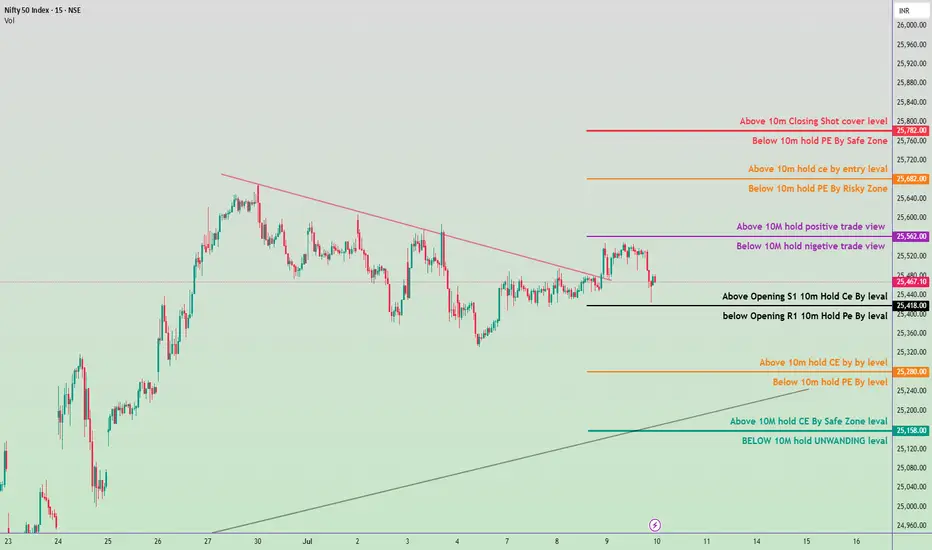
Nifty 50 Intraday Trade Plan 10 july 2025🟣 1. Trend Confirmation Zone (Level: 25,562.00)
Above 25,562.00 → Positive View Active
If Nifty sustains above this level for more than 10 minutes, it indicates bullish momentum. Call Option (CE) traders can stay in the trade or consider new entries.
Below 25,562.00 → Negative View Active
If Nifty stays below this level, bearish momentum is likely. Put Option (PE) trades are favorable.
⚫ 2. Opening Range Levels
Above 25,467.10 (Opening S1) → Hold CE (Call Option)
If the market holds above this after the opening 10-minute candle, you can go long (buy CE).
Below 25,418.00 (Opening R1) → Hold PE (Put Option)
If Nifty breaks this level on the downside, and sustains for 10 mins, it suggests weakness – PE trade is favorable.
🟠 3. Entry-Level Zone
Above 25,682.00 → Entry for CE (Call Option)
Bullish breakout level – good for fresh buying positions if sustained above.
Below 25,682.00 → Risky PE (Put Option) Zone
Aggressive traders may consider short trades, but this is a risky area.
🔴 4. Safe Zone for Positional Traders
Above 25,782.00 → Closing Shot / Cover Level
Indicates overbought or strong bullish continuation – exit PE positions if short.
Below 25,760.00 → Safe Zone for PE
A good place to hold PE (put) positions, as the market is weak below this.
🟠 5. Support Resistance Flip Zone
Above 25,280.00 → CE Hold Level
Support for intraday buyers. A bounce from here can give a CE opportunity.
Below 25,280.00 → PE Hold Level
Breaking this means more downside is likely – favorable for PE.
🟢 6. Strong Support / Breakdown Level
Above 25,158.00 → CE Safe Zone Level
Indicates strong buying support. If held, expect intraday recovery.
Below 25,158.00 → Unwinding Level
Panic selling or unwinding of long positions may start. Avoid CE, prefer PE.
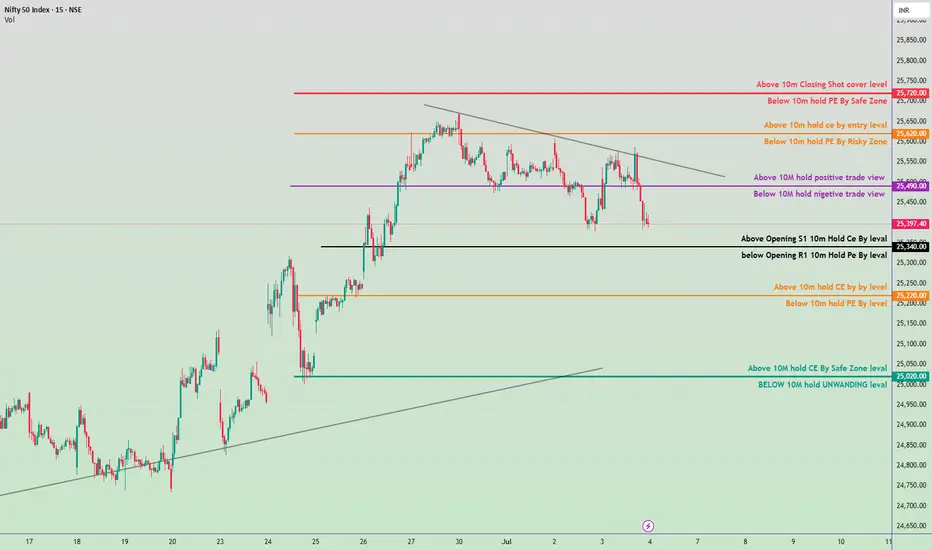
Nifty 50 Intraday Trade Plan for July 4, 2025🔼 Bullish (Call Option / CE Buy Strategy)
✅ Zone 1: Above 25,490
If Nifty holds above 25,490 for 10 minutes, sentiment turns positive.
This is the first sign of bullishness. You can initiate CE positions with caution.
✅ Zone 2: Above 25,620
Holding above 25,620 for 10 minutes = entry confirmation for CE buy.
This is a riskier zone but indicates bullish breakout strength.
✅ Zone 3: Above 25,700
If Nifty sustains or closes above 25,700, short covering may start.
This is a safe zone for CE buyers with strong momentum.
🔽 Bearish (Put Option / PE Buy Strategy)
🚫 Zone 1: Below 25,490
Holding below 25,490 for 10 minutes turns view negative.
Suitable to initiate PE trades cautiously.
🚫 Zone 2: Below 25,340
This is the Opening R1 level. Holding below it confirms bearishness.
Good level to enter PE with confirmation.
🚫 Zone 3: Below 25,220
Holding below this level confirms continuation of bearish move.
Another chance to buy PE if missed above.
🚫 Zone 4: Below 25,000
If Nifty breaks 25,000 and sustains below for 10 minutes:
It enters a strong unwinding zone.
Strong selling may follow.
🔁 Neutral / Flip Zones (Critical for Trend Decision)
➖ 25,340 Zone:
If Nifty stays above 25,340 for 10m, you can try CE.
If it breaks down, look for PE below 25,340.
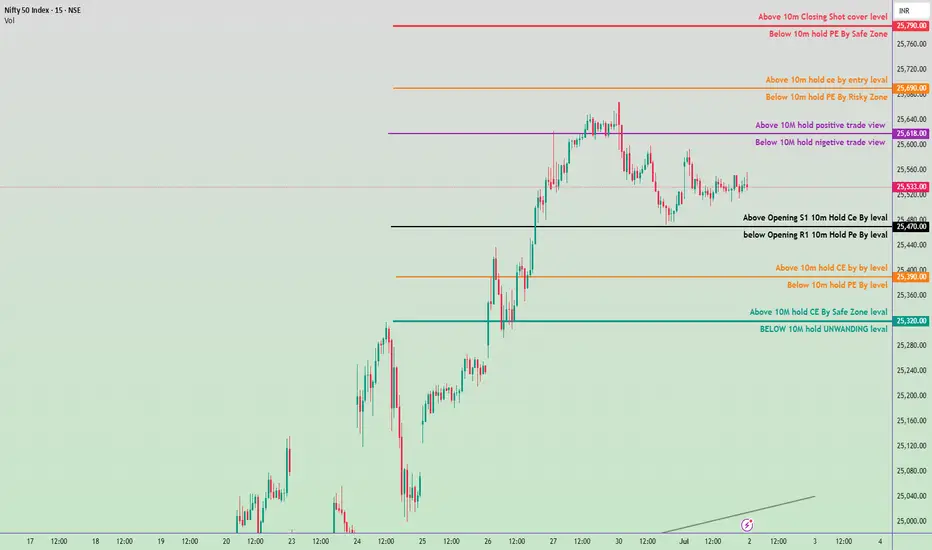
Nifty 50 Intraday Trade Plan 2nd july 2025🔼 Bullish Zones (Calls/CE preferable)
Above ₹25,790 → Closing Shot cover level
Above ₹25,760 → Hold PE by Safe Zone ends
Above ₹25,690 → Entry level for CE (Calls)
Above ₹25,618 → 10M hold positive trade view
Above ₹25,470 → Opening S1 | 10M Hold CE by level
Above ₹25,390 → 10M hold CE by Buy level
Above ₹25,320 → 10M hold CE by Safe Zone level
🔽 Bearish Zones (Puts/PE preferable)
Below ₹25,760 → Hold PE by Safe Zone starts
Below ₹25,690 → Risky Zone for PE
Below ₹25,618 → 10M hold negative trade view
Below ₹25,470 → Opening R1 | 10M Hold PE by level
Below ₹25,390 → 10M hold PE by level
Below ₹25,320 → UNWINDING level (Strong support loss)
📌 Trade Plan Guidelines
🔹 Above ₹25,618 with volume: Favor CE (calls), look for targets up to ₹25,690–₹25,790.
🔹 Below ₹25,470 with confirmation: Favor PE (puts) toward ₹25,390–₹25,320.
🔹 Avoid trading between ₹25,470–₹25,618 if price is consolidating — this is a neutral “no trade zone”.
📉 Below ₹25,320, expect strong unwinding.
June 26, 2025 Nifty 50 breakout & breakdawon Levals✅ Bullish View Zones:
(Call Option CE Focus)
Above 25,630 – 10m Closing Shot cover level
Above 25,432 – 10m hold CE by Entry level
Above 25,322 – 10M hold: Positive trade view
Above 25,180 – Opening S1 + 10m hold CE by level
Above 25,060 – 10m hold CE by level
Above 24,912 – 10M hold CE by Safe Zone level
❌ Bearish View Zones:
(Put Option PE Focus)
Below 25,630 – 10m hold PE by Safe Zone
Below 25,432 – 10m hold PE by Risky Zone
Below 25,322 – 10M hold: Negative trade view
Below 25,180 – Opening R1 + 10m hold PE by level
Below 25,060 – 10m hold PE by level
Below 24,912 – 10M hold UNWINDING level
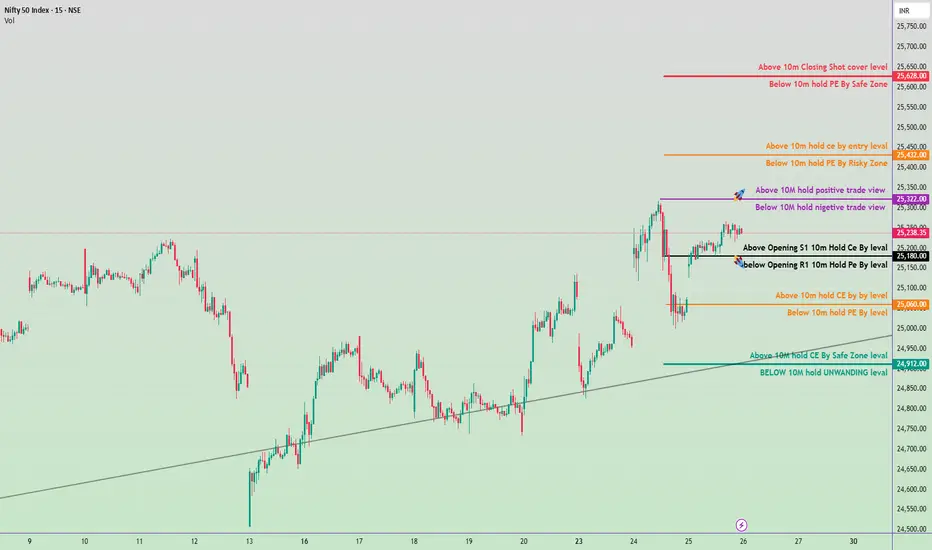
June 25, Nifty 50 intraday trade plan for tomorrow✅ Bullish Zones (Call Buyer Favorable):
🔺 Above 25,518
→ Closing short-covering level
Strong breakout / upside momentum
🟧 Above 25,318
→ 10M hold CE by entry level
Safe CE entry zone
🟪 Above 25,183
→ Positive trade view zone
⚫ Above 24,982
→ Opening S1 CE hold level
🟩 Above 24,622
→ Safe zone for CE buying
❌ Bearish Zones (Put Buyer Favorable):
🔻 Below 25,518
→ Safe zone for PE buyers
🟧 Below 25,318
→ Risk zone for PE buyers
🟪 Below 25,183
→ Negative trade view zone
⚫ Below 24,982
→ Opening R1 PE hold level
🟧 Below 24,780
→ 10M PE hold level
🟦 Below 24,622
→ Unwinding zone – Weak market signal
📊 Tomorrow’s Trading Strategy
Opening Above 25,183
Look for CE Buying Opportunities.
Target 25,318 → 25,518.
Opening Between 25,071–24,982
Neutral to cautious zone.
Wait for price action confirmation near key levels.
Opening Below 24,780
Look for PE Buying or CE Selling.
Possible test of 24,622 → 24,500 zone.
Trendline Support Near 24,850
If broken, expect downside acceleration.
(june 2, 2025) trade plan for tomorrow🔥 99% Working Trading Plan 🔥
(For educational purposes only — trade at your own risk)
📈 Gap-Up Opening Strategy
➡️ If market opens above 24822 and holds for 15 min,
✅ Go LONG — Targets:
• 24940
• 25070
➡️ If market opens below 24822 but fails to break above in 15 min,
❌ Go SHORT — Targets:
• 24688
• 24610
📉 Gap-Down Opening Strategy
➡️ If market opens above 24688 and holds for 15 min,
✅ Go LONG — Targets:
• 24822
• 24940
• 25070
➡️ If market opens below 24688 and fails to break above in 15 min,
❌ Go SHORT — Targets:
• 24618
• 24520
🔒 Trading Rules (Must Follow):
📌 Never enter a trade without a 20-point stop loss
📌 Activate a trade only after 5M 2 candle closes above/below the level
📌 Don’t jump into trades immediately at level — wait for confirmation
📌 Full risk is your own, not me

(May 31, 2025) trade plan for tomorrow#Nifty50 #option trading
🚀 If you like my trading plan and levels, don't forget to boost the post
99% working trading plan
👉Gap up open 24822 above & 15m hold after positive trade target 24940, 25070
👉Gap up open 24822 below 15m not break upside after nigetive trade target 24688 , 24610
👉Gap down open 24688 above 15m hold after positive trade target 24822 ,24940, 25070
👉Gap down open 24688 below 15m not break upside after nigetive trade target 24618, 24520
📌 Trade plan for education purpose I'm not responsible your trade
More education follow social media and boost my idea
📌 koi bhi trade leval se 20 point ke sl ke bhina karan nahi hi
📌 koi trade app activate tabhi karana hota hi level pe 2 candle uper ya niche closing aati hai to
📌 leval par Ane pe turant trade plan na kare ...
📌 Full risk apaki hi hi meri nahi

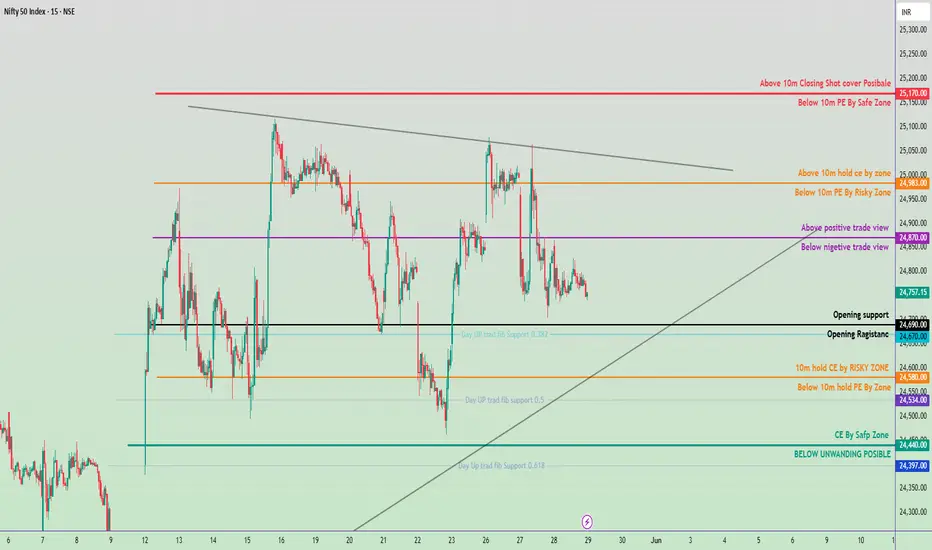
May 29, 2025 Nifty 50 Trading Zone 🔺 Bullish Bias If:
Price sustains above 24,870:
Expect move towards 24,983 (Above 10M CE zone).
Target: 25,170 (Short covering may trigger).
Strategy: Buy on dips above 24,870 with SL below 24,840.
🔻 Bearish Bias If:
Price falls below 24,670:
Likely to test 24,580 and 24,534 ( PE zones).
Break below 24,440 opens downside to 24,397 (unwinding zone).
Strategy: Sell on rise below 24,670 with SL above 24,720.
⚖️ Neutral/Bounce Zone:
Between 24,710 – 24,870:
Choppy moves expected; avoid fresh positions unless breakout confirms.
📌 Key Levels to Watch:
Breakout Level (Upside): 24,870
Breakdown Level (Downside): 24,670
Major Support: 24,397
Major Resistance: 25,170
26 may Nifty50 important levels trading zone#Nifty50 #option trading
🚀 If you like my trading plan and levels, don't forget to boost the post
99% working trading plan ( Opning Possibility FLAT to down )
👉Gap up open 24960 above & 15m hold after positive trade target 25140, 25370
👉Gap up open 24960 below 15m not break upside after nigetive trade target 24790 , 24670
👉Gap down open 24790 above 15m hold after positive trade target 24960 ,
👉Gap down open 24790 below 15m not break upside after nigetive trade target 24670, 24540
📌 Trade plan for education purpose I'm not responsible your trade
More education follow social media and boost my idea
📌 koi bhi trade leval se 20 point ke sl ke bhina karan nahi hi
📌 koi trade app activate tabhi karana hota hi level pe 2 candle uper ya niche closing aati hai to
📌 leval par Ane pe turant trade plan na kare ...
📌 Full risk apaki hi hi meri nah

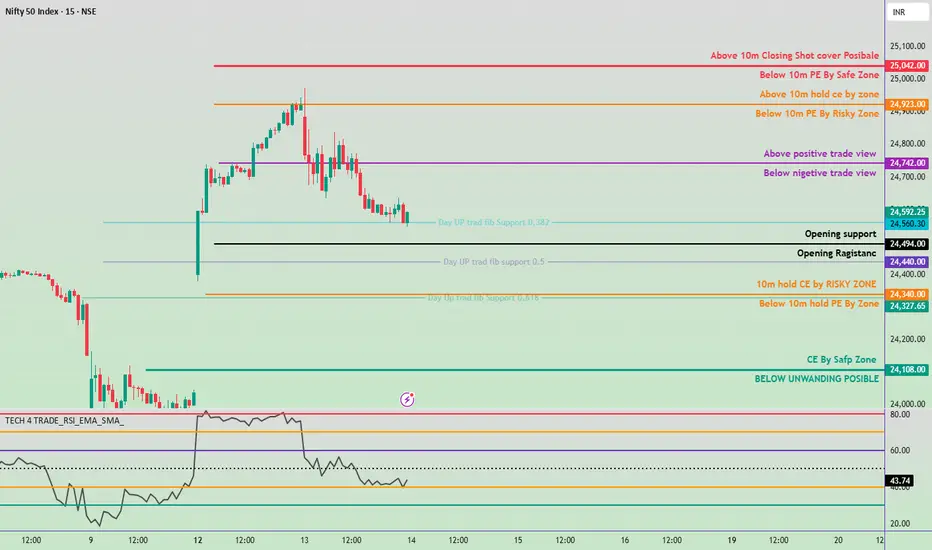
13th May 2025 Nifty 50 Prediction & Trading Zone#Nifty50 #option trading
🚀 If you like my trading plan and levels, don't forget to boost the post
99% working trading plan ( Opning Possibility FLAT TO DOWN )
👉Gap up open 24742 above & 15m hold after positive trade target 24923, 25040
👉Gap up open 24742 below 15m not break upside after nigetive trade target 24490, 24340
👉Gap down open 24490 above 15m hold after positive trade target 24742 ,24923, 25040
👉Gap down open 24490 below 15m not break upside after nigetive trade target 24340, 24108
📌 Trade plan for education purpose I'm not responsible your trade
More education follow social media and boost my idea
📌 koi bhi trade leval se 20 point ke sl ke bhina karan nahi hi
📌 koi trade app activate tabhi karana hota hi level pe 2 candle uper ya niche closing aati hai to
📌 leval par Ane pe turant trade plan na kare ...
📌 Full risk apaki hi hi meri nahi
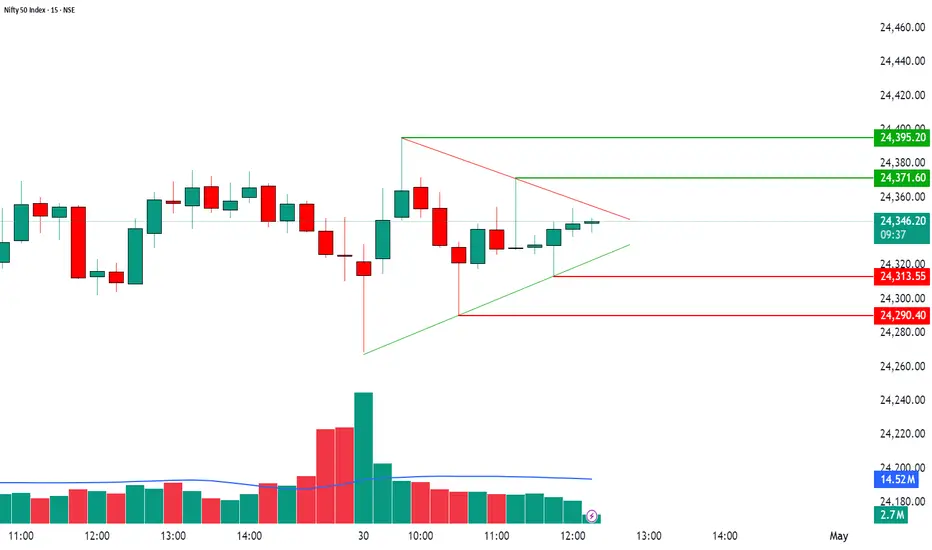
Setup – Watch This Triangle Breakout! 🔺 Nifty50 Triangle Breakout – Big Move Loading? 📊
📆 30th April | 15-Minute Chart
Nifty is tightly squeezed inside a symmetrical triangle, and a breakout or breakdown looks imminent!
🔍 Levels to Watch:
📈 Breakout Above: 24,371.60 → Possible Level: 24,395.20+
📉 Breakdown Below: 24,313.55 → Possible Level: 24,290.40-
📊 Volume is compressing – this usually signals a powerful move ahead.
Wait for clear candle confirmation with volume before entering. 🔔
💬 Patience pays. Trade the breakout, not the noise!
$NSE:NIFTY - Analysis For Tomorrow!🚨 Nifty 50 Breakout Incoming? | Symmetrical Triangle on 15-min Chart.
NSE:NIFTY is consolidating within a symmetrical triangle pattern on the 15-minute chart — a classic setup that often leads to a strong breakout or breakdown.
📊 Chart Setup:
Pattern: Symmetrical Triangle (Neutral)
Price Action: Compressing between rising support & falling resistance
View : Price nearing the tip — breakout imminent
✅ Bullish Scenario:
Breakout above 24,541
Targets: 24,666 → 24,737
✅ Watch for volume confirmation and follow-through candles
❌ Bearish Scenario:
Breakdown below 24,383
Targets: 24,186 → 24,041
❗ Confirm with a breakdown candle + failed retest
🔑 Key Support & Resistance:
Resistance: 24,541 | 24,666 | 24,737
Support: 24,383 | 24,186 | 24,041
📌 Note: Symmetrical triangles are neutral patterns. Wait for a confirmed breakout/breakdown with strong volume before entering a trade.

6th May 2025 Nifty 50 Prediction #Nifty50 #option trading
🚀 If you like my trading plan and levels, don't forget to boost the post
99% working trading plan (Opning Possibility Flat )
👉Gap up open 24518 above & 15m hold after positive trade target 24628, 24880+
👉Gap up open 24518 below 15 m not break upside after nigetive trade target 24360,
👉Gap down open 24360 above 15m hold after positive trade target 24518, 24880
👉Gap down open 24360 below 15 m not break upside after nigetive trade target 24238,
👉 Gap down open Trade NIFTY NIFTY 08 MAY 24400 CALL 82 @
👉 Gap up open Trade NIFTY 08 MAY 24500 PUT 78@
💫big gapdown open 24238 above 1st positive trade view
💫big Gapup opening 24628 below 1st nigetive trade view
📌 Trade plan for education purpose I'm not responsible your trade
More education follow social media and boost my idea
📌 koi bhi trade leval se 20 point ke sl ke bhina karan nahi hi
📌 koi trade app activate tabhi karana hota hi level pe 2 candle uper ya niche closing aati hai to
📌 leval par Ane pe turant trade plan na kare ...
📌 Full risk apaki hi hi meri na

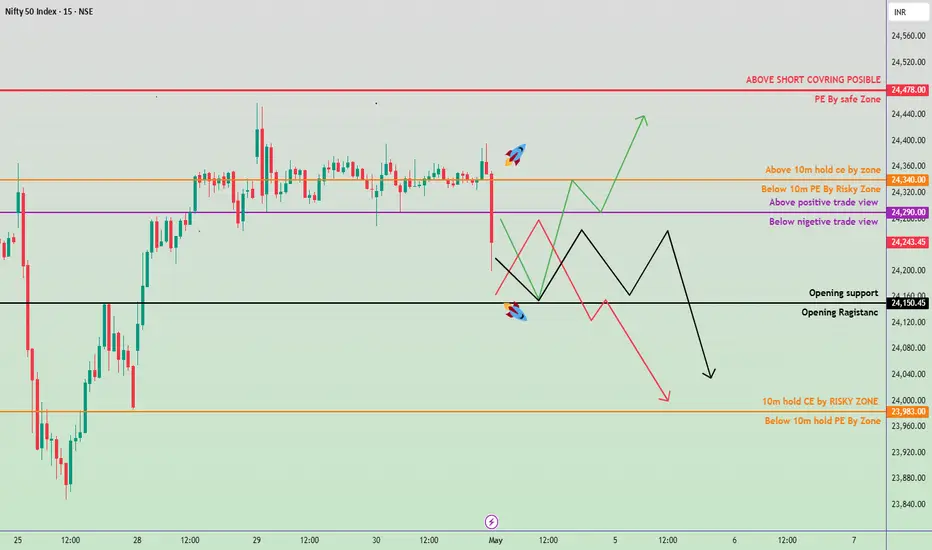
2nd May nifty50 Trading Zone #Nifty50 #option trading
🚀 If you like my trading plan and levels, don't forget to boost the post
99% working trading plan
👉Gap up open 24290 above & 15m hold after positive trade target 24340, 24470+
👉Gap up open 24290 below 15 m not break upside after nigetive trade target 24160, 23990
👉Gap down open 24150 above 15m hold after positive trade target 24340, 24470+
👉Gap down open 24150 below 15 m not break upside after nigetive trade target 23990, 23730,
💫big gapdown open 23987 above 1st positive trade view
💫big Gapup opening 24348 below 1st nigetive trade view
📌 Trade plan for education purpose I'm not responsible your trade
More education follow social media and boost my idea
📌 koi bhi trade leval se 20 point ke sl ke bhina karan nahi hi
📌 koi trade app activate tabhi karana hota hi level pe 2 candle uper ya niche closing aati hai to
📌 leval par Ane pe turant trade plan na kare ...
📌 Full risk apaki hi hi meri nah
30 April Nifty Trade Zone#Nifty50 #option trading
99% working trading plan
👉Gap up open 24470 above & 15m hold after positive trade target 24570,
👉Gap up open 24470 below 15 m not break upside after nigetive trade target 24270 , 24160
👉Gap down open 24270 above 15m hold after positive trade target 24470 , 24570
👉Gap down open 24270 below 15 m not break upside after nigetive trade target 24160, 23873,
💫big gapdown open 24160 above 1st positive trade view
💫big Gapup opening 24570 below 1st nigetive trade view
📌 Trade plan for education purpose I'm not responsible your trade
More education follow social media and boost my idea
📌 koi bhi trade leval se 20 point ke sl ke bhina karan nahi hi
📌 koi trade app activate tabhi karana hota hi level pe 2 candle uper ya niche closing aati hai to
📌 leval par Ane pe turant trade plan na kare ...
📌 Full risk apaki hi hi meri nah

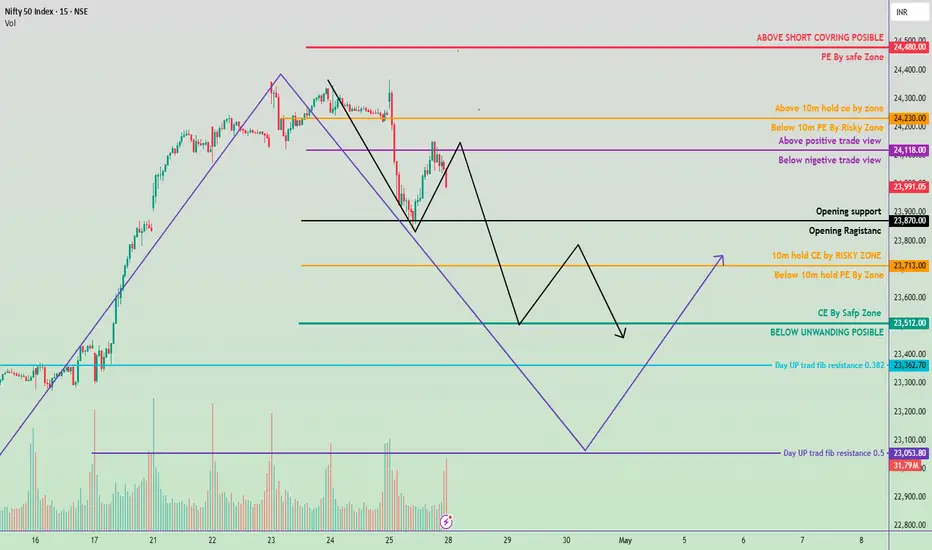
28 april nifty trading zone#Nifty50 #option trading
99% working trading plan
👉Gap up open 24118 above & 15m hold after positive trade target 24230,
👉Gap up open 24118 below 15 m not break upside after nigetive trade target 23870, 23713, 23512
👉Gap down open 24112 above 15m hold after positive trade target 24118 , 24230
👉Gap down open 24112 below 15 m not break upside after nigetive trade target 23870, 23713, 23512
💫big gapdown open 23713 above 1st positive trade view
💫big Gapup opening 24230 below 1st nigetive trade view
📌 Trade plan for education purpose I'm not responsible your trade
More education follow social media and boost my idea
📌 koi bhi trade leval se 20 point ke sl ke bhina karan nahi hi
📌 koi trade app activate tabhi karana hota hi level pe 2 candle uper ya niche closing aati hai to
📌 leval par Ane pe turant trade plan na kare ...
📌 Full risk apaki hi hi meri nah
23 April nifty50 trade zone #Nifty50 #option trading
99% working trading plan
👉Gap up open 24170 above & 15m hold after positive trade target 24220,
👉Gap up open 24170 below 15 m not break upside after nigetive trade target 24112, 24030, 23970
👉Gap down open 24112 above 15m hold after positive trade target 24170, 24220
👉Gap down open 24112 below 15 m not break upside after nigetive trade target 24030, 24970
💫big gapdown open 24036 above 1st positive trade view
💫big Gapup opening 24220 below 1st nigetive trade view
📌 Trade plan for education purpose I'm not responsible your trade
More education follow & support me
📌 koi bhi trade leval se 20 point ke sl ke bhina karan nahi hi
📌 koi trade app activate tabhi karana hota hi level pe 2 candle uper ya niche closing aati hai to
📌 leval par Ane pe turant trade plan na kare ...
📌 Full risk apaki hi hi meri nah

Nifty levels - Mar 25, 2025Nifty support and resistance levels are valuable tools for making informed trading decisions, specifically when combined with the analysis of 5-minute timeframe candlesticks and VWAP. By closely monitoring these levels and observing the price movements within this timeframe, traders can enhance the accuracy of their entry and exit points. It is important to bear in mind that support and resistance levels are not fixed, and they can change over time as market conditions evolve.
The dashed lines on the chart indicate the reaction levels, serving as additional points of significance to consider. Furthermore, take note of the response at the levels of the High, Low, and Close values from the day prior.
We hope you find this information beneficial in your trading endeavors.
* If you found the idea appealing, kindly tap the Boost icon located below the chart. We encourage you to share your thoughts and comments regarding it.
Wishing you success in your trading activities!

Nifty levels - Mar 24, 2025Nifty support and resistance levels are valuable tools for making informed trading decisions, specifically when combined with the analysis of 5-minute timeframe candlesticks and VWAP. By closely monitoring these levels and observing the price movements within this timeframe, traders can enhance the accuracy of their entry and exit points. It is important to bear in mind that support and resistance levels are not fixed, and they can change over time as market conditions evolve.
The dashed lines on the chart indicate the reaction levels, serving as additional points of significance to consider. Furthermore, take note of the response at the levels of the High, Low, and Close values from the day prior.
We hope you find this information beneficial in your trading endeavors.
* If you found the idea appealing, kindly tap the Boost icon located below the chart. We encourage you to share your thoughts and comments regarding it.
Wishing you success in your trading activities!
