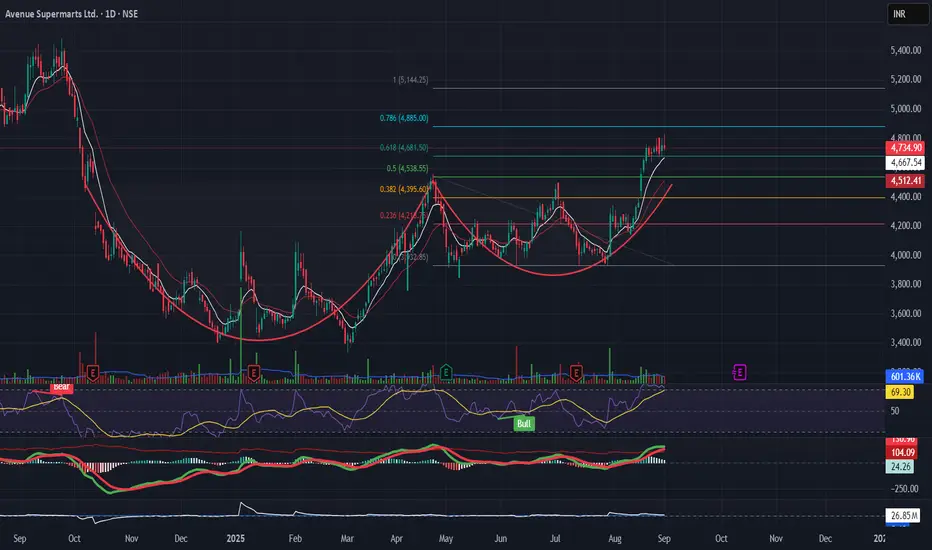
D’Mart (Consumption) Possible Throwback to breakout levelD’Mart (Consumption)
Chart Context:
D’Mart after its breakout near ₹4524 with EMAs aligned bullishly d'Mart Start Weakening and possible throwback to the breakout level. RSI is above 69, indicating strength. Fib levels highlight potential upside to ₹4,885 → ₹5,145.
Post Caption:
"D’Mart sustaining above ₹4,524 breakout zone.
Upside levels: ₹4,885 → ₹5,145.
Stop near ₹4,540.
🛒 Consumption theme continues to show leadership."
Nse
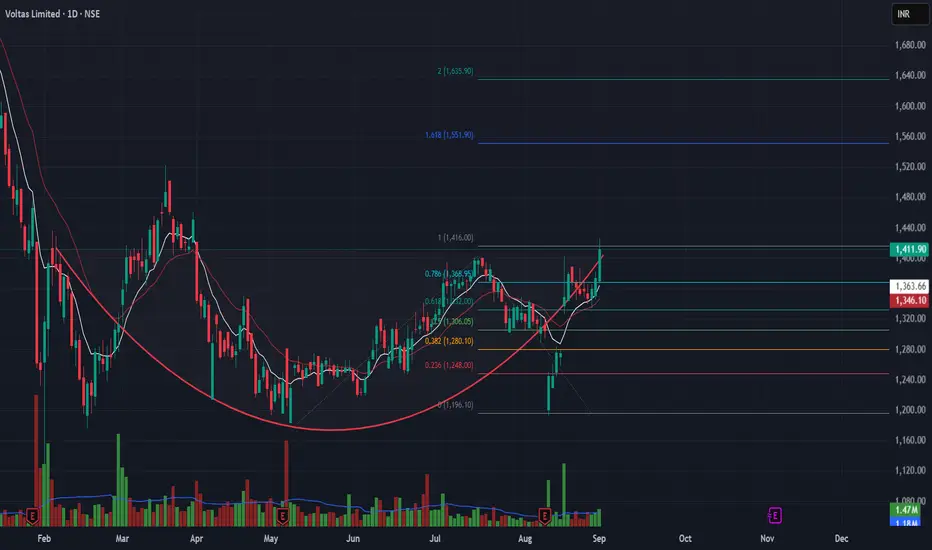
Voltas Ready for a Breakout from Rounding bottom
resistance zone ₹1,416–1,420.
Breakout above 1420 = target ₹1,550 → ₹1,635.
Support: ₹1,360.
⚡ Consumer durables joining the sector rotation trend."
voltas tested ₹1,416 Fib level but faced rejection. RSI remains strong (65+), MACD supportive, indicating trend is still intact. Needs breakout above ₹1,420 for confirmation.
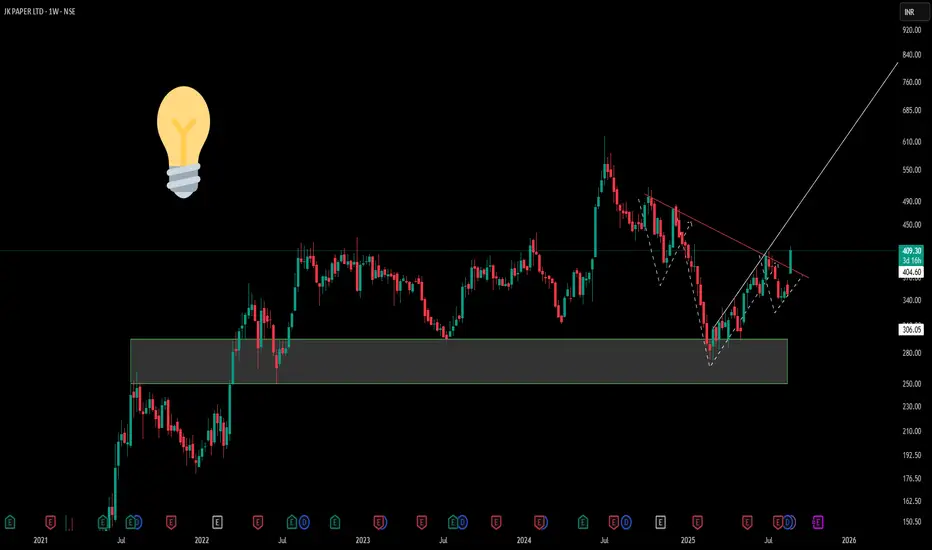
The Anatomy of Market Structure : JK PAPER1) Supply-Demand Conversion Zone Observation
The highlighted grey rectangular zone on the chart represents a critical supply-demand conversion area. This zone, spanning approximately the ₹280-₹320 range, has historically acted as a significant inflection point where institutional money flow patterns have shifted.
2) The Inverted Head and Shoulders Formation
Above this conversion zone sits a textbook inverted head and shoulders pattern, meticulously marked with dotted lines. This formation showcases three distinct troughs:
-Left Shoulder: Formed during the initial decline phase
-Head: The deepest trough representing maximum bearish sentiment
-Right Shoulder: A higher low indicating weakening selling pressure
3) The pattern's neckline resistance (depicted by the red counter-trend line) : Its true nature is to provide resistance as a downward sloping trend continues up until trend shifts, also know as Market structure shift .
Disclaimer: This analysis is purely educational and structural in nature. It does not constitute investment advice, trading recommendations, or buy/sell signals. Always conduct your own research and consult with qualified financial advisors before making investment decisions.
Observing Charts Smarter: Learning Price Action Made EasyIn this video, I share how simple trading observations and “talking to the charts” can improve your understanding of price action and trade movements. By reviewing Apollo’s chart, we explore how breakout patterns, retracements, and higher highs unfold in real time. The goal is not prediction, but sharpening your ability to read market structure, avoid wrong entries, and reduce big drawdowns—ultimately helping you become a more disciplined trader.

Stock Showdown Saturday: Can You Spot the Trade?Disclaimer:
The chart used in this video is from May 2023 (over 3 months old). It is shown only for educational purposes, to demonstrate strategy-building ideas and share trading experience. This is not financial advice and should not be considered as a recommendation to buy, sell, or skip any stock. Always do your own research before making trading decisions.

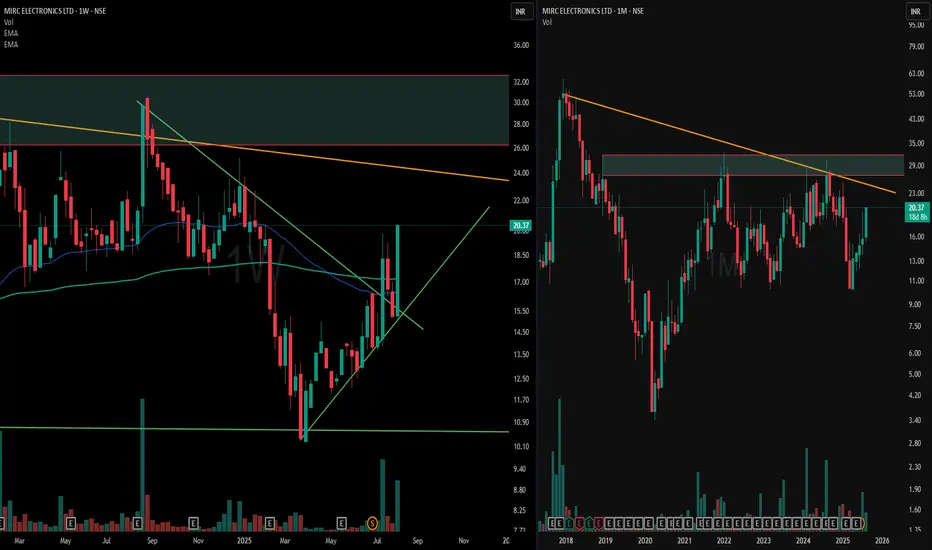
From Breakdown to Structure: A Tale of Two Timeframes📊 Left Chart – Weekly Timeframe (WTF)
Price shifted from a series of lower highs/lows to forming a W-bottom entirely below the 200 & 50 EMA. Post-recovery, it moved into a channel consolidation, held by a green ascending support and capped by a green counter-trendline, creating a clean geometric structure.
📈 Right Chart – Monthly Timeframe (MTF)
A broader view reveals multi-fold hindrances, with red & orange trendlines marking a multi-year counter-trend. Each upside push faces historical resistance near the supply zone.
📝 Editorial Note:
Not a forecast — simply a snapshot of evolving structure from compressed weekly action to obstacle-heavy monthly context.
How I Identify High‑Probability Setups Using Weekly + Daily TFI daily make educational content videos for Posts for Swing Trading
📌 This post is for educational purposes only and is not financial or investment advice

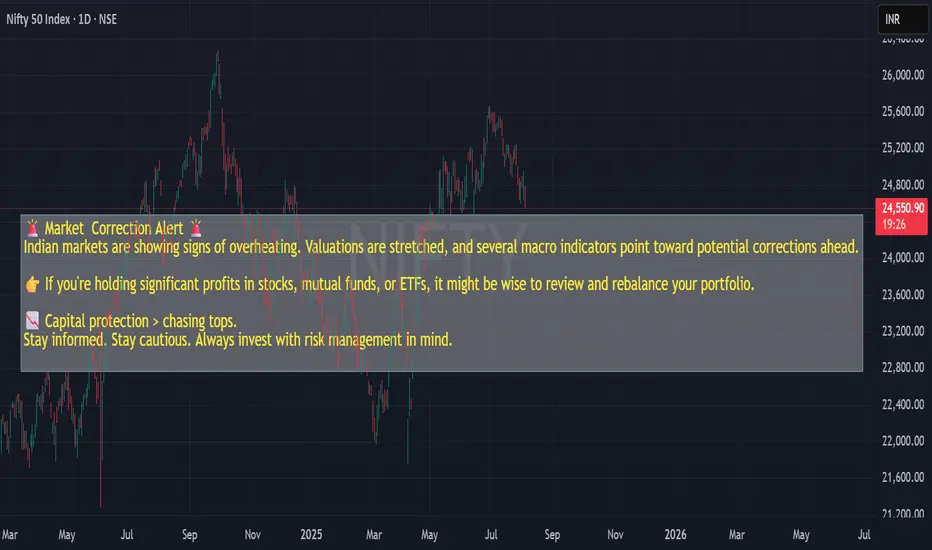
Nifty50-Macro Risk Update - shows Overheating - Correction Alert📊 Market Observation | August 1, 2025
This Nifty 50 daily chart highlights potential macro risks that may influence investor behavior.
🧠 Key Insights:
- Valuations appear stretched on multiple metrics.
- Price structure has formed lower highs post-peak.
- Macro indicators suggest possible correction ahead.
🟡 Educational Note:
If you're holding long-term positions, this may be a good time to revisit portfolio allocations with a focus on capital preservation.
📌 Risk Management Reminder:
Capital protection often outweighs return chasing near potential tops.
All observations are structure-based and educational. This is not financial advice.
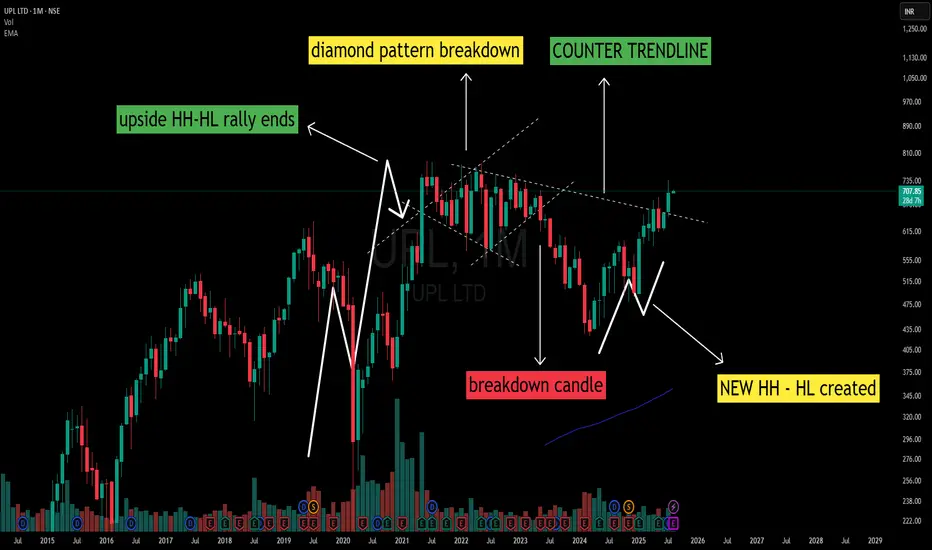
UPL – Diamond Pattern Breakdown to W-Bottom Reversal The monthly chart of UPL reflects a complete structural cycle:
1️⃣ Uptrend Phase:
A clear sequence of Higher Highs – Higher Lows (HH-HL) marked the early rally.
2️⃣ Diamond Pattern at Peak:
A diamond-shaped consolidation developed at the top of the rally, a common occurrence near trend maturity.
3️⃣ Breakdown & Downtrend:
A breakdown candle from the diamond pattern initiated a period of Lower Highs – Lower Lows (LH-LL), establishing a sustained downtrend.
4️⃣ W-Bottom Formation:
At the lower structure, a W-bottom emerged with Higher Low formation followed by a Higher High, indicating a structural shift.
5️⃣ Counter Trendline Interaction:
The earlier diamond pattern boundary has evolved into a counter trendline, now serving as an important structural reference zone.
📌 Observation:
The counter trendline remains a key structural reference on higher timeframes. This is a technical observation and not a directional view.
Swiggy Ltd. Reserch ReportBuy/Sell/Hold Recommendation:
Given Swiggy’s strong revenue growth but continued losses and negative cash flows, the stock currently represents a high-risk, high-reward opportunity. Unless you have a high risk appetite and a long-term horizon, a "Hold" stance is appropriate—wait for visible margin improvement and positive cash flows before considering aggressive buying. For conservative investors, it’s best to avoid new buys until profitability and sustainable cash generation are in sight. Only enter or add if Swiggy shows concrete signs of turning profitable and scaling successfully.
HOld (Overvalued)
Swiggy Investment Report: Independent Strategic & Financial Outlook
Introduction
Swiggy, a leading player in India’s food delivery and quick commerce industry, continues to pursue aggressive growth and operational dominance, shaping its own strategic path amid sector challenges.
Financial Metrics
In FY25, Swiggy posted revenue of ₹15,227Cr but remained loss-making with a net deficit of ₹3,117Cr and negative EBITDA margins, reflecting heavy investment in technology, logistics, and expansion—especially in its Instamart quick commerce division. Capital expenditures and higher working capital are keeping free cash flows negative (-₹2,693Cr in FY25), underscoring the company’s high-growth, cash-consuming phase.
Strategic Progress & DCF Valuation
Swiggy’s management aims for positive cash flows and margin turnaround, with plans to steadily improve profitability by scaling operations and increasing efficiency. A detailed DCF analysis, based on realistic growth and margin improvement assumptions (cost of equity 11.79%, terminal growth 10%), implies an intrinsic value of around ₹143 per share—indicating the current market cap still prices in optimism about future execution.
Key Takeaways
Swiggy operates in a capital-intensive, competitive market, facing margin pressure but also strong revenue momentum.
Ongoing board and policy reforms reflect the company’s drive for operational maturity.
Long-term success hinges on rapid margin improvement, successful turnaround of Instamart, and conversion of scale into sustainable profits.
Conclusion
Swiggy’s independent outlook shows promise with its robust platform and growth potential, but significant risks remain until losses are narrowed and cash flows turn consistently positive. For investors, Swiggy presents a high-risk, high-reward bet—success will be determined by its pace of execution and ability to transition from investment-driven growth to profitable leadership in India’s booming delivery market.

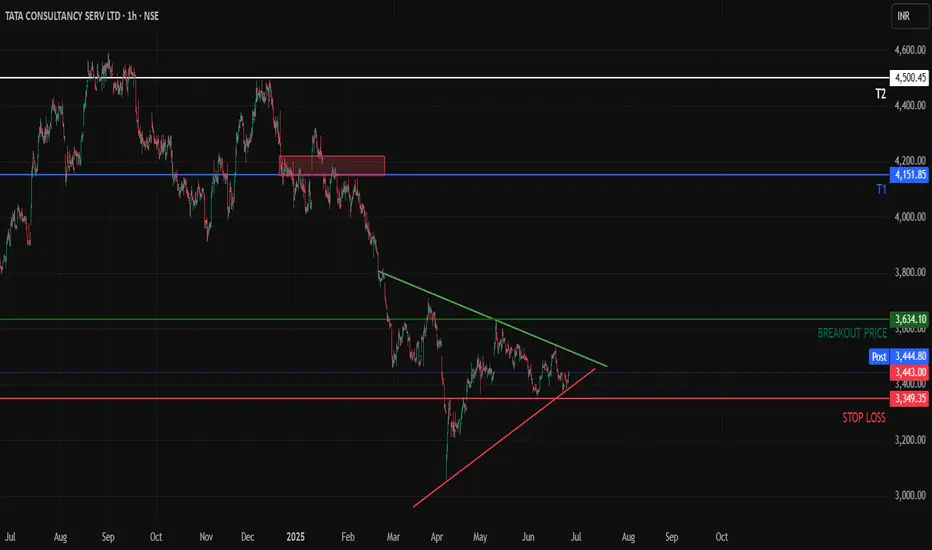
TCS - About to Break out of a consolidation Hello All,
Here is the 1H time frame of TCS which is making a triangle pattern with converging prices at the bottom its recent downtrend.
We can expect T1 once Breakout Price is reached and we get at least a 1H candle closing above the marked breakout price
Once the supply zone near T1 is cleared we can expect prices to hit T2 as well
Above T2, Sky is the Limit for TCS
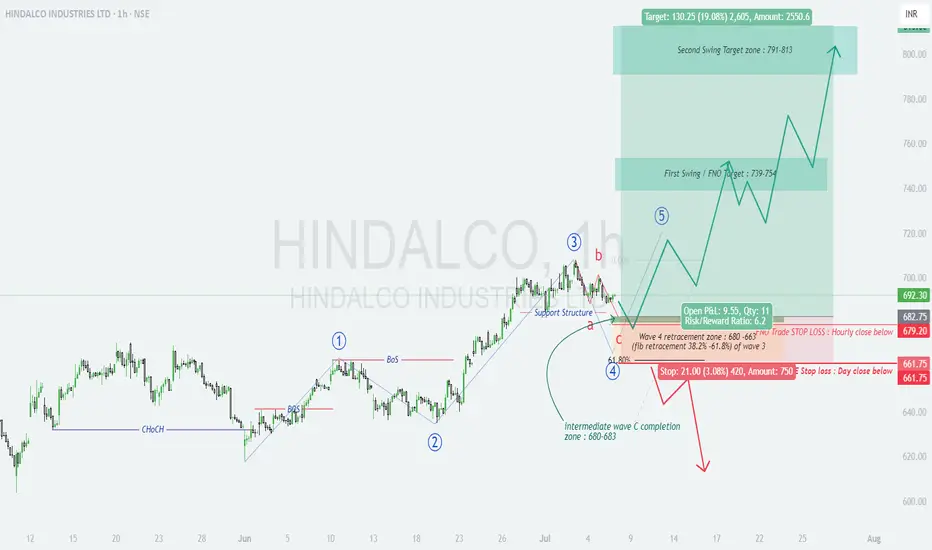
HINDALCO Gearing Up for Wave 5? Entry Zone Locked In for Swing!
📊 HINDALCO – Elliott Wave Analysis (1H Timeframe)
Textbook 5-wave impulse in play – Wave 4 nearing completion
Structurally clean setup with ideal R:R and defined invalidation. High probability long opportunity forming.
🧩 Wave Structure:
Wave 1 to 3 completed; Wave 3 peaked with momentum
Current correction forming a classic ABC zig-zag in Wave 4
Subwaves 'a' and 'b' completed; 'c' approaching ideal completion zone
🔎 Technical Confluence Zone:
Wave 4 Fib Retracement: 38.2–61.8% of Wave 3 → ₹680–663
Support Structure: Aligns with Wave C zone = ₹680–683
Price action showing slowdown → low volatility candles + buyer absorption
Entry zone aligns with high-probability reversal structure
🎯 Upside Targets (Wave 5 Projection):
First Swing Zone: ₹739–754
Second Swing Zone: ₹791–813
🛑 Stop-Loss Zones:
Intraday SL: Hourly close below ₹679.20
Positional SL: Day close below ₹661.75
📈 Reward Potential:
R:R ratio: 6.2+
Structure offers clear risk management and ideal swing setup
A must-watch for swing traders and Elliott Wave learners. Let price react at ₹680–683 zone for confirmation before entry.
#Hindalco #ElliottWave #SwingTrade #WaveAnalysis #TechnicalSetup #NSE
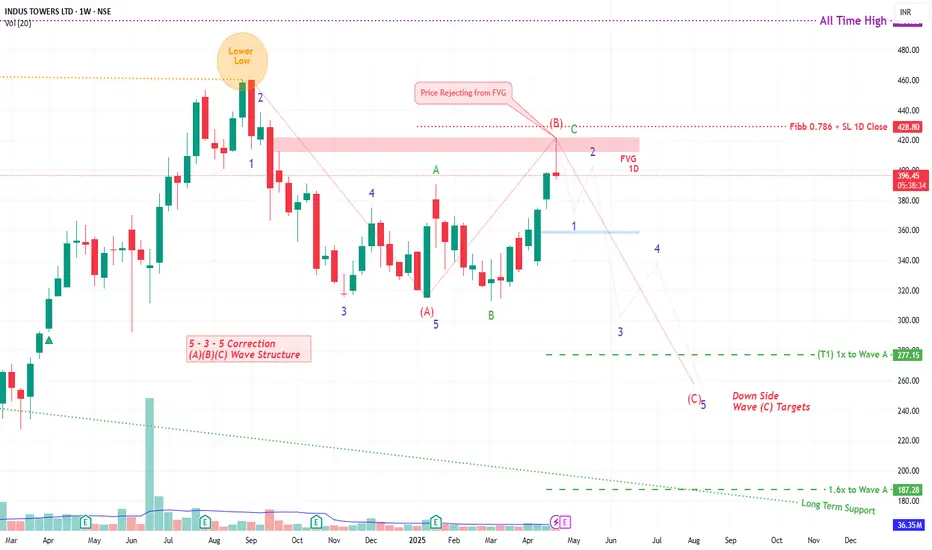
INDUS TOWER By KRS Charts25th April 2025 / 9:40 AM
Why INDUSTOWER??
1. Stock was reached its near ATH level but not able to hold the levels in Sep 2024 . From this point to today it seems like bullishness is getting weaker.
2. Wave Theory is saying Correction Wave ABC is ongoing and C is likely Started .
3. In support of more Correction from here FVG is visible in 1D TF and price are rejected from that level too.
4. Expecting correction from here in 5 Wave Structure towards downside.
Expected Targets and SL are mentioned in Chart
Note: This is Medium to Long Term View
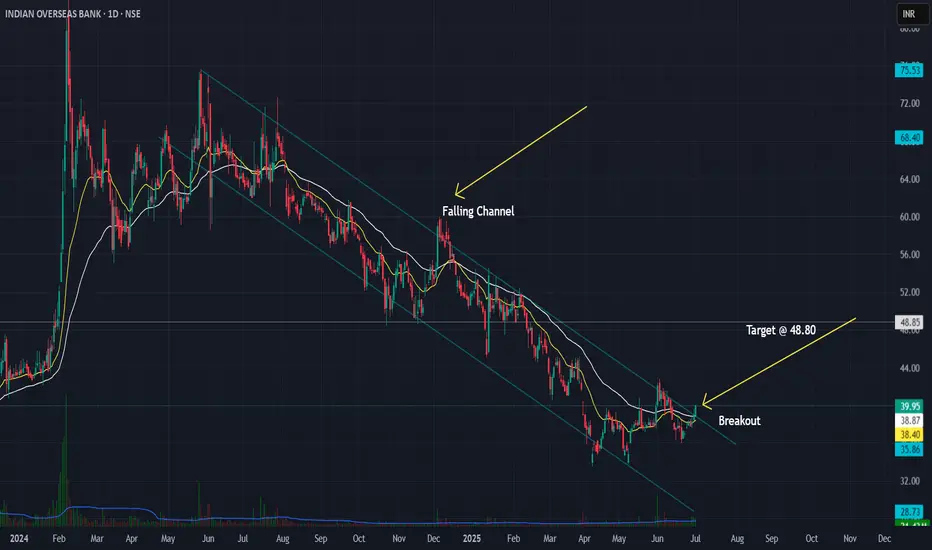
Indian Overseas Bank (IOB) - Falling Channel Breakout Setup📈 Indian Overseas Bank (IOB) – Falling Channel Breakout Setup
Watching a classic falling channel on the daily timeframe with multiple touches on both trendlines. Recent breakout above ~38.8 confirms the channel break.
✅ Planned Trade Details:
- Entry above 38.8 (confirmation)
- Stop-loss: 35.90
- ATR-based stop option: ~37.45 for tighter risk control
- Target zone: 48.80 based on channel height projection
Volume confirmation and follow-through will be key for validating the breakout. Tracking this for a positional swing trade.
Punjab National Bank Flag Breakout Setup📈 Punjab National Bank (PNB) – Flag Breakout Setup
Observed a classic flag pattern on the daily chart after a strong pole move in 2023–24.
✅ Breakout above the channel confirmed with price action near 113.
✅ Entry plan: Watch for daily close >113 with volume.
✅ Stop-loss idea: Below 106.
✅ Target 1: 140 (first swing resistance).
✅ Measured move projection targets up to ~198 possible based on full flag pole.
Volume confirmation and broader market context will guide the actual trade trigger.

ENVIRO INFRA ENGINEERS (NSE: ENVIRO)View: Strongly Bullish.
Bias: Trend reversal confirmed.
Strategy:
BUY: Initiate around ₹240-₹245 or on retest of ₹230-₹235.
Targets (T):
T1: ₹262
T2: ₹287
T3: ₹312
Stop-Loss (SL): ₹220 (on daily closing basis).
Reasoning:
Decisive breakout from a significant long-term descending trendline.
Strong volume confirming the breakout.
RSI indicating robust bullish momentum.
Potential for significant upside as stock recovers from prior fall.
Note: This is an educational analysis and not financial advice. Do your own due diligence before investing.

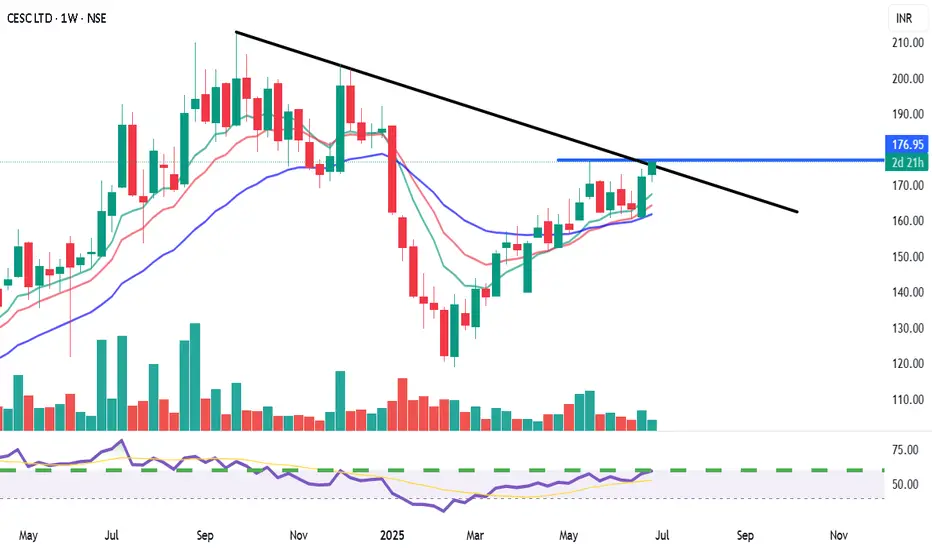
CESC Ltd. (NSE: CESC) - Weekly Chart AnalysisView: Bullish on confirmed breakout.
Bias: Positive momentum.
Strategy:
BUY: Above ₹178-180 (on weekly closing basis, confirming trendline and resistance breakout).
Targets (T):
T1: ₹195-200
T2: ₹210-220+
Stop-Loss (SL): ₹168 (on weekly closing basis).
Reasoning:
Attempting a breakout from a significant descending trendline.
Cleared horizontal resistance at ₹175.
Bullish crossover in moving averages with price above all MAs.
Strong RSI and supportive volume.
Potential for a major trend reversal.
Note: This is an educational analysis and not financial advice. Do your own due diligence before investing.
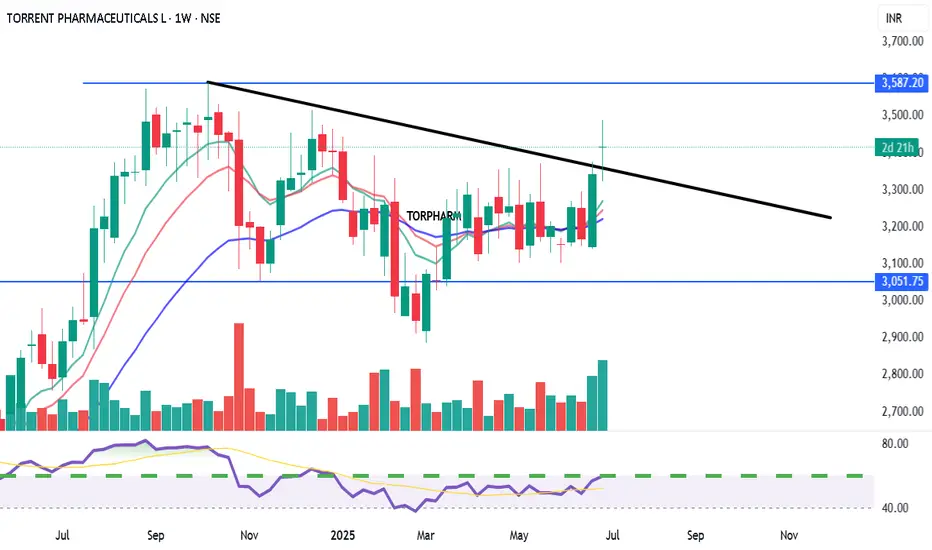
TORRENT PHARMACEUTICALS LTD. (TORPHARM) View: Bullish on confirmed breakout.
Bias: Positive momentum building.
Strategy:
BUY: Above ₹3600 (on weekly closing basis with strong volume confirmation).
Targets (T):
T1: ₹3750
T2: ₹3950+
Stop-Loss (SL): ₹3400 (on weekly closing basis).
Reasoning:
Strong support at ₹3000-₹3050.
Challenging multi-month descending trendline resistance.
Positive RSI divergence and increasing volume.
Potential for a significant trend reversal if breakout is confirmed.
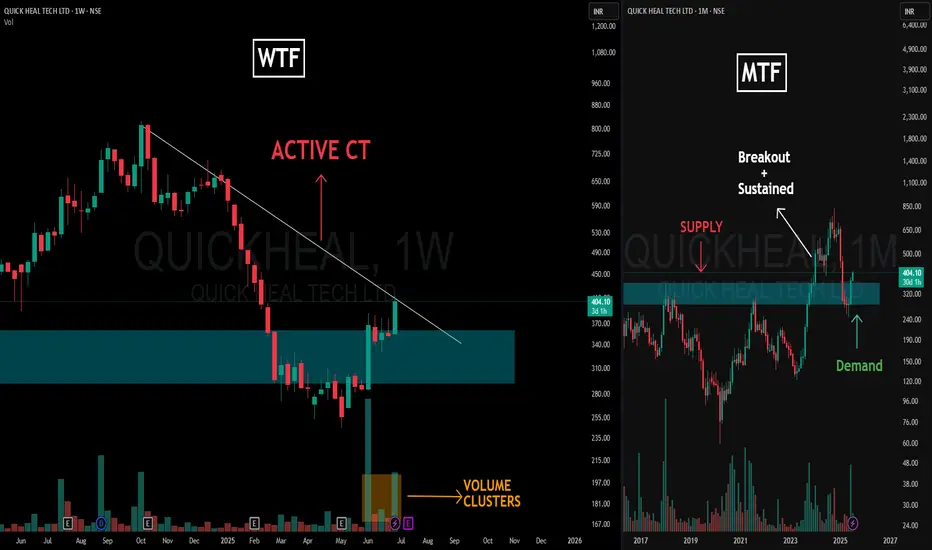
Supply Flips, Trendline Squeezes & Volume Talks – Clean MTFA📌 Charting Breakdown
This post dives into a clean Multi-Timeframe Analysis (MTFA) for QUICKHEAL using structural logic — with Weekly Time Frame (WTF) on the left and Monthly Time Frame (MTF) on the right.
🔍 Left Side – Weekly Time Frame (WTF)
-The Active CT (Counter-Trend) is marked via the dominant trendline resistance, which price is actively engaging.
-We observe a strong Volume Cluster forming near the base of the reclaimed demand zone — often a sign of accumulation or significant interest.
🧠 Right Side – Monthly Time Frame (MTF)
-Here, a textbook Supply & Demand Conversion is visualized.
-Initially, price reacted to a clear Supply Zone, creating the resistance base.
-Once that zone was broken with strength and sustained above it, the previous supply area transformed into Demand, validating the impulse move.
-Price then returned to test this now-converted zone — an SR flip seen through the lens of supply-demand logic, not just support/resistance lines.
🧾 Disclaimer:
This post is not a forecast, tip, or financial advice. It is purely an educational breakdown of price structure and market behavior based on my personal charting style. Feel free to ask your doubts or thoughts in the comments — let’s build clarity, not predictions.
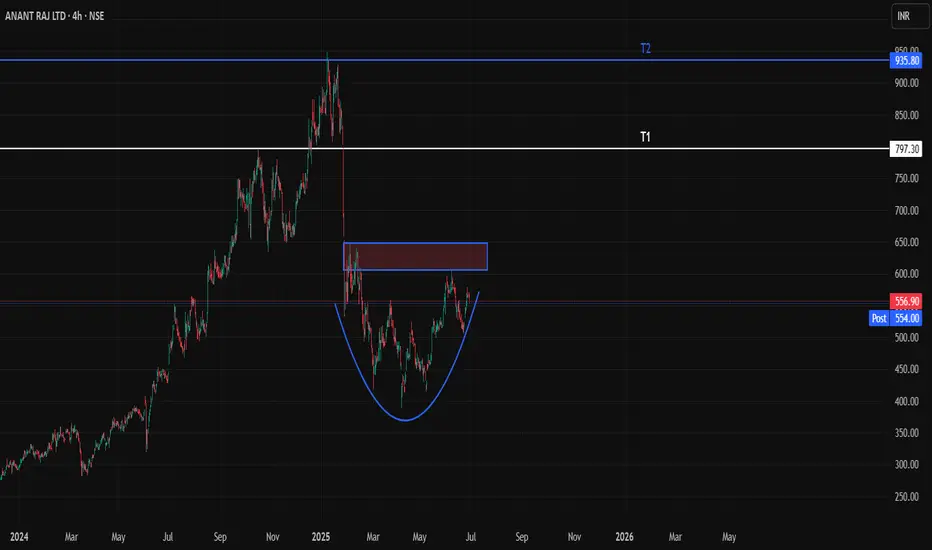
AnantRaj - About to wake up from deep slumber Hello folks! Here is the 4H time frame chart of anantraj which shows a rounding bottom consolidation pattern forming after a steep news driven downtrend. Volumes have nicely picked up in the accumulation phase.
We need to wait for dry volumes now followed by a breakout above the marked supply zone in the chart and we will see T1 and T2 succesfully post breakout!
With the data centre theme gaining back some of the lost traction in the past quarter we can expect a good upside in this counter within the next 2 months itself
ISLAMIC NEW YEAR OR RATHYATRA PICKTechnical View
Stock is clearly formed Cup&Handle pattern. Privious major SR Line break. Pattern made near major SR line. complete reversal formation.
RESPONIND
CMP 219
TARGET 250/275/300+++
BUY ON DIPS NEAR 200-204
SL 190( DAILY CLOSING BASIS)
Fundamental View
ROE and ROE BOTH ARE GOOD. Quaterly and Yearly boh Revenue and PAT are Highest Ever. positive cashflow..
I Am Not SEBI Registered Research Analyst. It Is Giving Only Educational Purpose. Buying in RESPONIND After Discussing With Your Financial Advisor.

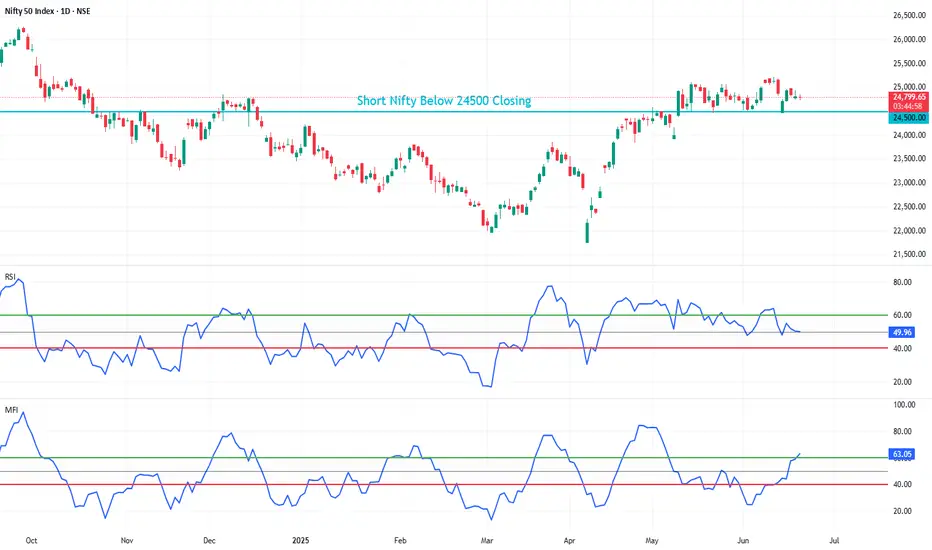
NIFTY (OVERALL MARKET) SETUP FOR SHORTING Please don't look for longs if nifty breaks below 24500, if it is above 24500 then you can see signs of recovery and re-asses your trades but untill then please wait for nifty to fall below 24500₹ levels to short
If nifty breaks then overall markets fall, for better optimization look for stocks now which you think are overvalued now
and then when nifty breaks 24500 then sell or buy PE (any ways you want to) that overvalued stock because that will usually have a larger fall if markets fall.
Please be prepared apart from your daily trading !!
May you all be happy, May you all be profitable :)
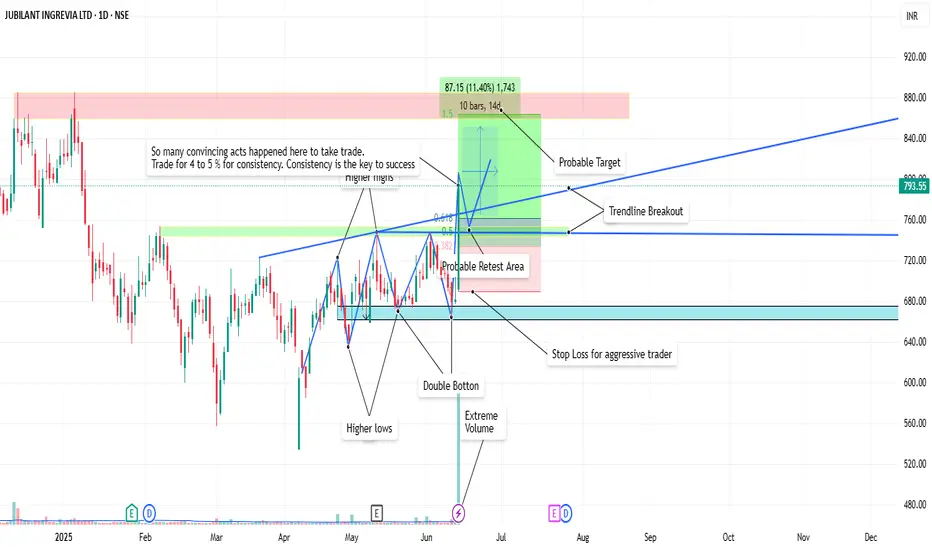
JUBLINGREA Breakout📊 1. Price Action & Pattern Analysis
Breakout Trigger:
Double Bottom at ₹660–₹670 confirmed.
Higher Lows and Higher Highs are clearly visible — a bullish trend structure.
Breakout from trendline resistance with a strong bullish candle on extreme volume confirms buyer interest.
Probable Retest Zone: Around ₹745–₹760, which overlaps with the 38.2–61.8% Fibonacci zone, indicating a good low-risk reentry area if price retests.
Stop-Loss (Aggressive): Just below ₹680 support zone (prior bottom and neckline).
🔍 2. Volume & Confirmation
Massive Volume Spike on breakout day — highest in recent months.
Volume confirms genuine buying pressure, validating the pattern breakout.
🧭 3. Stage Classification
✅ Current Stage: Stage 2 – Markup Phase (Early Stage)
Why:
Breakout from long consolidation.
Volume confirms institutional activity.
Trend structure shifting to higher highs/lows.
Strong retest and breakout of previous resistance zones.
🎯 4. Trade Plan Summary
Metric Value
📌 Entry Range ₹760–₹780 (retest possible)
🧯 Stop Loss (Aggressive) ₹675–₹680 zone
📈 Target 1 (Short-Term) ₹840–₹860 (as shown)
📈 Target 2 (Positional) ₹900+
🔎 Risk–Reward 1:2.5+ (Ideal Swing Setup)
🧠 “So many convincing acts happened here to take trade... Trade for 4 to 5% for consistency.”
✅ Conclusion
This is a classic Stage 2 early breakout with:
Multi-confirmation setup (pattern + trendline + volume)
Well-defined risk-reward
Excellent for swing-to-positional trades