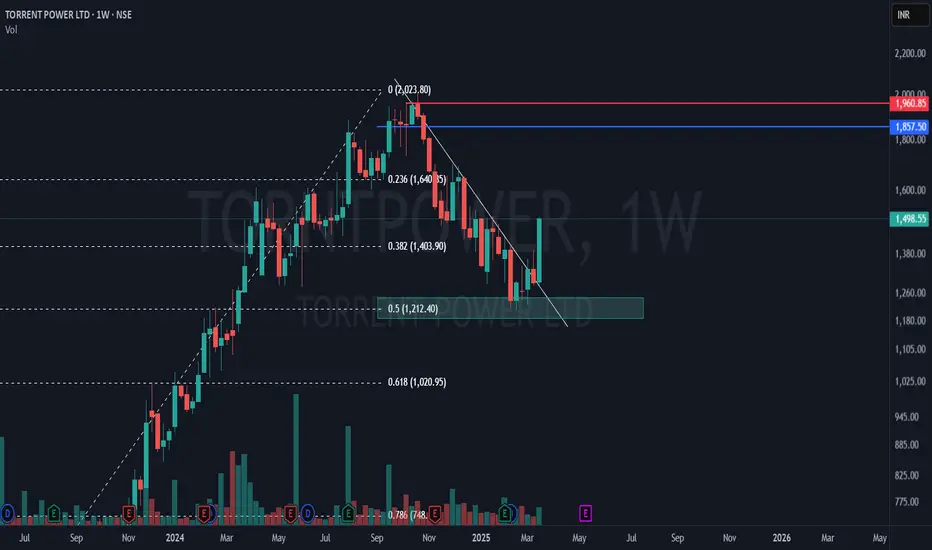
Torrent Power – 50% Fibonacci Retest & Breakout Play!📊 Technical Breakdown:
🔹 50% Fibonacci Retracement at ₹1,212 – a crucial support where buyers stepped in!
🔹 Falling trendline breakout with a massive +16.06% green candle – trend reversal confirmation?
🔹 Volume surge suggests strong buying interest but relatively still lower than as it used to be in this stock year ago
🔹 Blue and Red lines are nearest supply zone created by a weekly and monthly time frame
Nse
L&T Finance Weekly Breakout Setup 🔹 Green Line – The weekly support held strong, giving a perfect WTF (Where's The Floor) bounce.
🔹 Supply Zone (Blue Box) – This crucial resistance has now been broken out convincingly.
🔹 Red Line – A CT (Counter-Trendline) breakout with solid volume confirmation.
🔹 Bright Blue Line (MTF Resistance @ 185.82) – The toughest resistance, but it's far from the breakout zone, making this a high-RR trade idea.
🔥 Unique setup with multiple confluences! Volume spike adds conviction. Can bulls sustain the momentum? 🤔
📈 What’s your take on this breakout? Comment below! 👇

Godrej Agrovet – Breaking Out After 245 Days of Consolidation!📊 Stock: GODREJ AGROVET LTD (NSE) – 1W Chart
📈 Breakout Alert!
The stock has been consolidating for 245 days and is now breaking out with strong momentum!
Hidden trendlines (yellow) indicate potential future price movement zones.
Red trendline (CT) – Key resistance trendline that has been broken.
Green trendline – Strong support area that held firm.
Blue line marks the nearest all-time high based on multi-timeframe closing levels.
With strong market participation and volume, this breakout looks promising! 📊🚀
💬 What are your thoughts on this breakout? Are you tracking this stock? Comment below! ⬇️

Bharat Rasayan | 2200-Day Uptrend Holding Strong, Ct breakoutThe green trendline represents a massive 2200-day uptrend, acting as a strong support level.
A counter-trendline breakout (182 days long) has just occurred, breaking the red resistance line with momentum.
The yellow zone has been respected three times over 1170 days, indicating a strong supply zone—a breakout above this can trigger a major move.
Recent base formation followed by a breakout adds to the bullish structure.
Volume remains low, likely due to the stock trading in 5-digit territory.
Watchlist Ready? Let’s Ride the Trend!

SRF - Beginning of a new trend?After a parabolic move from 2019-2021, price has been in a well-defined consolidation. Price chart formed a 4 year-long rectangle with the horizontal boundary acting as strong resistance at 2700 levels. The horizontal upper and lower boundaries were tested multiple times over the course of the pattern. This week's close above 2700 levels after a pullback to the upper boundary confirmed the breakout from the 4 year-long rectangle and can be expected to offer directional movement.

JINDAL SAW By KRS Charts5th March 2025 / 9:40 AM
Why JINDALSAW??
1. Fundamentals Strong, Technically Bullish Stock .
2. Wave Count is showing 4th Wave might finish with Flag patterns low in JAN 2025.
3. Multiple FVG is marked as we can see in Chart,
Upside Red Zone FVGs are already mitigated partially in case of upside further
targets will full mitigations of those zone. (Red Zones)
Another FVG is visible in Hourly TFs which denotes possible Reversal from current level.
(Blue Zone)
4. Morning Star is also loading if Today Closing near 245 Rs.
5. 2 Possible Ways I am expecting which marked with Dotted Arrows.
6. RSI - Above 40
MACD - Positive Crossover
Initially Target 280 Rs.

Nifty Long Term ChannelNifty has been in this channel since 1990 & we see a throw over in 2008 when extreme bullishness takes it past the channel top to only see a deep correction.
We are near to channel top again but do we have extreme sentiment on bullish side ?
No rather we have a extreme bearish sentiment so can we see a throw over again in this channel for this bull cycle started from Covid lows of March 2020.
Lets dig some numbers March 2020 Low was 7511
Oct 2021 High was 18604
Net Rise 11093 Points
June 2021 Low was 15183
Add 11093
Sept 2024 High 26277
Now we did to 2 equal rise of 11093 points 1st in 19 Months & second in 27 Months what if the low of 22786 is a major low given the extreme negative sentiment at we are adding another 11093 points from here in next 19 months.
Are we heading to 33900 by Oct 2026 ?
If Nifty closes above 25000 than second hurdle will be ATH at 26277 than we would see fast & furious bull run which could be last leg of this euphoria which gives a throw over on this long term Channel.
DISC : View shared here are for Educational purpose only i am not a SEBI registered analyst please consult your Financial advisor before taking any trades.

IEX continuing downtrendIEX has posted before Daily Timeframe view, now detailed technical view in 1Hr, price has started down move in minutte wave3 of minor Wave C which will last for a year.

Road Map for A New TraderRoadmap to being a successful trader
Step 1: Decide on your trading pattern. ...
Step 2: Select the most appropriate stock trading broker for You. ...
Step 3: Choose the best stocks for your investment. ...
Step 4: Determine your risk tolerance. ...
Step 5: Learn to be patient.
The forex market is often considered an ideal market for learning technical analysis due to several factors: Diverse market conditions: Forex trading offers a wide range of currency pairs and diverse market conditions, providing ample opportunities to practice technical analysis skills.

2 Stocks Price action for 30 Jan 2025 I daily make educational content videos for swing / positional trading

Amazing swing trading stocks for 29 Jan 2025I daily make educational content videos for swing / positional trading

SRF Chart Signals Big Breakout OpportunityThe chart shows a weekly timeframe analysis of SRF Ltd (NSE) with a focus on a potential breakout. Here’s a breakdown of the analysis:
Pattern Identification
1. Symmetrical Triangle Pattern:
• The chart highlights a symmetrical triangle, where the price has been consolidating within converging trendlines.
• This pattern generally indicates a continuation or reversal, depending on the breakout direction.
2. Fair Value Gap (FVG):
• There is a Fair Value Gap (FVG) marked, which represents an imbalance in price action. It could act as a liquidity zone for price retracement.
3. Order Block (OB):
• An order block is highlighted, which is a strong demand zone. This suggests that buyers could step in, pushing prices higher.
Future Outlook
1. Bullish Breakout Expected:
• The arrows and target zones indicate that a bullish breakout from the triangle is anticipated.
• The projected upside move is around 665 points (25%-30%), aiming for targets near ₹3,300-₹3,400.
2. Potential Retest:
• A retest of the breakout level or a pullback into the order block (around ₹2,400-₹2,500) could occur before continuing upward momentum.
3. Secondary Triangle:
• Another smaller triangle formation is shown for the medium-term outlook, suggesting a consolidation phase before further movement.
Key Levels
• Support Zones: ₹2,357 (stop-loss region) and ₹2,486 (demand zone).
• Immediate Resistance: ₹2,606 (current breakout level).
• Target Zones: ₹2,791 and ₹3,300+ in the medium to long term.
This chart suggests a positive outlook for SRF Ltd, with a focus on confirming a breakout and maintaining the marked support levels.
DISCLAIMER- PLEASE DO YOUR OWN RESEARCH BEFORE INVESTING . THIS IS FOR EDUCATIONAL PURPOSES ONLY

Nifty: Breakdown Structure in PlayNifty has entered a breakdown structure around 23,460. Sustaining below this level could lead to a test of the 22,700 zone.
Bulls may regain strength only if Nifty reclaims the 23,500 area. Watch these levels closely for the next move.
Disclaimer :
This analysis is for informational purposes only and not financial advice. Conduct your own research or consult a financial advisor before making trading or investment decisions.


Metal Index: Ascending Triangle Broken, Testing Support LevelsDescription :
The CNS Metal Index recently broke below the 5th pivot of an ascending triangle pattern. This signals a potential bearish shift in momentum. The next key level to watch is the support zone around 8100. If this level is tested and broken, it could indicate further downside potential.
Traders should watch for confirmation signals, such as increasing volume on the breakdown or a sustained close below 8100, before making decisions. Conversely, if the index rebounds above the broken triangle line, it might invalidate the bearish scenario and suggest a consolidation phase.
Disclaimer :
This analysis is for informational purposes only and does not constitute financial advice. Always conduct your own research and consult with a professional financial advisor before making any trading or investment decisions. Trading involves significant risk and may result in substantial losses.

Technical Analysis of Gopal Snacks Ltd....TRADE FOR LATERINVEST BEFORE READ CAREFULLY / TAKE TRADE ON YOUR OWN RISK
RISK~REWARD PROFILE = 5.91:1
NSE:GOPAL SANEKS Technical chart Observations:-
~Price Correction:-
The stock corrected around 29%, possibly due to the negative news (fire in a warehouse).
The price appears to be approaching a strong psychological support level at ₹335.
~Pattern Formation:-
A potential Head and Shoulders pattern is visible, signaling a bearish reversal that already played out.
The price dropped significantly post-pattern completion.
~Support Level:-
Key support is around ₹322.80, which is highlighted as the entry point for a possible bounce.
Stop-loss (SL) is marked at ₹304.50 to limit downside risk.
~Target Levels (TP):-
~TP1: ₹362.30
~TP2: ₹386.35
~TP3: ₹430.95
~Volume:-
The trading volume on the recent downtrend is moderate, indicating cautious selling.
~Trend:-
Currently in a downtrend but nearing a critical psychological support zone.
Trading Strategy:
Wait for Confirmation: Enter the trade only if the price shows a clear bounce or reversal signs at the ₹322.80 level.
~Risk-Reward:-
Stop-loss: ₹304.50 (downside ~₹18.30 per share).
Target 1 (TP1): ₹362.30 (upside ~₹39.50).
Risk-reward ratio is favorable if TP1 is achieved.
~Notes:-
This is a counter-trend trade (going against the dominant downtrend), so caution is advised.
Monitor closely for any trend continuation or reversal indicators (e.g., candlestick patterns or volume spikes).
The highlighted targets (TP1-TP3) should be treated as milestones—book partial profits at each.
Final Note:
This chart suggests a well-structured trade setup, but execution depends on confirmation of price action near the support zone. Traders should monitor market sentiment, news updates, and technical signals before entering the trade.
Disclaimer:
I am not a SEBI-registered advisor. These levels are for educational purposes only. Please trade at your own risk. Consult a professional financial advisor for tailored advice. Like and share if you found this helpful!
LIKE,SHARE,SUBSCRIBE @Alpha_strike_trader

SIEMENS BEARISH TREND ANALYSIS (SHORT)NSE:SIEMENS
SIEMENS BEARISH TREND ANALYSIS
Key Levels:
Entry Point: ₹6,559.45
Stop Loss (SL): ₹6,732.85
Target Points:
TP1: ₹6,339.95
TP2: ₹6,143.60
TP3: ₹5,747.50
Analysis:~
Trend Overview:
Siemens is showing a bearish trend, confirmed by the price breaking an 8-month support level. The chart highlights potential downside targets with a disciplined stop-loss placement.
Support and Resistance:
The price has failed to sustain above the long-term support level, which has now turned into resistance.
The trend suggests potential further decline toward the specified targets.
Risk Management:~
Stop Loss at ₹6,732.85 ensures risk is minimized if the trade goes against the trend.
Target levels are spaced for progressive profit booking.
Chart Insights:~
Bearish Confirmation:
Siemens has turned bearish, breaking below its 8-month support zone, signaling potential further downside movement.
Resistance:~
The previous support level now acts as resistance.
A stop loss is placed slightly above this level to mitigate risk in case of trend reversal.
Profit Targets:~
TP1 and TP2 offer conservative profit levels, while TP3 provides a more aggressive downside target.
Trend Direction:
The 50-day and 200-day moving averages are sloping downwards, indicating sustained bearish momentum.
Disclaimer:
I am not a SEBI-registered advisor. This analysis is for educational purposes only. Trade at your own risk. Please consult a professional financial advisor before making trading or investment decisions. Thank you! Like and share if you found this helpful.
Like,share,subscribe @Alpha_strike_trader

Nifty 50 Analysis: Key Levels and Trends for January 2025The Nifty 50 Index has experienced notable downward momentum recently, currently trading at 23,581, marking a 1.77% decline. Here’s a breakdown of the technical outlook:
Channel Trends
Descending Channel: The index is trading within a downward sloping channel (blue). It has respected both the upper and lower trendlines, suggesting the bearish trend remains intact for now.
Broader Structure: The yellow trendlines highlight the long-term rising channel. Nifty remains well above the lower support of this broader channel, indicating a potential cushion if the selloff deepens.
Key Fibonacci Levels
The Fibonacci retracement and extensions indicate critical zones:
1.618 Level: 23,112, acting as immediate support.
3.618 Extension: 22,444, a deeper bearish target in case of further selloff.
Support and Resistance
Immediate Resistance:
24,791 (upper channel boundary).
Critical Supports:
23,112 (1.618 extension).
22,444 (long-term support).
Volume Analysis
Significant volume spikes are observed during major selloffs, suggesting heightened institutional activity. A continuation of higher volume at lower prices may signal capitulation or accumulation.
Outlook
Bearish Continuation: As long as Nifty trades within the descending channel, expect further downside with supports at 23,112 and 22,444.
Bullish Recovery: A breakout above 24,791 may signal a reversal, leading to potential upside targets near 26,000.

Chart Analysis for Bajaj Finserv Ltd. (Weekly Timeframe)The stock is forming a bullish triangle pattern, a classic continuation pattern signaling potential upside. The price is respecting the ascending trendline, showing strong support near ₹1,700 levels, while the upper resistance line has been tested multiple times. This signifies increasing buyer strength.
Key Levels to Watch:
• Support: ₹1,698
• Resistance (Breakout Level): ₹2,050
• Target Price (Post Breakout): ₹2,336 (derived from the triangle’s height projection).
• Stop Loss: ₹1,515 (below the trendline support).
Short-Term Long Trade Setup
• Entry: Around ₹1,700, once the price shows bullish confirmation (e.g., reversal candlestick patterns or high volume).
• Target: ₹2,050 (short-term) and ₹2,336 (medium-term).
• Stop Loss: ₹1,515 to manage risk effectively.
Market Sentiment:
The stock shows a bullish structure, supported by prior consolidation and breakout potential. Patience is key for confirming a breakout above ₹2,050 before expecting the measured move towards ₹2,336.
DISCLAIMER- Please do your own research before investing in the market. This is for educational purposes only

Lupin Breakout: A New Highs Journey Begins!Hello everyone, i hope you all will be doing good in your life and your trading as well. Today i have a Lupin stock which has caught the market's attention with a powerful breakout from its resistance zone. Backed by increasing volume and bullish momentum, this pharmaceutical giant is showing signs of a potential rally. Let's dive into the chart to explore the opportunities.
1. Chart Overview
The chart appears to be for LUPIN LTD on a daily timeframe (1D).
The key focus is on price action with clearly defined support and resistance zones.
Indicators used include the RSI (Relative Strength Index) at the bottom of the chart.
The price is currently trading at ₹2,311.35, up by +3.75% for the day.
2. Key Levels Highlighted
Support Zone (Grey Band)
The support zone is marked around the ₹2,000–₹2,100 level, acting as a base where buyers consistently step in.
The price bounced off this zone multiple times, confirming its strength.
Resistance Zone (Grey Band)
The resistance zone is marked around ₹2,300–₹2,350, where sellers have historically prevented price from moving higher.
The recent breakout indicates strong bullish momentum.
Stop Loss (₹2,222)
A stop loss is suggested at ₹2,222, slightly below the resistance zone.
This is to manage risk in case the breakout fails and the price reverses.
Targets
1st Target: ₹2,490 : This is a realistic level based on previous price action and the measured move.
2nd Target: ₹2,678: This is a more optimistic target if the price continues its uptrend.
3. Price Action
Breakout: The price has broken above the resistance zone with strong bullish momentum, as seen by the large green candle and increased volume. This breakout suggests a potential continuation of the uptrend.
4. Volume Analysis
Volume Surge: There is a noticeable increase in volume during the breakout, indicating strong buying interest. Volume confirmation is a good sign that the breakout is genuine.
5. RSI Analysis
Current RSI: 71.94
The RSI is above 70, indicating an overbought condition. While this signals strong momentum, it may also suggest caution as a short-term pullback is possible.
Previous Bearish Divergences: Marked in red, showing past instances where the RSI was high but price reversed.
Bullish Confirmation: Marked in green, showing that RSI and price are aligned with the current uptrend.
6. What Does This Mean?
The breakout above resistance indicates a potential shift in market sentiment, favoring buyers.
The targets suggest significant upside potential, but the RSI warns of possible short-term profit booking.
7. Possible Outcomes
Bullish Scenario:
If the price holds above the resistance zone and sustains higher levels, it could move towards the 1st and 2nd targets.
Bearish Scenario:
If the price closes below ₹2,222 (stop loss), it may revisit the support zone around ₹2,000–₹2,100.
8. Suggested Actions
Entry: On sustained breakout above ₹2,311 (current level).
Stop Loss: Strictly at ₹2,222 to minimize losses.
Profit Booking: Gradual booking at ₹2,490 and ₹2,678.
Lupin has broken out of its resistance zone with strong momentum, signaling a potential uptrend. With solid fundamentals and technical confirmation, the stock looks poised for higher levels. Keep an eye on the targets and manage your risk with the defined stop-loss. Happy Trading!
Disclaimer:- Please always do your own analysis or consult with your financial advisor before taking any kind of trades.
Dear traders, If you like my work then do not forget to hit like and follow me, and guy's let me know what do you think about this idea in comment box, i would be love to reply all of you guy's.
Thankyou.

Aurobindo Pharma: Breakout with a Long Opportunity?Aurobindo Pharma is showing signs of a trend reversal on the daily chart. The stock has broken above a descending trendline, supported by strong volumes, signaling a potential bullish move.
Key Levels to Watch:
Support: ₹1,253
Resistance: ₹1,346 and ₹1,407
Long Opportunity:
If the stock sustains above ₹1,300, it offers a good long opportunity with a target of ₹1,407 in the short term. A close above ₹1,407 could open doors to further upside. Traders can consider ₹1,253 as a stop-loss for a risk-managed entry.
A decisive move above ₹1,346 will confirm bullish momentum, making this a promising setup for long-term gains.

3 Amazing swing trading idea for 26 December MarketsI daily make educational content videos for swing / positional trading
Gulf oil trade idea: This idea is about a breakout trade that went sideways at the breakout point and is currently in a no-trading zone, pink zones tell you about what to do next
Axiscades trade idea: This idea is about the weekly time frame breakout, its at a strong resistance area of a hidden parallel channel, needs a strong closing for the same
Indigo trade idea: This idea is also a breakout idea on Daily time frame but needs to follow a set of market structure from here on and price action to give a nice trade activation

Aurobindo Pharma - Long Trade SetupHello, Auropharma near the resistance level of 1275 . You can enter long when price is crossed above 1275.
*Confirmation of Trend Strength: A breakout above resistance indicates strong upward momentum and confirms the existing uptrend. This increases the likelihood of further price appreciation.
* Reduced Risk: Trading with the trend minimizes the risk of opposing a large number of market participants who are also betting on the continuation of the uptrend.
* Momentum: Breakouts often trigger a surge in buying pressure as traders rush to capitalize on the upward move, further propelling prices higher.
* Clear Entry Signal: The breakout provides a well-defined entry point, allowing traders to enter the market with precision and confidence.
