JINDALSTEEL | Flag continuationStrong prior impulse, orderly flag structure
-RSI >50, EMAs rising, OBV confirms accumulation
-Sector tailwind: strength in metals
Trade plan:
-Buy > 1100 (volume confirmation required)
-SL: 1030
-Positional target: 1770
-R:R ≈ 1:11
Nseindia

Decoding Weekly Structure: Support, Resistance & Channel DynamicSummary -
This multi-window TradingView chart showcases a weekly time frame on the left, featuring a white counter line, a dotted hidden resistance line, and a monthly support/resistance zone highlighted in white on the right. Additionally, a pink parallel channel marks head and resistance zones, offering a visual guide to price structure without forecasting future movement. Each element helps identify historical areas where price has shown significant reactions.
Terms and Language explained -
Counter Line (White): A horizontal line used to mark a specific price level, often for tracking key reference points or psychological levels.
Hidden Resistance (Dotted Line): A resistance line that is not immediately obvious but is derived from less visible price action or volume analysis. It helps identify potential areas where price may struggle to move higher.
Monthly Support/Resistance Zone: A broader area on the chart where price has historically found support (demand) or resistance (supply) over the monthly time frame. These zones are often marked for their significance in longer-term analysis
Parallel Channel: A set of parallel lines drawn to connect consecutive highs and lows, forming a channel that helps visualize the current price trend and boundaries.
Disclaimer
The information presented in this chart is for educational purposes only. No part of this post constitutes financial advice, a recommendation, or a forecast of future price movement. Always conduct your own research and consult a qualified financial advisor before making any trading decisions.

How to Add and Select Weekly time frame stocks on Trading view I make educational content videos for swing / positional trading

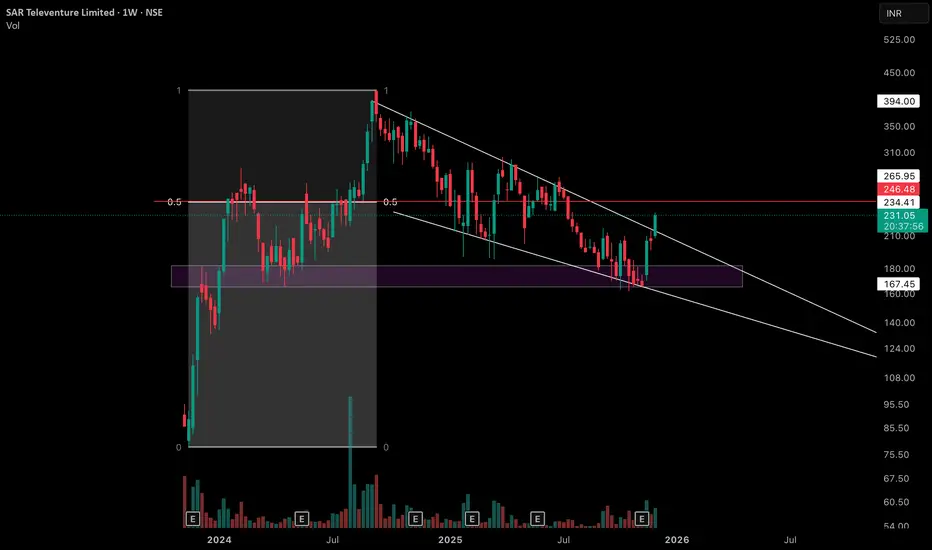
Weekly Equilibrium at Former Supply Zone with 4 observationsObservation 1 - On this weekly chart of SAR Televenture Limited, price has created an interesting equilibrium between the major swing low and the all‑time high swing high, with the 0.5 level highlighted by the red horizontal line as a key mid‑point reference.
Observation 2 - The purple zone marked on the chart was earlier a clear supply / resistance area but has now flipped into a support zone, getting respected multiple times over the past several weeks.
Observation 3 - After printing its all‑time high, price has moved into a sequence of lower highs and lower lows, but each leg has remained relatively controlled instead of showing any one‑sided, sharp liquidation move. This creates a broader consolidation structure where volatility is present yet contained.
Observation 4 - The white lines on the chart represent the upper and lower rejection boundaries of this consolidation channel, and most of the recent candles are developing within these two lines.
Disclaimer: This post is purely for educational and informational purposes, intended to study price structure and market behavior on the weekly timeframe. It is not investment advice or a recommendation to buy or sell any security; traders and investors should do their own research and consult a registered financial professional before making any decisions.
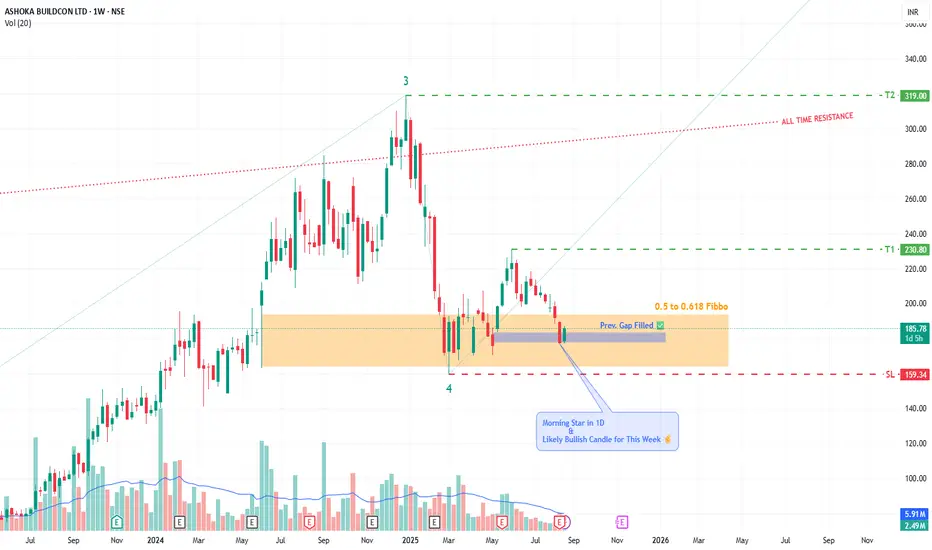
VIEW ON ASHOKA BUILDCON BY KRS CHARTSDate - 21st August 2025 / 10:35 AM
Why ASHOKA ?
1. All-time Bullish Stock technically making HHs & HLs.
2. Further, Price is already in Fibbo Golden Reversal Zone for quite a few times and showing bullish traits again.
3. I was eagerly waiting for to retrace down little bit for 1D previous gap-up needed to be filled it & it's Done!
4. 1D it is showing Morning Star Candle sticks Cluster s with more green Candles and this week likely to be closing with bullish candle stick.
5. Wave Theory wise we are in 4th Wave last upside 5th is loading.
All in All, this is good level to look ASHOKA as a good opportunity 👍✅
Targets and SL are Marked in Chart.
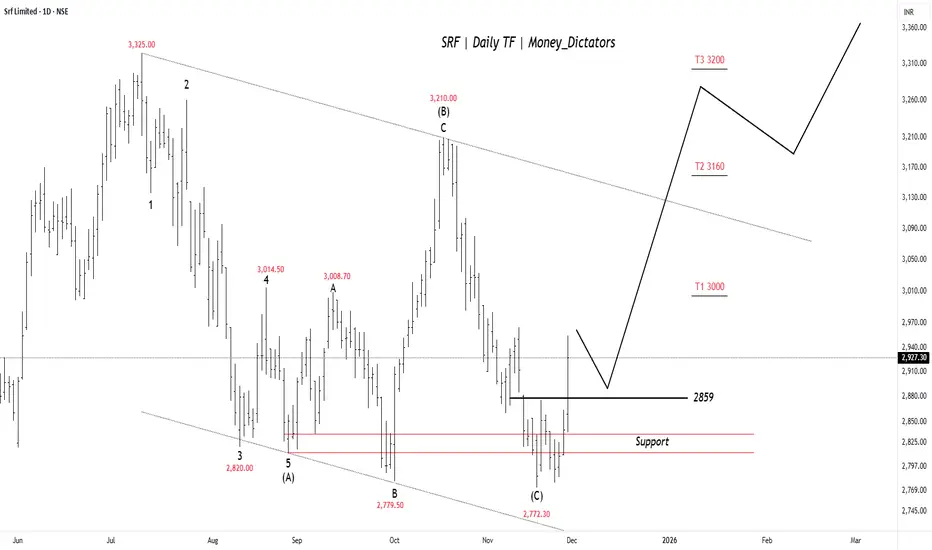
SRF on the Edge of a Sharp BreakoutSRF seems to have finished its ABC correction near the 2770–2800 support zone, and the price has bounced back above 2859 , which now acts as a short-term trigger. If the stock stays above this level, it can move toward 3000 first, then 3160 , and possibly 3200 . The chart shows buyers gradually taking control again after the correction, but the outlook stays positive only as long as price holds above the support region.
Stay Tuned!
@Money_Dictators
HDFC BANK LTD PARALLEL CHANNEL BREAKOUTHDFC BANK was traded in channel from past few years and made a breakout with good volume. Entry price at ₹990, with a STOPLOSS ₹940 and TARGET ₹1,190

How to approach any Trade like a PROI make educational content videos for swing / positional trading
Charts used in this video are 3 months older for experience sharing using Bar replay feature of Trading view .

Unlocking Chart Vision: Why One Breakout Isn’t EnoughRetail traders often gravitate towards the familiar—you’ll notice on the right chart, a classic breakout above the counter trendline (CT) is the “go-to” setup most focus on. This approach is common, but it can signal limited experience or a lack of exposure to complex, multi-pattern scenarios.
As a full-time trader, my scanning process involves viewing charts through a multi-pattern lens, not just relying on a single breakout narrative. On the left chart, you’ll spot another prominent CT in red—this additional hurdle isn’t always visible to less experienced eyes. Notably, a hidden parallel channel (orange) adds further nuance, underscoring the importance of assessing every structure before deciding on bias or trade management.
This post is purely observational—there’s no forecasting or trade advice here. The goal is to highlight why expanding your pattern recognition toolkit and investing more screen time can reveal deeper price action dynamics often missed in simplistic approaches. If you want to bring your technical analysis to a professional level, start looking for what’s not immediately obvious!

IDBI Bank and the Bullish Cup & Handle Pattern📈 Technical Analysis Spotlight: IDBI Bank and the Bullish Cup & Handle Pattern
In the world of technical analysis, chart patterns often serve as powerful indicators of potential price movements. One such pattern, the Cup and Handle, has recently emerged on the daily chart of IDBI Bank Limited, offering traders and investors a compelling bullish setup.
🏦 Current Market Snapshot
As of the latest data, IDBI Bank is trading at ₹100.42. This price action is notable not just for its level, but for the structure it has formed—a classic Cup and Handle pattern, which is widely regarded as a bullish continuation signal.
☕ Understanding the Cup and Handle Pattern
The Cup and Handle pattern resembles the shape of a tea cup:
The "cup" forms after a rounded bottom, indicating a period of consolidation and accumulation.
The "handle" follows as a short-term pullback, typically on lighter volume, before a potential breakout.
This pattern reflects a shift in market sentiment—from bearish to bullish—as buyers gradually regain control.
📊 Technical Confirmation
Several factors strengthen the bullish outlook for IDBI Bank:
The stock is trading above its 50-day and 100-day Simple Moving Averages (SMA), suggesting medium-term strength and trend alignment.
The neckline resistance—the key breakout level—is identified at ₹106. A decisive move above this level would confirm the completion of the Cup and Handle pattern.
🚀 What Happens After the Breakout?
If IDBI Bank breaks above ₹106 with strong volume, it could trigger a bullish rally, as the pattern implies renewed buying interest and momentum. Traders often look for price targets by measuring the depth of the cup and projecting it upward from the breakout point.
🧠 Final Thoughts
The Cup and Handle pattern on IDBI Bank’s chart, combined with its position above key moving averages, presents a textbook bullish setup. While no pattern guarantees future performance, this formation is a favorite among technical analysts for its reliability and clarity.
As always, traders should consider risk management and broader market conditions before acting on any signal.

VCP Formation within Symmetrical Triangle above 200 EMAThis chart displays a Volatility Contraction Pattern (VCP) developing within a classic symmetrical triangle on the daily timeframe. Two sharply converging trendlines encapsulate the price action with the lower line connecting a series of higher lows (the trendline) and the upper line linking lower highs (counter trendline). Such convergence is characteristic of symmetrical triangles, which represent a period of price consolidation and equilibrium between buyers and sellers.
Volume tends to contract as the pattern matures, signaling market indecision and reduced volatility. Notably, this consolidation is taking place right around the 200-day moving average, which serves as an important reference point for longer-term market participants. The convergence of price and volume patterns here aligns with textbook VCP behaviour and highlights the potential for significant crowd psychology shifts.
This post’s intent is observational and educational, focusing on the visual behavior of price and volume embedded within technical patterns. Studying such symmetries can strengthen understanding of market structure and technical analysis skills, allowing for systematic review rather than speculative outlooks or trade signals.
HUDCO - Keep in Radar!Pattern: Continuation Diamond (Bullish)
The stock has been consolidating in a long pattern after an extended uptrend.
This setup signals long-term upside momentum — suitable for investors or position traders rather than short-term trades.
This analysis is for educational and informational purposes only and should not be considered investment advice. Market investments are subject to risks. Please consult your financial advisor before making any investment decisions.

Supply-Demand Squeeze: Symmetrical Triangle at the Flip zoneWitness a textbook supply-demand play on the monthly chart of Bharat Wire Ropes Ltd. as price contracts above a major zone conversion! The chart highlights a high-probability symmetrical triangle pattern—marked with a red counter trendline (lower highs) and a green trendline (higher lows).
This powerful squeeze forms right at the intersection of key supply and demand zones.
- Both supply (resistance) and demand (support) have been mapped for clear zone analysis.
- The symmetrical triangle shows classic price contraction
- Red line: Counter trendline connecting lower highs.
- Green line: Trendline connecting higher lows.
Disclaimer:
This Observation / Post is for educational purposes only and does not constitute investment advice. Please do your own research and consult with a financial advisor before making any trading decisions.

Bharat Forge (BHARATFORG)Pattern: Symmetrical Triangle
Breakout Zone: Above ₹1,272
Structure: Higher-low formation inside triangle; RSI > 55, MACD crossover supportive
Volume: Expansion seen near breakout candle
Plan:
Buy Trigger: Close above ₹1,272
Stoploss: ATR-based (~₹1,230)
Targets: ₹1,380 → ₹1,450
View: Momentum-supported breakout; auto-ancillary sector showing rotation strength.

Jio Financial Services (JIOFIN)Pattern: Bullish Flag
Breakout Zone: Above ₹312
Structure: Flag developing after a strong pole; EMAs supportive and flattening upward
Momentum: RSI recovering above 50, MACD histogram turning positive
Plan:
Buy Trigger: Close above ₹312
Stoploss: ATR-based (~₹298)
Targets: ₹360 → ₹388
View: Post-consolidation breakout potential; improving sentiment in Financials sector.

Waree Renewable Technologies Ltd: Chart ObservationThe daily chart for Waree Renewable Technologies Ltd (NSE) highlights a period of price consolidation over 59 trading sessions (86 days), during which approximately 55.75 million shares were traded. The stock has displayed movement within a defined range, bounded by a long-term trendline resistance and an ascending support line, forming a narrowing price channel.
Trendlines: A descending resistance line has guided price limitations, while an ascending support line maintained the base
Volatility: Periods of expansion and contraction in daily price bars reflect shifting volatility and trading sentiment
Volume Analysis: The consolidation phase saw steady volume with periodic surges
This setup provides a useful illustration of how price compressions and trends appear on technical charts, helping learners recognize phases of accumulation, resistance, and support.
Disclaimer: This post is intended for educational purposes only and does not constitute investment advice. Markets are subject to risk and unpredictable movements; investors should consult financial advisors and perform their own research before making any investing decisions.

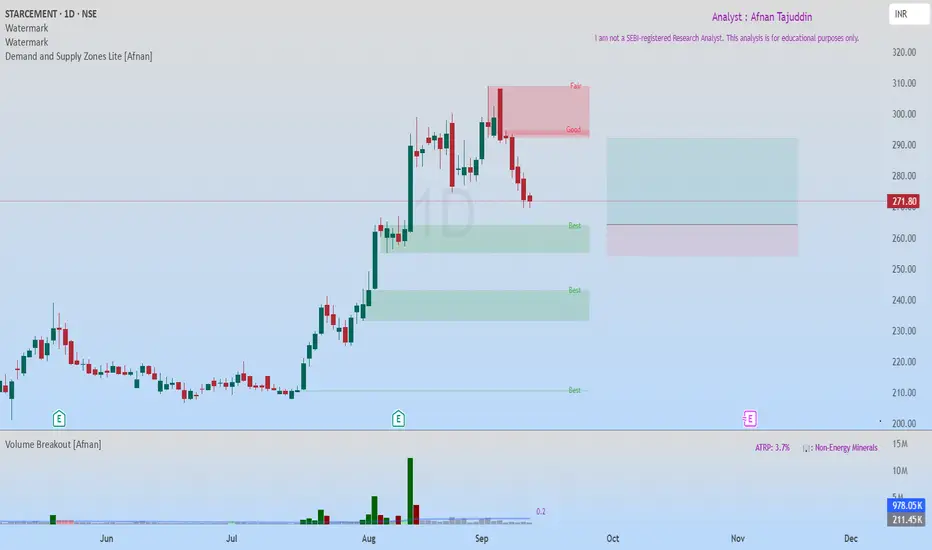
StarCement at Fresh Demand Zone – High Probability Bullish SetupStar Cement recently hit an all-time high and is now retracing towards a fresh Rally-Base-Rally (RBR) Demand Zone . This zone is of high quality, and the overall market structure remains strongly bullish. The best part? There’s no immediate supply zone until a potential 1:2 risk-to-reward target , which makes this setup even more attractive.
🔥 Why This Setup Looks Promising 🔥
The trend is super bullish .
Price is pulling back into demand , creating an opportunity for a low-risk entry.
Demand zone quality is excellent, supporting potential upside continuation.
No major supply zones nearby, leaving room for clean upward movement.
🔄 Two Possible Trade Scenarios 🔄
First Entry Opportunity: Enter near the current demand zone with stop-loss (SL) just below the zone. This is the stronger setup due to the fresh RBR formation.
Second Entry Opportunity: If the first SL gets hit and price dips lower, a secondary demand zone just below provides another entry chance. Place SL below that demand zone for safety.
💡 Risk Management Reminder 💡
While the setup looks strong, risk management remains key . Always place SL below demand zones and size positions carefully. Even the best setups can fail, but disciplined risk control ensures long-term success.
“In trading, it’s not about being right every time, it’s about managing risk and letting probabilities work in your favor.”
🚀 Keep learning, keep practicing, and remember—every pullback is a chance if you know where to look! 🚀
Lastly, thank you for your support, your likes & comments. Feel free to ask if you have questions.
📌 This analysis is purely for educational purposes and is not a trading or investment recommendation. I am not a SEBI registered Analyst.
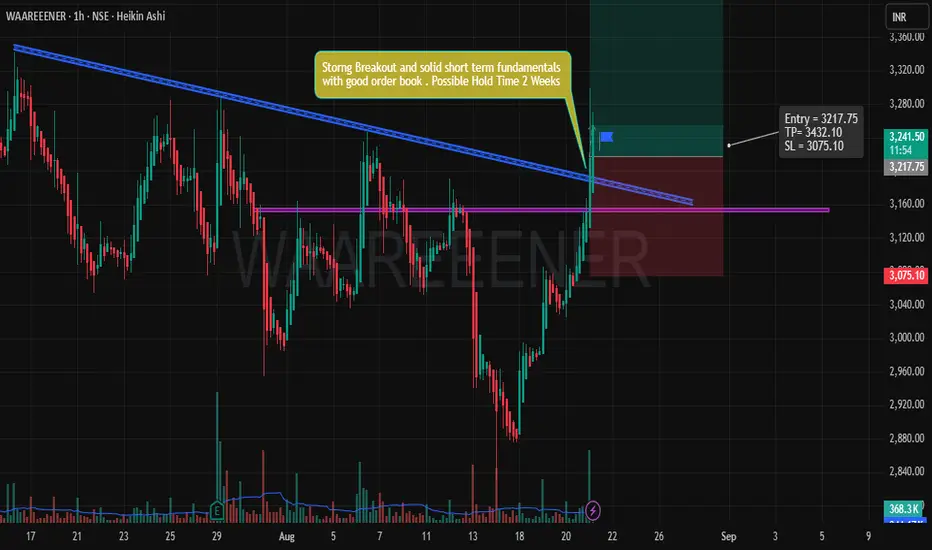
Trade Idea: Bullish Breakout for WAAREEENER (NSE)** IF you like my observation, please boost and follow for more content."
Trade Overview:
Instrument: WAAREEENER
Timeframe: 1-hour chart
Trade Type: Bullish Breakout
Entry Price: ₹3217.75
Stop Loss: ₹3075.10
Take Profit (TP): ₹3432.10
Target Duration: Possible hold time of 2 weeks.
1. Technical Analysis:
Breakout from Resistance:
The price action has shown a clear breakout from the resistance zone, depicted by the purple horizontal line at ₹3120. The breakout was supported by increasing volume, which is an important confirmation of strength in the upward movement. A breakout above this level suggests strong bullish momentum.
Strong Fundamentals:
This breakout is not just a technical move; there are solid short-term fundamentals backing this position. The order book is healthy, indicating strong buying interest at higher levels. Additionally, the current market sentiment seems to favor growth, which aligns well with the price action.
Trend Confirmation:
We’re witnessing a bullish trend confirmation. The current price movement is above the previous highs, which suggests further upward potential. The chart indicates the start of a trend that could continue for the next few weeks, aligning with the projected hold time of 2 weeks.
2. Risk-Reward Setup:
Risk:
The trade is managed with a reasonable stop loss of ₹3075.10. This is placed below the recent low, where the price seems to find support. A stop loss at this level helps protect from large losses in case the breakout fails.
Reward:
The potential reward is set at ₹3432.10, which is well above the breakout level. This level corresponds to a key resistance, and reaching it would offer a solid profit potential. The risk-to-reward ratio of this trade is favorable, providing a good opportunity for risk management.
3. Volume Confirmation:
Volume has been increasing as the price moves higher. This is a strong signal of institutional buying or significant market interest, which further strengthens the case for this breakout to hold and reach the take profit levels.
4. Conclusion:
This is a solid bullish setup based on the breakout above the resistance, accompanied by increasing volume, healthy market sentiment, and strong short-term fundamentals. The risk-reward ratio supports this trade idea, and the target of ₹3432.10 offers a clear upside.
Important Notes:
The trade might be subject to market fluctuations; therefore, ensure to monitor the price action closely.
If the price re-enters the resistance zone or shows signs of weakening, consider adjusting the stop loss or exit strategy accordingly.
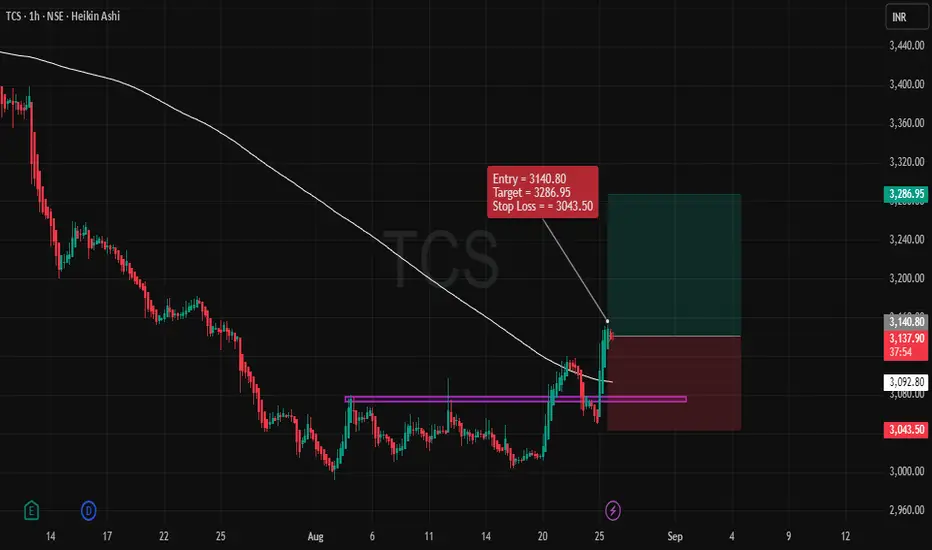
TCS – Bullish SetupSummary:
This trade setup is based on a bullish momentum seen in the recent price action of TCS. We are entering the position with the expectation that the price will continue to rise, following a significant upward breakout. The entry, stop loss (SL), and target price (TP) levels are set, and the risk-to-reward ratio (RRR) is favorable.
Key Points of the Trade:
Entry Point:
The entry for this position is at 3140.80, which is above the recent support level, indicating the continuation of the upward trend. The entry is triggered as the price has recently started to break through a key resistance zone, suggesting that the bullish momentum is likely to continue.
Stop Loss (SL):
The stop loss is set at 3043.50, just below the recent support zone. This ensures that we have a protective exit if the market reverses. Placing the stop loss here helps mitigate risk in case the trade goes against us.
Target Price (TP):
The target for this trade is 3286.95, a price level that corresponds to a recent resistance point. This target has been chosen based on the potential upside movement following the breakout, providing a good area for price to reach based on historical price action.
Risk-Reward Ratio (RRR):
With the entry at 3140.80, the stop loss at 3043.50, and the target at 3286.95, the RRR stands at 1:1.5. This is a healthy ratio, ensuring that the potential reward outweighs the risk, which is crucial for effective swing trading.
Market Context:
The price has recently bounced off a support level, and we are observing strong bullish momentum as the price moves above the resistance area. This suggests the market may continue its upward movement, making the trade setup valid.
Confirmation:
The recent price action and the movement above key levels provide confirmation of the trade. Additionally, the overall market sentiment for TCS is positive, which further validates the bullish trade idea.
Conclusion:
This trade setup is a bullish scenario for TCS, with a clear entry, stop loss, and target price. The risk-to-reward ratio is favorable, making this a logical and worthwhile trade to consider for swing trading on the 1-hour timeframe. Keep an eye on any changes in momentum or price action that may suggest a reversal, but as of now, the trend looks strong.
INFY Bullish Setup** IF you like my observation, please boost and follow for more content."
Ticker: INFY
Time Frame: 1-Hour
Trade Type: Bullish
Entry Point: 1486.20
Target Price (TP): 1589.15
Stop Loss (SL): 1417.45
Risk-to-Reward Ratio (RRR): 1:1.5
Trade Setup and Rationale:
Market Context:
INFY has been showing signs of recovery, breaking out of a corrective phase. The price is currently positioned for a potential uptrend, supported by a significant bullish pattern forming on the chart.
Entry Point (1486.20):
The price has recently tested a support zone and is now showing signs of a strong reversal. The entry point is set just above this level, ensuring a confirmation of the bullish trend before committing to the trade.
Target Price (1589.15):
The target is set at a key resistance level where price is expected to face potential selling pressure. This level aligns with previous highs and is a reasonable place to lock in profits while riding the trend.
Stop Loss (1417.45):
The stop loss is placed just below the recent swing low, ensuring that the trade has a controlled risk. This placement minimizes the risk of getting stopped out in case of minor fluctuations while keeping the risk-to-reward ratio favorable.
Trade Logic:
The trade is supported by a bullish breakout pattern with increasing volume. After a period of consolidation, price action is showing signs of upward momentum, making this a high-probability trade setup.
The risk-to-reward ratio of 1:1.5 offers a balanced risk for the potential reward, providing a good trading opportunity with a well-placed stop loss.
Volume Confirmation:
Volume is showing a steady increase as the price starts moving upward, indicating that market participants are supporting the bullish move.
Trend Confirmation:
The trend is confirmed by the price breaking above previous resistance, and the bullish setup aligns with the market structure.

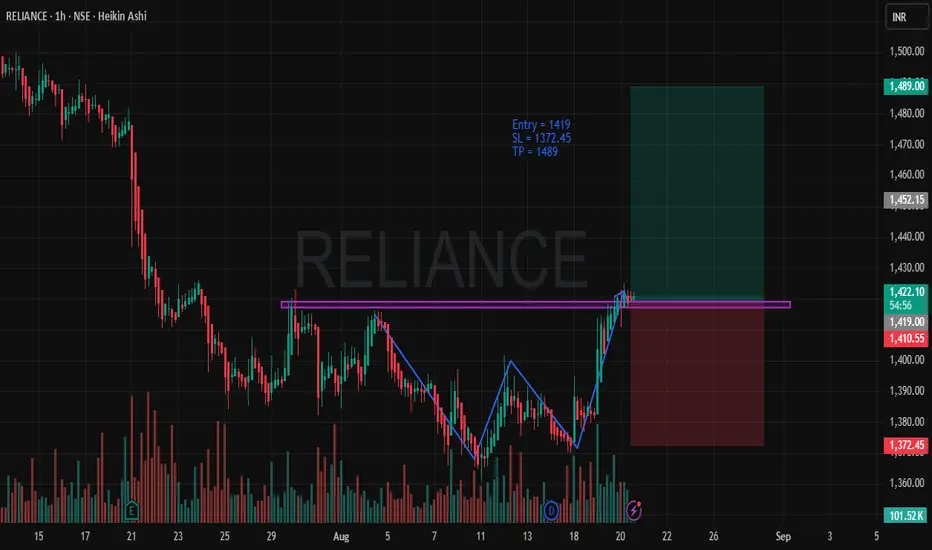
RELIANCE - Bullish SetupTimeframe: 1-Hour
Trade Type: Long Position
Entry Price: 1419
Stop Loss (SL): 1372.45
Take Profit (TP): 1489
Risk-to-Reward (RRR): 1:3.53
Trade Rationale
Bullish Trend Setup: The price action is showing a clear bullish momentum as RELIANCE has recently broken through a significant resistance level (indicated by the purple line). This breakout is a strong signal of potential upward movement.
Chart Pattern: The price forms a classic double bottom pattern (highlighted on the chart), which signifies a reversal from a downtrend to an uptrend. The pattern is confirmed with strong volume, showing the increased participation of buyers.
Entry Point: We are entering this position at 1419, right after the price breaks the resistance and starts moving upwards. This breakout marks the start of the potential rally.
Stop Loss: The SL is placed at 1372.45, just below the recent swing low, ensuring a safe exit if the market decides to reverse.
Take Profit: The TP is placed at 1489, a logical price target that accounts for a solid risk-to-reward ratio of 1:3.53. This is a reasonable expectation based on recent price action and volatility.
Volume Confirmation: Strong volume is observed, confirming the strength of the move. Typically, breakouts accompanied by high volume are more likely to continue in the breakout direction, supporting the bullish scenario.
Market Conditions: The broader market conditions appear favorable for long positions, with sentiment and technical indicators showing bullish signs across the broader market.
Risk Management
A tight Stop Loss ensures that we minimize risk in case of market retracement, while the Take Profit target allows us to ride the trend and maximize the potential return on this trade.
The Risk-to-Reward Ratio is set at 1:3.53, which aligns with sound risk management principles, allowing for substantial profits even with a lower win rate.
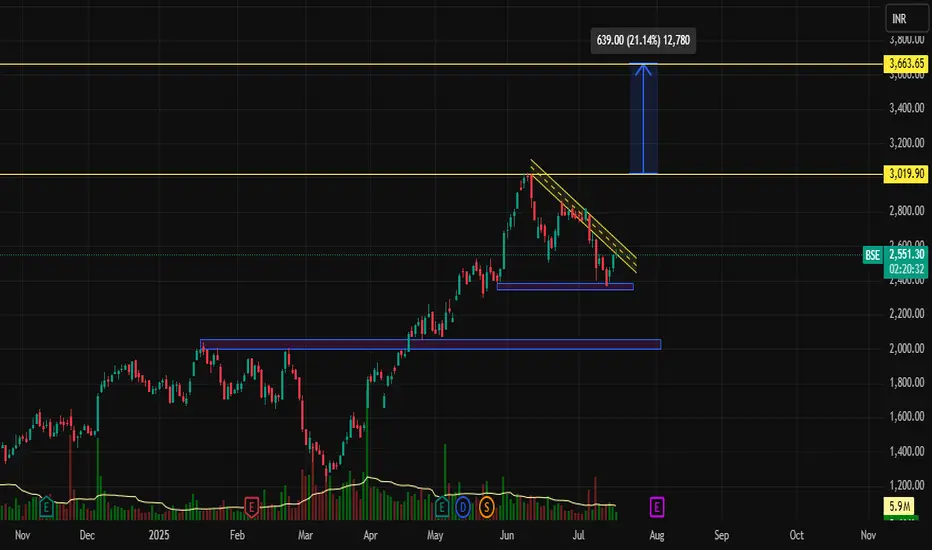
BSE | Falling Wedge Breakout Imminent? Potential Upside of 21%Stock: BSE (Bombay Stock Exchange)
Timeframe: Daily (1D)
Current Price: ₹2,547.90
Potential Upside: ₹639 (+21.14%)
Resistance Levels: ₹3,019.90, ₹3,663.65
Support Zones: ₹2,370 | ₹2,110
📌 Technical Analysis
1. Falling Wedge Formation (Bullish Reversal Pattern)
BSE is currently trading within a well-defined falling wedge pattern, a classic bullish reversal structure. The stock has been consolidating after a strong uptrend and is approaching the apex of the wedge, indicating a possible breakout.
Downward Sloping Resistance Line is being tested.
The support zone around ₹2,370 has held strong multiple times, creating a solid base.
2. Volume Analysis
Noticeably declining volume during the wedge formation signals a healthy consolidation phase.
A spike in volume on breakout would confirm strong buying momentum.
🔍 Breakout Target Projection
If BSE breaks out from the wedge resistance, the measured move suggests a potential upside of ₹639, bringing the target around:
📍 Target: ₹3,180–3,340 range
📍 Long-Term Resistance: ₹3,663.65 (next major hurdle)
🧠 Strategy Suggestion
Type Entry stop loss entry
Swing Trade ₹2,600–2,650 (after breakout confirmation) ₹2,370 ₹3,019 / ₹3,340 / ₹3,663
Note: Wait for daily candle close above the falling wedge with above-average volume for confirmation.
⚠️ Key Observations
🔹 Bullish momentum from previous uptrend still intact.
🔹 Price respecting demand zone at ₹2,370.
🔹 RSI near neutral – enough room for an upside.
🔹 Ideal breakout zone: Between ₹2,600–2,650
📅 Conclusion
BSE is showing a promising setup with a falling wedge pattern supported by strong demand zones. A successful breakout could lead to a 20%+ rally. Keep this stock on your radar as it nears a potential trend reversal.
📌 Disclaimer: This is not investment advice. Do your own research or consult with a financial advisor before investing.
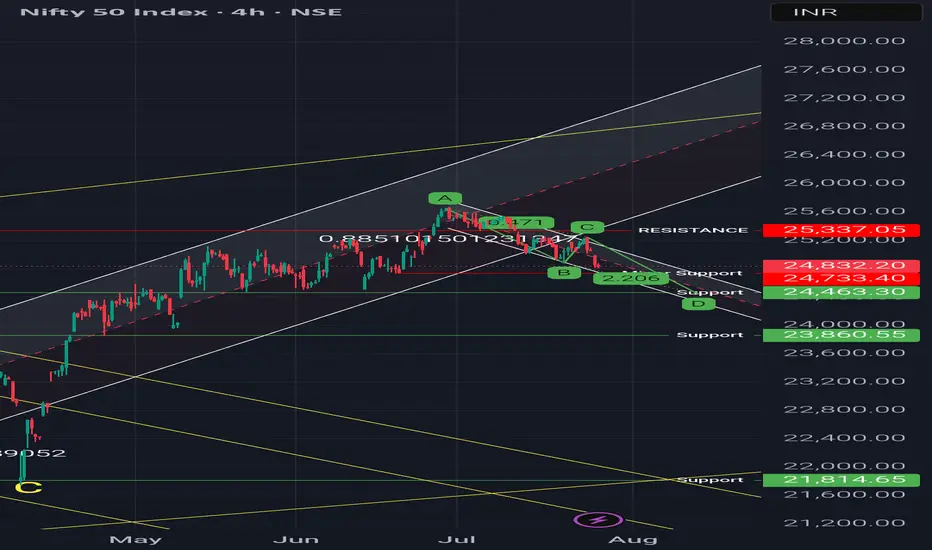
Regression channel & Harmonic pattern - Short term bearish trendObservations:
1. It is short term bearish trend as long as price holds above 24400
2. Price is below 50 DEMA
Possible Scenarios:
1. Price may attempt a mean reversion toward the median line of the channel
2. A break above could retest the 25,240–25,337 resistance zone, up move can only be considered when weekly candle will closed above that level because on weekly time frame there is 4 crows formation.
3. Harmonic patterns (1:1) suggests, the level of 24470 Support level in coming 10-15 trading days.