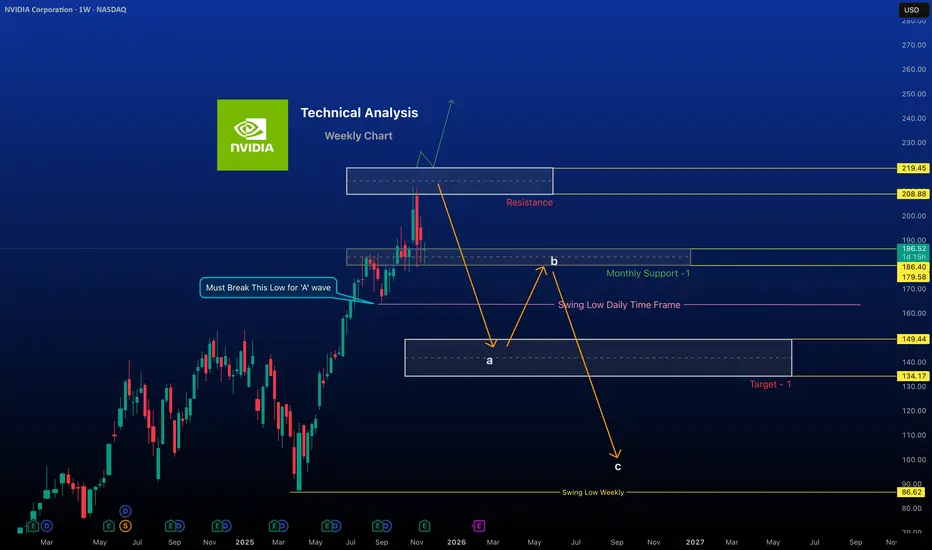
NVIDIA Turn consolidation phase In Weekly Time frame“Chip maker? More like dip maker today.”
#NVIDIA
Trend / Momentum
The stock is in a consolidation phase and range-bound lately, not in a strong runaway uptrend. However, RSI is around neutral (~52), indicating neither overbought nor oversold conditions.
Support & Resistance Levels
Support: Key support around $175–$185.
Resistance: Key resistance near $208–$220, as per recent weekly analysis marked on the chart.
Bullish to neutral overall:
Technicals suggest no runaway rally at the moment, but the long-term trend remains constructive. If NVDA breaks above $229 with volume, it could signal a strong bullish leg. On the downside, a weekly close below $175 may put pressure on the stock and trigger further weakness toward Target-1 or consolidation.
Disclaimer
High Risk Investment
Trading or investing in assets like crypto, equity, or commodities carries high risk and may not suit all investors.
Analysis on this channel uses recent technical data and market sentiment from web sources for informational and educational purposes only, not financial advice. Trading involves high risks, and past performance does not guarantee future results. Always conduct your own research or consult a SEBI-registered advisor before investing or trading.
This channel, Render With Me, is not responsible for any financial loss arising directly or indirectly from using or relying on this information.
NVDA
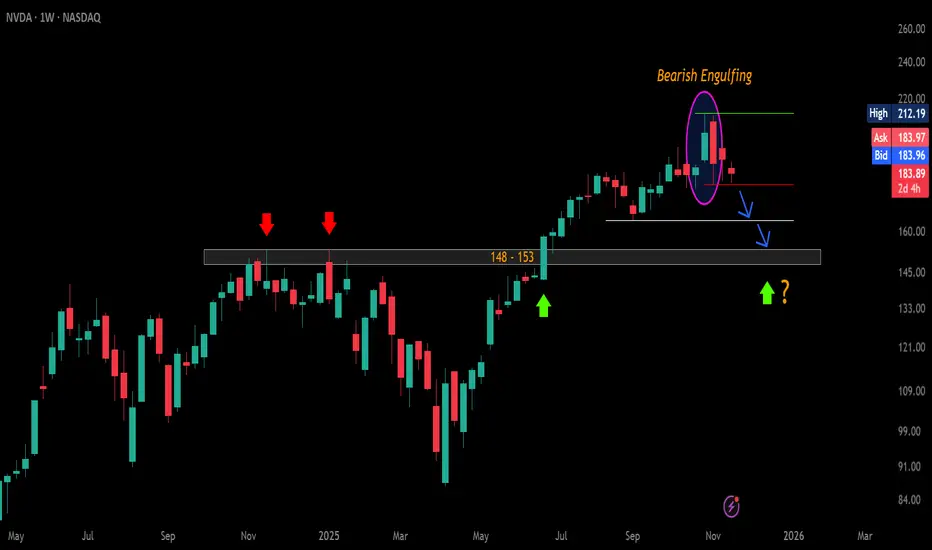
$NVDA – Weekly Bearish Signal Triggering?CMP: $184
NVDA has formed a Bearish Engulfing on the weekly chart and is currently trading inside the engulfed candle.
A WCB / sustained break below $178.91 will confirm the pattern → likely dragging price toward $164 and the major $153–$148 breakout-retest zone . 🔻
A WCB above the ATH $212.19 will invalidate the pattern and signal a fresh uptrend. 🚀
📌 Note: Q3 earnings to be announced post-market. 🕒
Bias: Short-term bearish, HTF bullish if $148–$153 holds. 💚
#USMarket #NVDA #Stocks #TechnicalAnalysis #PriceAction #BearishEngulfing
📌 #Disclaimer: This analysis is shared for educational purposes only. It is not a buy/sell recommendation. Please do your own research before making any trading decisions.
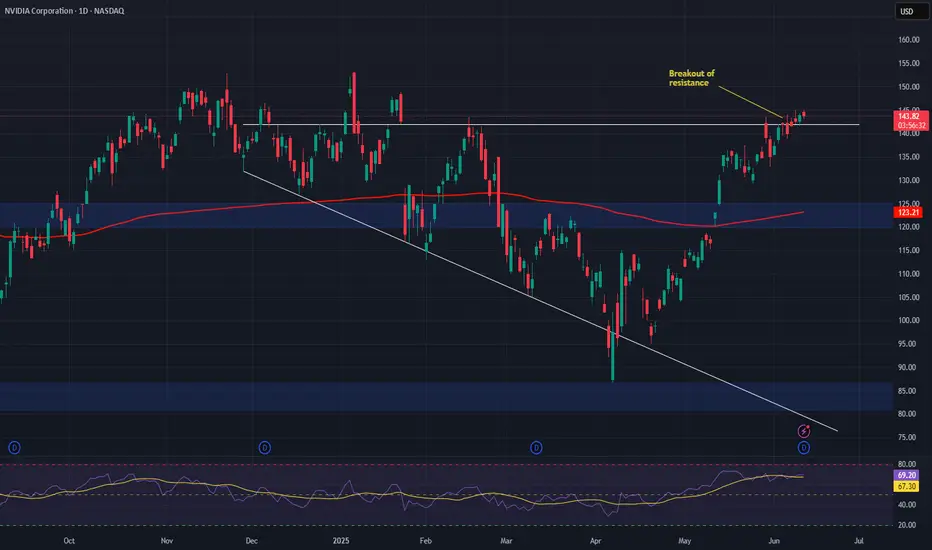
NVDA Breaks Trendline, Eyes $155–150 SupportNVIDIA recently gave a trendline breakdown on the chart, indicating that bullish momentum has weakened. After the breakdown, the stock also retested the broken trendline from below, which is a common technical behavior — often referred to as a breakdown and retest pattern. This confirms that the broken trendline has now turned into a resistance level.
⚖️ Implications
Since the retest failed to reclaim the trendline, selling pressure is likely to continue.
The stock is now vulnerable to further downside and may gradually drift lower.
The immediate support zone lies at $155–150, which coincides with prior demand areas where buying interest previously emerged.
✅ Key Levels
Resistance (Invalidation): The broken trendline — if price reclaims and sustains above it, bearish momentum weakens.
Support: $155–150 zone (short-term target area).
Trend Bias: Bearish as long as the stock trades below the retested trendline.

NVDAgood parallel channel setup on daily chart. results are few days away. any closing above 132 may be very good for short term

Nvidia (NVDA) – Building the AI Wave, Not Just Riding ItCompany Overview:
Nvidia NASDAQ:NVDA remains the undisputed leader in AI, high-performance computing, and now increasingly software infrastructure. With growing exposure to agentic AI, healthcare AI, and autonomous systems, Nvidia is redefining its growth story beyond semiconductors.
Key Catalysts:
🧠 Software Ecosystem Expansion
AI Blueprints, Llama Nemotron, and NIM microservices fuel adoption of agentic AI
High-margin, recurring revenue from software complements GPU hardware growth
Moves Nvidia closer to a platform-as-a-service model
🏥 Healthcare AI Momentum
Siemens Healthineers adoption of MONAI Deploy accelerates Nvidia’s footprint in diagnostics & imaging
Opens the door to pharma, life sciences, and clinical AI markets—a multi-billion-dollar TAM
🔧 Physical & Agentic AI Enablement
Positioned at the frontier of robotics, autonomous machines, and next-gen interfaces
Nvidia's tech stack is becoming foundational to the next wave of machine intelligence
Investment Outlook:
✅ Bullish Above: $120.00–$125.00
🎯 Target Price: $220.00–$230.00
📈 Thesis Drivers: AI platform leadership, expanding software revenue mix, and key vertical growth in healthcare & robotics
🧩 Nvidia isn’t just enabling AI—it’s defining its future. NASDAQ:NVDA #AIStocks #AgenticAI #Semiconductors
NVDA’s Final Act: A Breakout Waiting to HappenNVDA appears to be nearing the completion of its corrective phase, setting the stage for a potential move to new highs. The current pattern resembles a falling wedge, indicative of an ending diagonal formation, which often signals a reversal and the start of an upward trend.
The structure of the corrective channel, along with the termination of the diagonal pattern, suggests a high likelihood of a running flat formation. Buyers are likely to intensify demand pressure as the price approaches the lower boundary of the trendline. A trend reversal may occur if there is a decisive breakout above the Wave 4 level of the ending diagonal.
Buying opportunity with minimal stop is possible after the reversal from lower side of the channel. Targets can be 112 - 120 - 132 - 140.
I'll be sharing more details shortly.

Nvidia $nvda Corporation Technical Analysis - Daily Time Frame➡️💘#Nvidia NASDAQ:NVDA Corporation is a leading 🇺🇸#American technology company known primarily for designing graphics processing units (GPUs) for the gaming and professional markets, as well as being a key player in the development of artificial intelligence #AI and machine learning technologies. Here's some detailed
📉chart information for your reference

NVDA -Near support NVDA -Near support
Close below 102.4 can test 96.4 which is previous resistance and now it act support.
We also have trendline support at 96.4 and EMA 200 at 93.56
Overall chart looks bearish

NVDA: Correction PhaseHello everyone,😉
I’ve put a scenario for the stock 'NVDA' together, which is currently drawing attention.
This scenario is based on not only the "Elliott Wave Theory" but also various analytical tools, so please take it into high consideration.
✔️ Wave from $140.76 downward: "Extended Flat"
This is an 'Extended Flat' composed of a 3-3-5 structure. The final C wave was completed as an 'Extended fifth wave impulse.'
✔️ Wave from $90.69 upward: "Zigzag"
This is a 'Zigzag' with a 5-3-5 structure. The A wave and C wave have a 1.618 ratio, which adds a high level of credibility.
✔️ Conclusion: Projected Path
Based on the wave count so far, I’ve drawn the projected path. I anticipate the appearance of a downward impulse wave and used the downward parallel channel and Fibonacci levels to estimate the potential decline range.
First support zone: $100.03
Second support zone: $84.57 (very strong)
Good luck!
This is not a buy or sell recommendation.
It is a personal perspective and should be used for reference only.
All decisions and responsibilities are yours.

NVIDIA vs Ruseel 2000 - is money moving out of NVIDIA to RUT?Is the entire world is rotating out of NASDAQ:NVDA into Russell 2000 small-cap stocks.
Could it be another Cisco .com bubble comparison. Everyone tries to find AI companies that offer significant returns. In reality most of them provide no value and the infrastructure AI is built on continues to be growing asset (NVIDIA).
Let us look at the charts.
From the charts it is clear that NVIDIA is still in an uptrend, has formed a falling wedge.
We are targeting 135 in the days to come.
The Russel 2000 seems more like a short squeeze and it has got more legs on it.
Whether this is the start of a new bull market, we will only know in the times to come.
As an NVIDIA investor, I choose to hold on till as a time trend doesn't change.

#AMD $AMD164 Above breakout possible
170/175/185 expected to test
2 days ago try to breakout but not sustain
this time if breakout can test all target

NVDAAfter Gap up opening it has been doing distribution on top to form probable bearish head and shoulder pattern.
It still need to complete right shoulder. Only then it may be able meet vision

NVDA Expecting correctionI believe the impulse is over and we may see a correction from here which can go deeper as well!!


NVDA #Wyckoff Events Accumulation BullishWyckoff Events Accumulation Schematic #2
Bullish
312-320 is important resistance to cross. if failed then profit booking
a mild retracement from 320 may be good for fresh entry after consolidation or sideways

NVIDIA (NVDA) Wave Formation & Rounding Bottom Completion , LongVERDICT NVIDIA (NVDA)
Wave Formation and
Rounding Bottom Completion
Huge Upside Targets
T1 192 Positional
Only For Study Purpose

NVDA Investment Plan - 21/Mar/2022Hello Traders,
Hope you all are doing good!!
I expect this stock to shoot up from around 130-140 price level after completing the correction.
Look for your BUY setups.
Please follow me and like if you agree or this idea helps you out in your trading plan.
Disclaimer: This is just an idea. Please do your own analysis before opening a position. Always use SL & proper risk management.
Market can evolve anytime, hence, always do your analysis and learn trade management before following any idea


NASDAQ - NVDA - Exact signal foundHere i share the view of NASDAQ - NVDA - exactly selling signal found.
And it has given a very good move in down side

lines work bestTrendline drawn on weekly log chart gives the upside and downside range. 630-650 is the maximum upside but down side is open for 280-290 and 250
