AT&T Inc BREAKOUTAT&T Inc Share has broken its previous pattern after a strong bullish move. It increased by 100% in two years, from 14 to 27, and now it’s breaking out with a big bullish monthly candle. Due to this strong upward momentum over the past few years, the stock might consolidate for a while before moving higher. This means the upward move could take some time or even a year, so we should keep that in mind when swing trading or investing.
The target and stoploss levels depend on each person’s risk appetite. A minimum risk-reward ratio of 1:1 is always good for swing trades. For example, if our target is around 32 or 33, we could set the stoploss below 25, like at 24.5. This would give a risk-reward ratio of approximately 1.77.
This is just an analysis based on the chart pattern. We can't always expect the share to move exactly as we want. That's why we always put a stoploss. Because many different people are trading based on their own thoughts and decisions. So, never feel bad if a share doesn’t move the way you expect. There’s always an opportunity somewhere else to grab.
Nyse

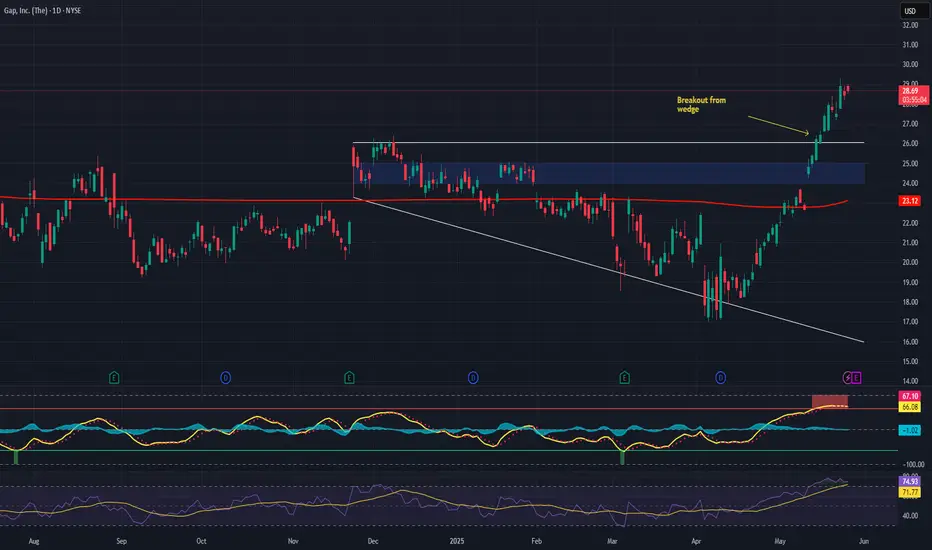
Gap, Inc. (GAP) – Reinventing Retail Through AI and InnovationCompany Snapshot:
Gap Inc. NYSE:GAP , home to Gap, Old Navy, Banana Republic, and Athleta, is entering a new era of transformation under fresh leadership with a focus on technology, AI, and operational agility.
Key Catalysts:
AI-Driven Reinvention 🤖🛍️
Launched an Office of AI to accelerate personalization, demand forecasting, and automation
Enhancing digital marketing, customer experience, and inventory precision
Supply Chain Stability 📦🌎
Less than 10% exposure to China tariffs reduces margin volatility
Emphasis on diversified, resilient sourcing
Digital Transformation Momentum 📲
Investing in e-commerce platforms and data integration across brands
Aligning fashion cycles with real-time demand via predictive analytics
Brand Strength & Consumer Reach 👚👖
Broad appeal across income segments
Old Navy and Athleta continue to gain traction with value-conscious and wellness-driven consumers
Investment Outlook:
✅ Bullish Above: $24.00–$25.00
🚀 Upside Target: $44.00–$45.00
📈 Growth Drivers: Strategic tech adoption, supply chain discipline, brand modernization
💡 Gap isn’t just making clothes—it’s tailoring the future of fashion retail with AI. #GAP #RetailTech #AIinFashion
Comprehensive Research - McDonald’s Stock Set to SoarQuick read:
McDonald's stock is poised for a bullish move, with Wave 3 likely starting and strong support near 290.50–295.00. Traders should long on dips within this range, for next resistance levels, 326.00 and 348.00 with a invalidation below 276.00. This setup offers a solid risk-to-reward in a long-term uptrend. Alternative safe entry is possible after the break of corrective channel breakout of wave (2).
Elliott Wave Forecast:
TF - Daily
The chart suggests that McDonald’s stock is in the middle of a larger upward move known as Wave C, which comes after completing a complex correction. Wave C is expected to unfold in five smaller waves, a pattern that usually points to a strong uptrend. It appears the correction is behind us, and a fresh bullish phase is underway.
Starting from the low at 276.53 , marked as Wave B, the price climbed to 326.32 , forming Wave one. After that, the stock pulled back to 290.50 , forming Wave two. This pullback followed a typical ABC pattern within a corrective channel, which often signals the end of a downturn and the beginning of an upward move.
Now, Wave three seems to be starting, and this is usually the strongest part of Wave C. The price is expected to move above 335 , take a small pause for Wave four, and then rise again to complete Wave five somewhere around 345 to 350 dollars. This positive outlook remains intact as long as the price stays above 290.50 . With the breakout from the corrective channel, the setup looks strong and clear for buyers.
Fibonacci levels:
Fibonacci Extension Targets:
1.000 extension: 326
1.618 extension: 348
Correction Retracement Levels:
Wave 2 retracement: 78.6%
A = C in A-B-C correction: 289.21
Price Action & shifting of value:
TF: Weekly
McDonald’s stock has been steadily climbing inside a rising channel since late 2020, showing a clear long term uptrend. The price has respected both the top and bottom edges of this channel very well, and interestingly, the middle line has acted like a pivot, providing support or resistance multiple times over the years.
Recently, the stock made a higher low at 276.53 and bounced back strongly, keeping the bullish structure intact. It then pulled back to 290.50 , right around the middle line of the channel, and held above an upward sloping trendline. This kind of price action shows strength and suggests buyers are stepping in.
The sharp move from 276.53 up to current levels looks like a strong bullish leg, possibly driven by accumulation. If the stock can break above its recent high of 326.32 , it could head toward the upper end of the channel. As long as the price stays above 290.50 and especially above 276.53 dollars, the bulls remain in control. Even if the price dips a bit, the long term trend stays positive unless the lower boundary of the channel breaks down.
I will update more Information here.

NSE IONQ - Are we ready for a breakout?The corrective phase is complete and an impulse move appears likely. A strong buy above the A-B-C channel could target levels around 30 - 37 - 45 or higher. Good entry is possible above 26 . However, if conditions worsen, further corrections may ensue.
I will update further information soon.

Buy Cenovus EnergyShort Term Trading Advice by Naranj Capital
Buy Cenovus Energy
● Buy Range- 20.6 - 20.9
● Target- 22.2 - 22.5
● StopLoss- 20
● Potential Return- 6-8%
● Duration- 14-15 Trading Days

Buy GoDaddyShort Term Trading Advice by Naranj Capital
Buy GoDaddy
● Buy Range- 124 - 127
● Target- 133 - 136
● StopLoss- 118
● Potential Return- 5-7%
● Duration- 12-14 Trading Days

AlibabaDisclaimer: Information provided is not financial advice. Consult a qualified professional before making investment decisions. Past performance is not indicative of future results. Invest at your own risk.


ARMIPO BASE
Companies making initial public offerings draw a lot of investor attention. That often results in unusual and brand-new chart patterns. Volatility can rise as investors size up demand for the new stock. Yet there are opportunities in these cases, if you can spot the correct characteristics amid the price-and-volume action.
The framework of a good IPO base is simple. The decline from peak to low usually doesn't top 20%, but the most volatile markets have produced declines of up to 50%. The length is often less than five weeks and can be as short as seven days. These two factors alone make IPO bases wayward cousins compared with proper bases, such as the cup with handle and flat base, which need at least five to seven weeks of work.

Crude long term bias for 2024I am expecting crude to hit 130.00 within the first two quarters next year. Sharing the long term bias

Nasdaq in complex correctionNASDAQ:IXIC
I think Nasdaq composite is in XX Wave right now. No one can predict this wave how long it will be what kind of structure will unfold in this structure.
Two Possibilities: -
1] It's in control range within main range. where price retest at resistance of control range.
So, maybe price will go near 13500/- for retest and then go up near 13800/-
After 13800/- price will go below 13000/- for completion of Wave Z.
2] Price will go straight from here to 13800 and then will go near 13000/- for completion of Wave Z.

Expectations for Crude OIL (NFA)This is what I am thinking for Crude Oil for this week and the upcoming week

Nikkei 225 is strong. Going for all time high.TVC:NI225
Nikkei 225 index is in range. Price was rebounding and reversing on support & resistance. recently price gone outside of value area tested strong support value area (Sky color) near 30700.
After testing 30700 market was on fire to inside big value area (Range). It's sign of buying in market.
Nikkei 225 MAYBE will go more upside near 32850 or 33000 and then reverse.

pullback is expected to emmplete soon in NIOThis is an elliott wave analysis.
A reasonable pullback had occurred.
we can start accumulate from here.
we can average further if it goes around $8 - $9.
With low risk and high reward.
i'm not a semi registered advisor.
I'm sharing my personal view.
Kindly post me comments if you people have any queries.
Your doubt will be cleared accordingly.
#elliottwave #NYSE , #sharemarket , #Nasdaq , # technical analysis

Diagonal ended. A new raise of Walt DisneyExplained in a chart clearly.
An impulse wave was over with an ending diagonal. We may expect an impulse up side move.
But it may also give a little low .

BAC Analysis(Bearish Flag and Pole Pattern)!Bank of America Corporation Analysis on Daily Timeframe!
Bearish Flag and Pole Pattern Formation in BAC
Flag Breakdown in BAC
Bank of America Corporation made Bearish Flag and Pole pattern. We can see the sharp fall in Bank of America Corporation after price made a flag and moving inside the flag. The price given a breakdown to the flag support and able to closed below it. I have marked important levels in chart which is Fib level 1.618 will be act as a possible support level(23.49). For the target I have projected the pole length from the flag breakout point so the downside target would be 19.39.
Trade Psychology and Setup =
Entry = One can enter after Retesting and Aggressive traders can initiate short at current level
Target = Projected Downside Target Will be 19.41
Stop Loss = Above 29.55
Disclaimer = All my analysis are for Educational Purpose only. Before entering into any trade - 1) Educate Yourself 2) Do your own research and analysis 3) Define your Risk to Reward ratio 4)Don't trade with full capital


Dow Jones Industrial Index Technical Study TVC:DJI
Analysis After 9th Dec 2022 Closing
> Dow Theory wise - It was Making HH &HL but After Last day of closing, it seems like there will be no another HH Furthermore in Weekly TF it has made Evening Star pattern also. (Bearish)
> Wave Count wise - 5th Impulse wave is also finished, so probably corrective wave ABC might be possible for next week for DJI. (Bearish)
>Chart Pattern Wise - Head & Shoulder pattern is about to formed, confirmation after breakdown of neckline shown in chart. (Bearish)
Bearish Divergence is also there in MACD and RSI too.
Furthermore,
According to chart, just below neckline there is crucial red line, breakdown of that line red line is confirmation for all the above points.
Medium Term Target is end of 4th Impulse wave because of Depth off Correction Concept.
What if Analysis
Ignore this study, if on next trading day market opened with huge GAPUP and gone up.

BABA Long Trade PlanBABA Long Trade Plan
EP: 112.31
SL: 104.77
TP1: 121.59
TP2: 129.85 (trailing SL and ride towards TP3)
TP3: 155.21

Alibaba Group Holdings Ltd Hi Everyone
This is an forecast of Alibaba group Holdings we have completed wave 1 called M1 ( medium term forecast). Time frame for Medium term forecast is usually 2 to 4 weeks.
We are currently in wave M2 which is still progressing but almost in last stage. So price should move downward unless it brakes invalidation Level.
use our tradingview live links for the update in counts.
Thank You

Netflix ready to moveNetflix has formed a pennant pattern and currently its in a position to either give a breakdown or a breakout from this point. A proper trade can be initiated after either of those happens with good volumes.


$LUV Daily Maybe don't mess with Pilot's rights and they won't walk. Or do and we take down your market cap by quite a bit.
$33.41 x 3/1/22
