NZD/CHF Potential Bullish Reversal Setup NZD/CHF Potential Bullish Reversal Setup 🔄📈
📊 Chart Analysis:
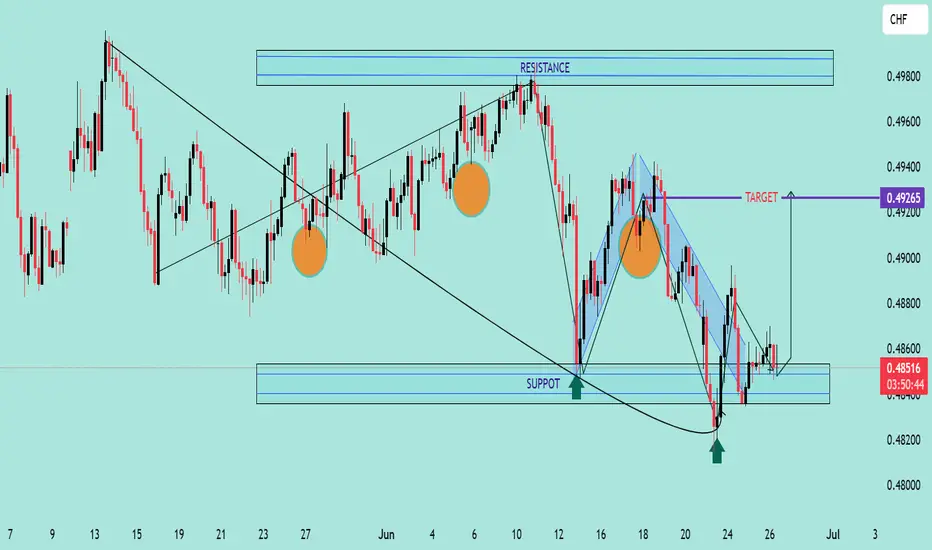
The chart shows a potential bullish reversal for NZD/CHF, supported by technical patterns and key levels:
🧠 Key Technical Highlights:
🔹 Double Bottom Formation (🟠 Circles)
A clear double bottom pattern can be seen around the 0.48300 support zone, signaling potential reversal from the downtrend.
🔹 Strong Support Zone 📉
Price bounced from a historically respected support zone (~0.48200–0.48400), which held several times in the past (marked with green arrows).
🔹 Downtrend Breakout 🔺
A short-term bearish channel has been broken to the upside, indicating potential bullish pressure.
🔹 Target Zone 🎯
Immediate bullish target is around 0.49265, aligning with previous resistance.
🔹 Resistance Area (🔵 Boxes)
Next significant resistance lies at 0.49400–0.49800, which may act as the next hurdle if price breaks the 0.49265 level.
✅ Conclusion:
As long as price holds above 0.48400, bulls may aim for the 0.49265 🎯 target. A breakout above that level can open the path to higher resistances.
📌 Bullish Bias maintained above support zone — monitor for volume confirmation and retest strength.
Nzdusdbuy
NZD/USD 4HChart Analysis:Bullish Reversal Setup from Demand Zone📈 Price: 0.59552
📊 EMA 70: 0.59410 (🟤 Brown Line)
Chart Zones & Key Levels
🔷 Resistance Zone:
🔼 Around 0.60298 – 0.60304
🔹 Price reacted strongly here (🔽 white arrows)
🔹 Acts as a ceiling for now
🟢 Demand Zone:
🔽 Around 0.58800
✅ Buyers stepped in here before
📉 If price drops again, might bounce from here
🟥 STOP LOSS:
❗ 0.58793
🔸 Protects from deeper losses if trend breaks down.
TRADE IDEA
1️⃣ Entry Idea: Wait for a pullback into the Demand Zone
📉⬇️
2️⃣ Bullish Reversal Expected:
⬆️ Bounce toward Target Zone
🎯 Target Point: 0.60300
🟦 Profit zone marked in blue
💸 Good Risk/Reward ratio.
Indicators & Pattern
📐 Wedge Pattern:
🔹 Bullish breakout potential
🔹 Currently respecting the channel
📉 EMA Crossover Area:
🔸 Could act as dynamic support/resistance
🟤 Price hovering around EMA (0.59410)
Summary:
✅ Buy Setup if price holds above 0.58800
🎯 Target: 0.60300
🛑 Stop Loss: 0.58793
⚠️ Watch the price reaction at the Demand Zone for confirmation!

NZD/USD 15-Min Chart – Bullish Setup from RBS + RBR Zone🟦 Key Support Zone
This blue area is a strong RBS (Resistance Becomes Support) + RBR (Resistance Becomes Resistance) zone. Price bounced here before, confirming its strength.
2. Entry Point
🔵 Buy Entry: 0.58912
This is where you expect the price to bounce again within the support zone.
3. Stop Loss
🔻 Stop Loss: 0.58776
Placed just below the support zone to manage risk if the setup fails.
4. Target Point
🎯 Take Profit: 0.59500
You’re aiming for this level, expecting a bullish continuation.
5. Price Projection Path
🟠 Orange arrows show the expected price movement:
Pullback to the support zone
Bounce upward toward the target
6. Trendline Support
📈 Upward diagonal blue line – supports bullish momentum
7. EMA (7-period)
⚫ Black EMA line showing short-term trend – currently above price, slight retrace

NZDUSD Day TMF - Bullish Trend 450++Day timeframe bullish trend expect
Buy price at 0.59500
Target - 0.63200++

NZDUSD 4HRS TF rally DirectionNZDUSD 4HRS TF
Stoploss 0.60864
Target 0.65044
Now Current Price 0.62364
Sure Shot....
delay prediction...

NZDUSD LongNZDUSD Long
Risk/Reward: 1:3
Give a Like and Feel free to share your opinions in the comment!
Happy Trading 😊


NZDUSD Longs!As we have NFP this week, I'm expecting USD to be weak. Please use proper risk management.
