OFSS - STWP Equity SnapshotSTWP Equity Snapshot – OFSS (Educational | Chart-Based Interpretation)
📌 Intraday Reference Levels (Structure-based)
Reference Price Zone: 7,841
Risk Reference (Structure Invalidation): 7,432.87
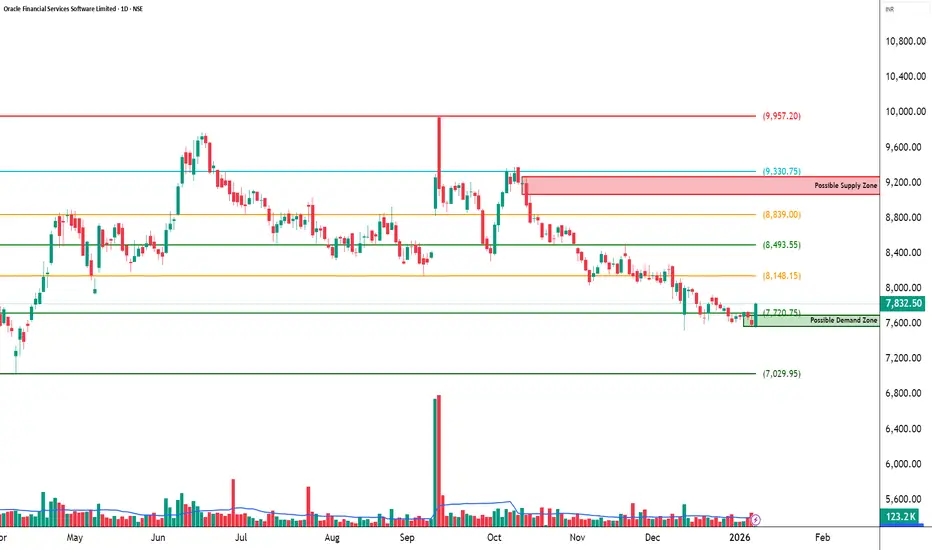
Observed Upside Zones: 8,330.75 → 8,657.26
📌 Swing Reference Levels (Hybrid Model | 2–5 days | Observational)
Reference Price Zone: 7,841
Risk Reference (Structural Breakdown): 7,324.35
Higher Range Projection (If structure sustains): 8,874.29 → 9,649.27
Key Levels – Daily TF
Support: 7,643 | 7,455 | 7,356
Resistance: 7,931 | 8,030 | 8,219
🔍 STWP Market Read
Oracle Financial Services Software Ltd is attempting a base-building recovery after a prolonged corrective phase. Price has recently reacted positively from a defined demand zone, while overhead supply remains visible across clustered resistance bands. The latest rebound reflects improving participation, though confirmation is still evolving.
Momentum indicators are balanced rather than aggressive, with RSI near 48.48, suggesting stabilization without overextension. Volume remains around average (Vol X ~1.46), indicating participation but not yet a decisive expansion. Overall, the structure points to early stabilization with conditional upside, while risk remains elevated until price sustains beyond nearby supply.
📊 Chart Structure & Indicator Summary
Structure: Corrective base with early rebound
Trend: Improving, not yet dominant
Momentum: Strong recovery attempt, still developing
RSI: Healthy zone — neither stretched nor weak
MACD & ADX: Gradual improvement, trend strength building
Volume: Moderate, awaiting confirmation
📈 Final Outlook (Condition-Based)
Momentum: Strong (developing)
Trend: Improving / Early up-bias
Risk: High (overhead supply & confirmation pending)
Volume: Moderate
💡 STWP Learning Note
Recoveries are processes, not events. Strong outcomes emerge when price structure, momentum, and volume align over time — patience and risk discipline remain essential.
⚠️ Disclaimer:
This is an educational market interpretation based on chart structure and publicly available data. It is not a recommendation, advice, or solicitation. Equity markets involve risk. Please consult a SEBI-registered financial advisor before taking any investment or trading decision.
📘 STWP Approach:
Observe momentum. Respect risk. Let structure guide decisions.
💬 Did this add value?
🔼 Boost to support structured learning
✍️ Share your views or questions in the comments
🔁 Forward to traders who value disciplined analysis
👉 Follow for clean, probability-driven STWP insights
🚀 Stay Calm. Stay Clean. Trade With Patience.
Trade Smart | Learn Zones | Be Self-Reliant 📊
OFSS
OFSS (ORACLE FIN SERVICE) By KRS Charts5th June 2025 / 12:35 PM
Why OFSS?
1. Fundamentally Good Company.
2. Technically, Bullish Stock for a long time and here again made higher low on bigger time frame.
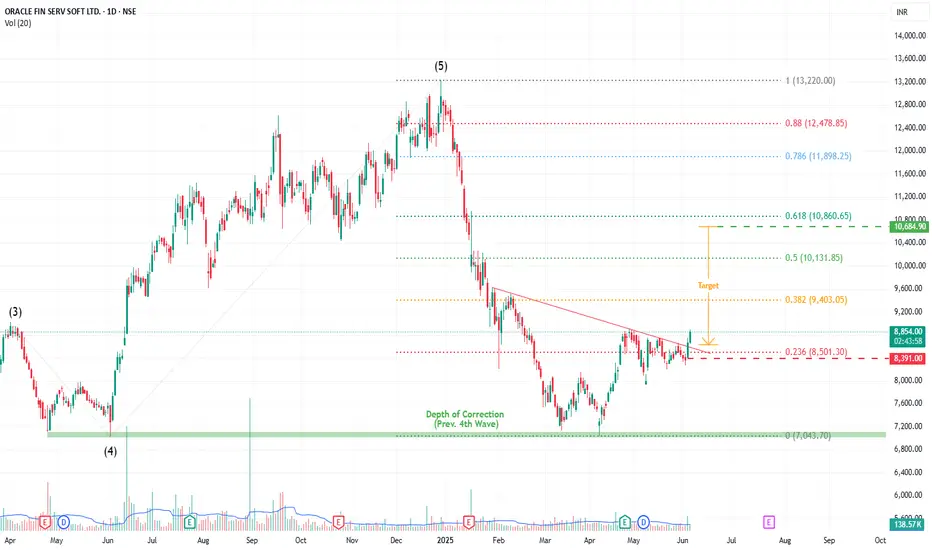
3. Wave Theory vice it bounces back from 4th impulsive wave (Depth of Correction).
4. After that it has formed few bullish charts pattern like Invt. Head & Shoulder and Flag and Pole is also visible within.
5. Yesterday it Broke Neckline with good volume green candle.
Targets & SL (1D Closing Basis) is mentioned in Chart
OFSS : Turning Back?📊 Technical Analysis: OFSS – Weekly Chart
🌀 Elliott Wave Count
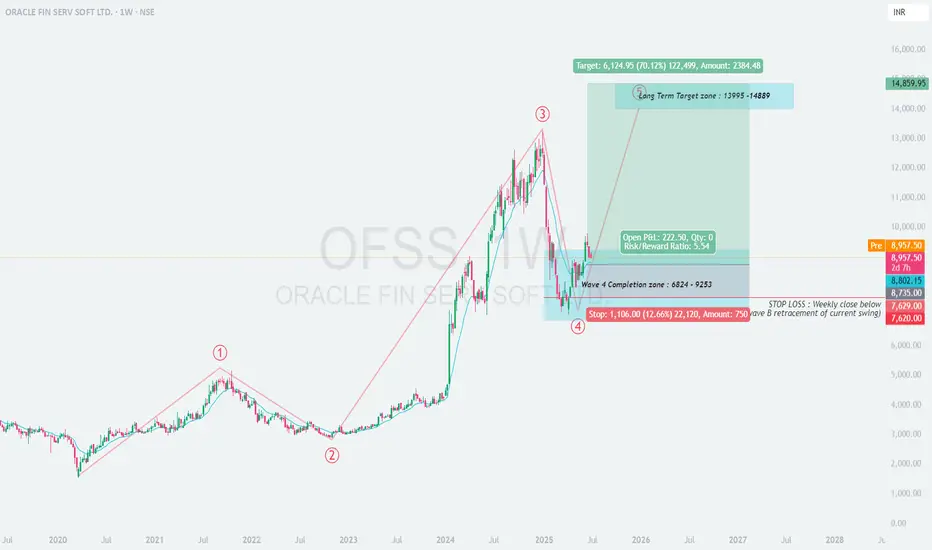
The chart shows a classic impulsive 5-wave Elliott structure.
Currently, Wave 4 seems to have completed in the zone of ₹6824–₹9253.
The current price action indicates the beginning of Wave 5, targeting significant upside.
🟦 Wave 4 Completion Zone: ₹6824–₹9253
Strong buying interest observed in this zone.
Multiple bullish candles from the support band indicate trend resumption.
Wave structure suggests upside momentum may now pick up.
🟩 Long-Term Target Zone: ₹13,995 – ₹14,889
Based on the projected Wave 5 extension, the upside potential is nearly +70% from current levels.
Ideal for long-term investors and positional traders.
📝 Trade Setup
✅ Entry:
Current Market Price (CMP) ~ ₹8,957
🎯 Targets:
T1: ₹13,995
T2: ₹14,889
❌ Stop Loss:
Weekly close below ₹7,629 (Wave B retracement & structure invalidation)
📈 Risk-Reward Ratio: ~5.54
🔒 Risk per share: ₹1,106
🚀 Potential Gain per share: ₹6,124
🧠 Trade Logic
Strong Elliott wave structure favors Wave 5 continuation.
Risk is well-defined and acceptable for the expected return.
Ideal case of “buying into the start of an impulsive wave”.
📌 Summary:
OFSS has completed its Wave 4 corrective phase and is now positioned for a strong Wave 5 rally. Long-term investors may consider accumulating near current levels for a target of ₹14,800+, maintaining a strict SL below ₹7,620 on a weekly close basis.
OFSS: Setting Up for a Relief Rally?🔍 Introduction
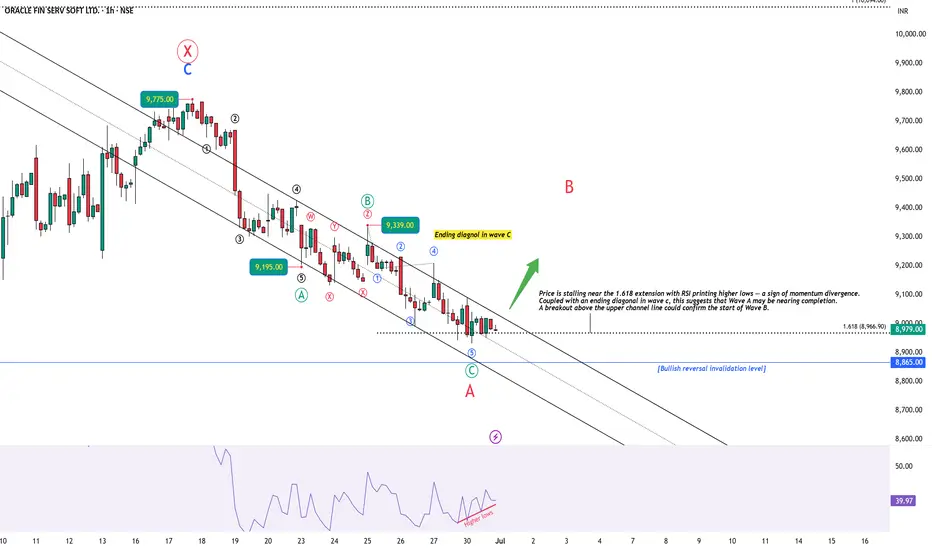
This analysis starts from the 1-hour timeframe, where price action shows signs of exhaustion at the tail end of a 5-wave decline. A classic ending diagonal in wave c, along with bullish RSI divergence, points toward a potential short-term reversal — possibly the start of Wave B in a larger A-B-C corrective structure. We then zoom out to place this setup within a broader W-X-Y correction that began from the 13,220 high.
🕐 1H Chart: Ending Diagonal + RSI Divergence into Key Zone
Following the peak at 9775, price has been declining in what appears to be a ABC zigzag correction. Subwave 5 (within wave c) exhibits ending diagonal behavior, with overlapping internals and weakening thrust. Importantly, RSI has been printing higher lows, diverging strongly against lower price lows — a signal of potential bottoming.
Price is also testing the 1.618 Fibonacci extension level. A decisive breakout above the upper trendline would confirm a likely transition into Wave B.
🟢 Watching closely for a decisive breakout / close above the channel.
📆 Daily Chart: W-X-Y Structure from 13,220 High
Zooming out, ORACLE FIN SERV is unfolding a W-X-Y correction from its 13,220 high:
Wave W completed as a zigzag down to 7038.
Wave X unfolded as a zigzag rally, peaking at 9775. Notably, Wave C of X did not reach 100% of Wave A — signaling internal weakness.
Wave Y is now developing as a red A-B-C structure, with Wave A possibly ending near the 8930 level.
🧠 Conclusion & Key Levels to Watch
Wave A of Y appears to be nearing completion, supported by:
Ending diagonal structure in wave C (1H)
RSI bullish divergence
Price stalling at 1.618 extension
A breakout above the channel could mark the start of Wave B — potentially retracing 38–61.8% of the drop from 9775
📌 This setup offers both short-term and structural clues. I’ll post follow-ups as this unfolds.
⚠️ Disclaimer
This post is for educational purposes only and does not constitute financial advice. Please do your own research and manage risk appropriately.
OFSS | Cup and Handle | Breakout | Daily **Oracle Financial Services Software Ltd. (OFSS)** based on the charts you provided:
---
🔍 **Patterns and Structure Observed:**
* The chart shows a **Cup and Handle breakout** pattern, where the price formed a large rounding bottom (Cup) and a handle consolidation (Triangle).
* The breakout occurred above the **₹8,913** level with strong volume, confirming the bullish move.
---
🔹 **Key Levels:**
* **Breakout Level:** ₹8,913
* **Current Price:** \~₹9,161
* **Immediate resistance zone:** ₹9,538
* **Higher targets:** ₹10,685 based on the measured move of the Cup and Handle pattern.
* **Support zone:** ₹8,900–₹9,000.
---
🔹 **Volume & Momentum:**
* There is a **significant volume spike** at the breakout, suggesting institutional interest.
* If the price sustains above the ₹9,000–₹9,100 zone, the breakout is likely to be validated, with further upside likely.
---
🔹 **Implication:**
As long as the price stays above the breakout zone 8,900, the chart favors further upside toward the next resistance targets. If the price reverses below the ₹8,900 zone, the breakout could be invalidated.
---

OFSS | Symmetrical Triangle | BreakOut |DailyGot it! I see the **ORACLE FIN SERV SOFT LTD** chart.
Let’s break down what we’re seeing:
---
**🔍 Pattern Observed:**
✅ **Symmetrical Triangle / Ascending Triangle:**
The chart shows an **ascending triangle breakout** pattern — higher lows and horizontal resistance. Volume is starting to increase, suggesting an upcoming move.
✅ **Base Formation:**
* There was a **rectangle base** (accumulation zone) from March to April 2025, marked with a box.
* Post breakout from this rectangle (around 8,000 zone), the stock formed higher lows, consolidating into the triangle.
✅ **Resistance:**
* Horizontal resistance around ₹8,913.15 – key breakout level.
* Once price closes above this zone with volume, the pattern confirms.
---
**📈 Measured Move Target:**
* Height of the triangle / base: \~₹1,000
* Breakout level: \~₹8,900
* **Target:** ₹8,900 + ₹1,000 = **₹9,900 – ₹10,000** zone
---
**🔧 Indicators:**
* Volume increased during the breakout attempt – bullish sign.
* EMAs are starting to converge; above EMA-21 and EMA-55, showing short-term trend strength.
---
**✅ Conclusion:**
* **ORACLE FIN SERV SOFT LTD** is attempting an ascending triangle breakout.
* Confirmation comes with a strong close above ₹8,913 on increased volume.
* Target potential: ₹9,900 – ₹10,000.
Would you like me to highlight support/resistance, trendlines, and add potential trade setups (stop-loss/target zones) for this breakout? Let me know! 🚀📊

OFSS reached the support as mentioned in previous postThe price reached the support line of fib 0.886 level. After confirmation, we can take the buy position. This is for educational purposes only.

OFSS Stock of the Week.NSE:OFSS is at a perfect level for a Short Downside Swing as per the price action on daily charts. Although the RSI is in an Oversold Zone it may give a dead cat bounce.
F&O Activity:
11,000 Looks like a Big Resistance With Major Long's being Covered.
Trade Setup:
It can be a Good 1:1 RISK-REWARD Trade for Aggressive Swing Trader if the Level is Breached.
Target(Take Profit):
8866.65 Levels for Swing Trade.
Stop-Loss:
11187.65 Levels for Swing Trade.
📌Thank you for exploring my idea! I hope you found it valuable.
🙏FLLOW for more
👍BOOST if useful
✍️COMMENT Below your views.
Meanwhile, check out my other stock ideas below until this trade is activated. I would love your feedback.
Disclaimer: This analysis is intended solely for informational and educational purposes and should not be interpreted as financial advice. It is advisable to consult a qualified financial advisor or conduct thorough research before making investment decisions.

OFSS -Inverted Head and shoulder— Near Breakout -Daily
OFSS -Inverted Head and shoulder—Daily
It also forming flag and pole pattern.
Name - OFSS
Pattern - Inverted head and Shoulder
Timeframe - Daily
Status - Near breakout
Cmp - 10988
Target - 13074 - need to close above 11330
SL - 10700
Pattern
The Inverted Head and Shoulders pattern is a bullish reversal pattern
Fundamentals
Oracle Financial Services Software Limited (OFSS) is a prominent player in the financial technology sector. Here are some key fundamentals of the company:
Market Capitalization: Approximately ₹93,085 crore
Share Price: ₹10,9887 on NSE
Price to Earnings (P/E) Ratio: 39.86
Revenue: ₹6,652 crore for the fiscal year ending March 2024
Net Profit: ₹2,335 crore for the same period
Dividend Yield: 2.24%
Return on Equity (ROE): 32.53%
These metrics indicate a strong financial position and consistent performance.

OFSS - Breakout Setup, Move is ON...#OFSS trading above Resistance of 9759
Next Resistance is at 12911
Support is at 6606
Here are previous charts:
Chart is self explanatory. Levels of breakout, possible up-moves (where stock may find resistances) and support (close below which, setup will be invalidated) are clearly defined.
Disclaimer: This is for demonstration and educational purpose only. This is not buying or selling recommendations. I am not SEBI registered. Please consult your financial advisor before taking any trade.

Oracle Financial Services Software Ltd - Long Setup, Move is ON.#OFSS trading above Resistance of 6606
Next Resistance is at 9759
Support is at 4658
Here is previous chart:
Chart is self explanatory. Levels of breakout, possible up-moves (where stock may find resistances) and support (close below which, setup will be invalidated) are clearly defined.
Disclaimer: This is for demonstration and educational purpose only. This is not buying or selling recommendations. I am not SEBI registered. Please consult your financial advisor before taking any trade.

OFSS (Looks Ready For 9000)Oracle Financial Services Software (OFSS) has given a range breakout on a daily time frame today. The stock could head towards 8400, 8,700, and 9,000 in the coming few days. The stop loss can be placed at 7,742, which is today's low.
Disclaimer: I am not a SEBI registered analyst. All the stocks are for educational purposes. Investors must consult a financial advisor before making any investment. It is not a buy or sell recommendation.

OFSSOFSS is near it's CUP & HANDLE pattern breakout on a weekly time frame. Stock promises attractive dividends as per the history.
NOTE: I'm not a SEBI REG. Study before investing.

OFSS chart 150% move in a year💥OFSS chart 150% move in a year💥
Fibonacci levels played so well in this chart pattern and great move after the 50% Fibonacci levels.
Lines drawn an year back aged well and now it shows how chart resists on those levels of 8200 levels.
No recommendations, just my view on the chart that fetched great result.

OFSS | Positional Trade📊 DETAILS
Sector: IT Services & Consulting
Mkt Cap: 38,619 cr
Oracle Financial Services Software Ltd provides financial software, custom application development, consulting, IT infrastructure management, and outsourced business processing services to the financial services industry. The company was incorporated in 1989 and is based in Mumbai, India. Oracle Financial Services Software Limited is a subsidiary of Oracle Global (Mauritius) Limited.
TTM PE : 21.05 (High PE)
Sector PE : 34.29
Beta : 0.89
📚 INSIGHTS
Mid-range performer
Stock with medium financial performance with average price momentum and valuation. These stocks may be affordable and are showing some investors interest.
2.38% away from 52 week high
Outperformer - Oracle Financial Services Software up by 10.58% v/s NIFTY 50 up by 4.1% in last 1 month
📈 FINANCIALS
Piotroski Score of 4/9 indicates Weak Financials
Disclaimer: This analysis is for educational purposes only, and I'm not a SEBI registered analyst.
If you found this analysis helpful, I encourage you to like and share it. Your observations and comments are also welcomed below. Your support, likes, follows, and comments motivate me to consistently share valuable insights with you.
🔍 More Analysis & Trade Setups 🔍
For more technical analysis and trade setups, make sure to follow me on TradingView: www.tradingview.com

OFSS | Swing Trade📊 Details
Oracle Financial Services Software Ltd provides financial software, custom application development, consulting, IT infrastructure management, and outsourced business processing services to the financial services industry. The company was incorporated in 1989 and is based in Mumbai, India. Oracle Financial Services Software Limited is a subsidiary of Oracle Global (Mauritius) Limited.
Disclaimer: This analysis is solely for educational purposes and does not make me a SEBI registered analyst.
If you found this analysis helpful, I encourage you to like and share it. Your observations and comments are also welcomed below. Your support, likes, follows, and comments motivate me to consistently share valuable insights with you.
🔍 More Analysis & Trade Setups 🔍
For more technical analysis and trade setups, make sure to follow me on TradingView: www.tradingview.com

OFSS C&H BREAKOUTOFSS breaking f&p pattern
#weekly basis with good volume
near #target can be 5160
EDUCATIONAL IDEA

OFSS C&H BREAKOUT OFSS breaking c&h pattern
with good volume and rsi
trading above all key ema
educational idea only


OFSS weekly viewOFSS is currently forming a cup pattern on the weekly timeframe, indicating a potential upward trajectory, as shown by the yellow cup on the chart. Additionally, it has the possibility of forming a handle in the future, which could lead to a breakout from there.

STOCKS TO KEEP ON RADAR FOR UPCOMING SESSIONSNSE:PIDILITIND
Stocks to keep on the radar for upcoming sessions.
1. Pidilite
2. Axis Bank
3. OFSS
4. PEL
5. MFSL
All stocks have a bearish bias and the analysis is explained in the video
This is only for educational purposes only.
Always trade with stop-loss.
I hope you found this idea helpful.
Please like and comment.
Share with Your Friends.
Keep Learning,
Happy Trading!

OFSS LongOFSS Long - Oracle
Rounding bottom pattern formation.
Seeing momentum for upmove. If high volume, can give good returns
Levels in blue line of chart.
No recommendations, just view.

BREAKOUT IN OFSSOFSS has made a perfect formation for a good breakout for the next few days.
Curve formation, also it has tested its resistance with good volumes.
Curved trendlines also show a breakout.
