OIL Long Term Buy OpportunityOIL India has broken >10 year high and presents a good long term buy opportunity
Oil

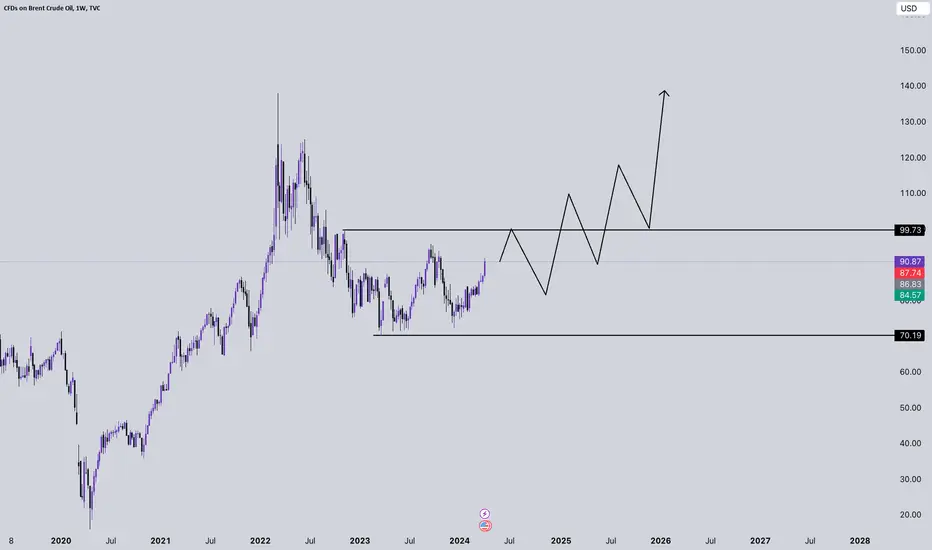
UK OIL Technical Analysis - The weekly outlook for UK Oil looks very positive and promising
- The base is getting matured on the weekly whereas the Daily base has already matured
- As of now waiting for the base to form and enter once you see a low getting taken out by huge demand
- My Bias over this is straight bullish and nothing else to consider
05 Apr - Nifty was Flat, BankNifty picked up momentum!Nifty Analysis - Stance Bullish ⬆️
Recap from yesterday: “Now take a look at the 63mts chart, and see where the reversal came from ~ 22295 levels. That is the main reason why we said a stance change is required only if 22295 is broken and since we did not do that, we continue to remain bullish.”
Nifty had no momentum today, but BankNifty had lots of it. Yesterday SPX & NDQ had a real down day and its spillover effects were visible during the opening minutes. We opened gap-down and then slowly recovered from that. There were no abrupt or wild movements for a change. That takes me to the next question, why did we really have a 300+ point fall yesterday? It was not because of RBI MPC, otherwise we would have passed the swing high. How many of you think it could be because of the worsening situation in the Middle East?
Today was an inside day with no real momentum and that does not mean that we are not bullish. We will keep an eye on the Global macros, if the news about the War widening in scope both in Ukraine and Israel is true then it could really kill the optimism. Just before the macros worsen - GOLD prices go up. An escalation of tensions will shoot up the OIL prices as well. At present, we have both.

USOIL is ready to rockUS Oil is at important zone formation of pole and flag pattern.If this sustain then we can see a good move. what is your view please comment it down. We are Certified. All views shared on this channel are my personal opinion and is shared for educational purpose and should not be considered advise of any nature

Crude oil bearish engulfingOn weekly chart Crude is forming bearish engulfing pattern and at Bhoomi Maya's red band i.e. where any sell entry is activated.
Target green bands 5761 as T1


CRUDE-OILresist 82.50-82.00
support 80.50-80.00-79.59-79.00
watch carefully price in this areas and plan trade


XTIUSD USOUSDresist. 83.00-83.30
support 82.00-81.00-80.00
watch carefully in this zone and plan trade

XITUSD CRUDE-OIL USOILSUPPORT 82.00-81.00
RESIST. 83.50-84.00
we can plan both side trade but according to me 84.00 if price goes there that one will perfect trade. i will wait for 84.00


Best buying level in Asian Paints !Asian Paints stock is making ascending triangle and in the pattern stock is making falling channel
Also Wekkly RSI is around the support which says we are around the support
Stock has strong support around 2800-2850
Also stock never breaks the weekly strucuture
we can see huge bounce from these levels
One can expect to give returns of 30-40% in coming weeks
Thank You !!

crudeoil uptrend movement. can expect a target of 88/89Symbol: USOIL
TImeframe 2 hours
Analysis Breakout from symmetrical triangle.
another pattern we got is cup and handle pattern.
Note: Education purpose

Crude Oil Analysis: Potential Rally Ahead Towards 6800Hey Traders,I'm keeping a close eye on crude oil as it appears to be gearing up for an interesting move. Currently, it seems like crude oil is heading towards the $6800 mark.The key level to watch out for is the Chanmep level. If we see a breakout above this level, it could signal the start of a significant rally.Keep a watchful eye on the charts and let's see how this plays out!Disclaimer: This is just my personal analysis and not financial advice. Always do your own research before making any trading decisions

USOIL is FightingUSOIL Which is showing a great opportunity USOIL is fighting with the resistance. what is your view please comment it down. We are NISM Certified. All views shared on this channel are my personal opinion and is shared for educational purpose and should not be considered advise of any nature.

Nasdaq Index price action.As per chart Nasdaq showing reversal from support. It may run to test it's all time high soon.

Saudi Aramco Short Term ViewTADAWUL:2222
SAUDI ARAMCO breaks out of parallel channel after completing wave 3 extension.
Now I think it's in wave 4 the ideal correction measure for wave 4 is 38.2% of wave 3. maximum is 50% of wave 3. In this case it's possible that stock will correct to near 50%.
Now why 50% I'm saying is because there is strong support created on 14 jul 2022 at near 31.20 which will act as support.
See my next analysis for LONG TERM view.

Bullish bias on OIL ( 10% - 15% upside)the price might sweep some liquidity before moving up
near around 74 level sweep
the target comes out as 82 and 88
which comes near about 10-15% upside potential
not a trading advice just my outlook
considering other factors fundamentally

OIL | Investment Pick📊 DETAILS
Sector: Oil Exploration and Production
Mkt Cap: 38,539 cr
Oil India Ltd is engaged in exploration, development and production of crude oil and natural gas, transportation of crude oil and production of LPG. It also provides various E&P related services for oil blocks.
TTM PE : 6.56 (High PE)
Sector PE : 7.62
Beta : 0.77
📚 INSIGHTS
Strong Performer
Stock with consistent financial performance, quality management, and strong technical momentum indicating good investor enthusiasm. Currently valued at Good to expensive valuation
1.51% away from 52 week high
Outperformer - Oil India up by 9.75% v/s NIFTY 50 up by 9.39% in last 1 month
📈 FINANCIALS
Piotroski Score of 8/9 indicates Strong Financials
Disclaimer: This analysis is for educational purposes only, and I'm not a SEBI registered analyst.
If you found this analysis helpful, I encourage you to like and share it. Your observations and comments are also welcomed below. Your support, likes, follows, and comments motivate me to consistently share valuable insights with you.
🔍 More Analysis & Trade Setups 🔍
For more technical analysis and trade setups, make sure to follow me on TradingView: www.tradingview.com

US OIL BULLISH MOMENTUM DETECTEDUS OIL faceing a trendline support on week chat
Hence a good opportunity for all forex and CFD user to grab this one
It will be bullish for more than 1 mongth
Due to week chat analysis
Hence analyse yourself for short-term trade
just buy side only
Market is bullish
So trade only buy side on your trade setup

Oil India Limited - Long Setup, Move is ON...#OIL trading above Resistance of 502
Next Resistance is at 774
Support is at 334
Here are previous charts:
Chart is self explanatory. Levels of breakout, possible up-moves (where stock may find resistances) and support (close below which, setup will be invalidated) are clearly defined.
Disclaimer: This is for demonstration and educational purpose only. This is not buying or selling recommendations. I am not SEBI registered. Please consult your financial advisor before taking any trade.

ASIANPAINTS Breaking out 1 month of consolidation . Reasons To Enter : NSE:ASIANPAINT
1. Stock about to breakout after consolidating for a almost a month .
2. Crude Oil is going down , so considering the inverse correlation between crude oil and paint stocks , we can see demand going up as oil gets cheaper .
3. Stock closing above both 50-9 EMA
4.Breakout , retest already done . Now price might go up .
.
.
.
The information provided is for informational purposes only and does not constitute financial advice. Investing in the stock market carries risks, and past performance is not indicative of future results. Individuals should conduct their research, consider their risk tolerance, and seek professional advice before making investment decisions. The accuracy and completeness of the information are not guaranteed, and the authors disclaim any liability for losses incurred based on reliance on this information.
