OIL INDIA LTD – Structure Tiring as Crude Starts Firing?What began as a heroic rally from ₹42 to ₹767 in a powerful impulse now finds itself wobbling under its own weight. OIL INDIA LTD’s chart tells a story of exhaustion — both structurally and contextually — just when crude oil is flexing again on the global stage.
Amid rising geopolitical tensions and war-like murmurs pushing crude prices higher, the Indian oil sector may be sailing into headwinds. And this isn’t just a macro hunch — the waves themselves are flashing caution.
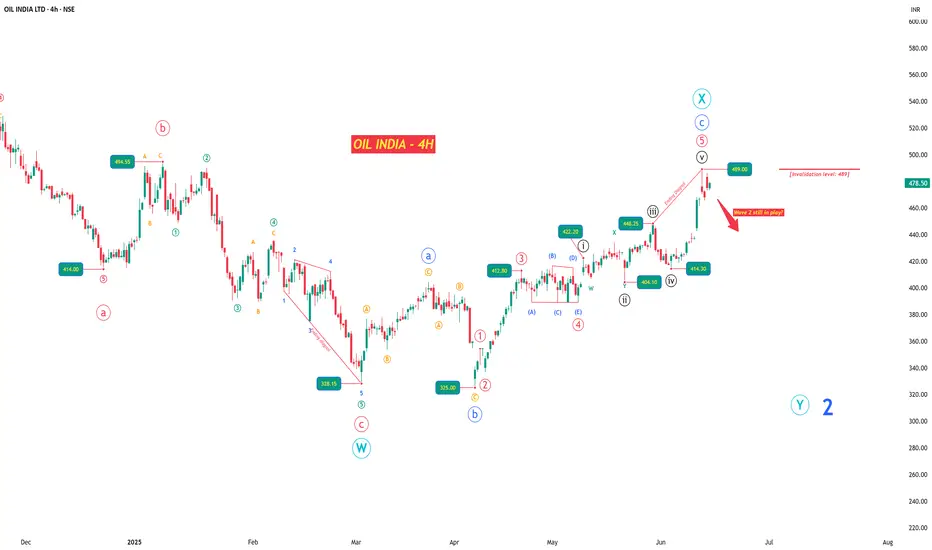
After a Wave 1 climax near ₹767.90, price action has shifted into a corrective mode. I interpret the ongoing structure as a W-X-Y double zigzag , and within it, a key event unfolded: a classic ABC flat correction, beginning in March.
The April rally — which at first glance looks like a fresh impulse — is in fact the C leg of that flat. While it did unfold in 5 waves, the fifth wave formed an ending diagonal , complete with overlapping internals and fading momentum. This could be the last gasp .
Zooming into the 4H chart, the rise from ₹325 to ₹489 fits neatly into a corrective framework, not an impulsive one. That makes ₹489 a crucial invalidation level . If price stays below it, we likely begin Wave Y of the broader correction — a move that could push OIL INDIA back toward or even below ₹325.
However, if price breaches ₹489 and sustains, that’s your early signal that this entire bearish setup is off, and a new bullish sequence may be unfolding instead.
The stop-loss is tight, the downside wide. If this count holds, the risk-reward setup is highly favorable.
Further analysis continues in the notes below — covering multi-timeframe wave counts, internal structures, and confluences from RSI, volume, and Bollinger Bands.
Oilindiatechnicalanalysis
Oil India - Levels to watchAs we have seen stock respecting demand and supply zone most numbers of times
Currently stock is stuck between a strong demand and supply zone
Also it has been trending in a lower channel
As of now we have a high area of confluence where supply zone meets the upper channel
It can most probably act as resistance
Downside we have a demand zone too
So area of resistance becomes 448 - 450
Area of support becomes 395 - 400
As of now at the current price, it can also be a good straddle candidate
Or can wait to reach any side edge to trade

Oil India cmp 491.70 by Weekly Chart viewOil India cmp 491.70 by Weekly Chart view
- Price Band 412 to 432 Support Zone
- Falling Resistance Trendline Breakout seems sustained
- Rising Support Trendline continuation seems going stable
- Volumes spiking over past few weeks and well above avg traded quantity
- Technical Indicators of EMA, MACD and RSI showing positive trend for a fresh upside
