OLECTRA: Wave C Bottoming? Big Upside Move Brewing!⚡ OLECTRA – Wave C Completion Zone Hit | Is a Strong Reversal & Wave C Rally Coming?
🧠 Overall Chart Context
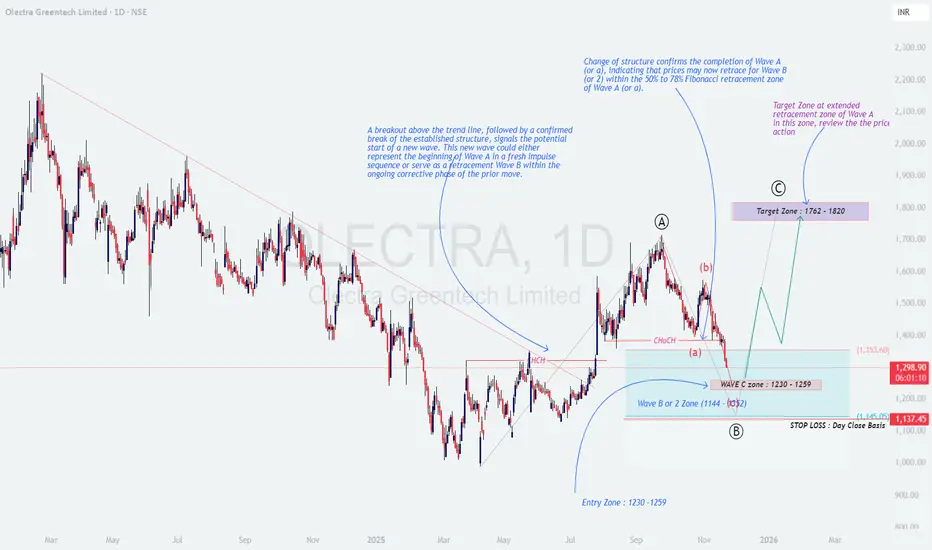
The chart of Olectra Greentech Ltd (1D) shows a well-defined Elliott Wave corrective structure, where price has now entered the expected Wave C completion zone (₹1230–₹1259).
This zone aligns with strong demand + Fibonacci confluence, suggesting a potential end of Wave B/2 and the beginning of a new Wave C impulse.
📌 Price previously made:
A clean Change of Character (ChoCH) → signaling completion of Wave A.
A retracement to the 50–78% retracement zone → forming Wave (b).
A steady fall into Wave C demand zone → now approaching support.
📚 Educational Insights
📘 Change of Structure (ChoCH):
A confirmed break of previous swing highs indicates the first shift from bearish to bullish structure — often the start of new wave formation.
✨ Wave A–B–C Corrections:
Wave B typically retraces 50–78% of Wave A, while Wave C often equals Wave A in size. This structure is playing out perfectly here.
🌀 Extended Retracement Zones:
When prices fall into strong demand (like ₹1230–₹1260), these zones often create big reversal opportunities in impulsive markets.
🎯 Prediction & Targets
If OLECTRA sustains above the ₹1230–₹1259 support zone, a new Wave C rally may unfold.
🎯 First Profit Zone: ₹1,760 – ₹1,820
🎯 Extended Target: ₹1,900+ (if momentum continues)
🛑 Stop Loss: Close below ₹1,137 (invalidates Wave B/2 structure)
💡 Trading Strategy (Educational Purpose Only)
🟢 Entry Zone: ₹1230–₹1259
Wait for reversal candles (hammer, engulfing) or a bullish ChoCH on lower timeframes.
📈 Confirmation:
A break above ₹1,353 strengthens the probability of Wave C starting.
🎯 Targets:
• First Target → ₹1762–₹1820
• Extended Target → ₹1900+
⚖️ Risk Plan:
Risk only 1–2% of capital.
Stick to closing-basis SL at ₹1,137.
🧩 Summary & Outlook
OLECTRA has entered the crucial Wave C completion zone, which is a high-probability reversal area.
If momentum builds from this demand zone, price may begin a fresh Wave C impulse, aiming for ₹1760–₹1820 in the coming weeks.
A breakout above ₹1353 will act as the early confirmation trigger 🔥.
⚠️ Disclaimer
I am not a SEBI-registered analyst.
This analysis is for educational purposes only — not investment advice.
OLECTRA
OlectraThis is bullish parallel channel formation breakout on the upper edge. Though weekly/monthly closing above the supply area 1530-1460 is very important here. However the recent move above 1350-1270 gave good strength to the bulls.
Consider it with time frame of 1.5 yr-2 yrs and stop loss 1280
2000 looks promising in next 6 months

Olectra Greentech – The Silent EV Multibagger in MakingNSE:OLECTRA
📊 Technical Analysis (Weekly Chart)
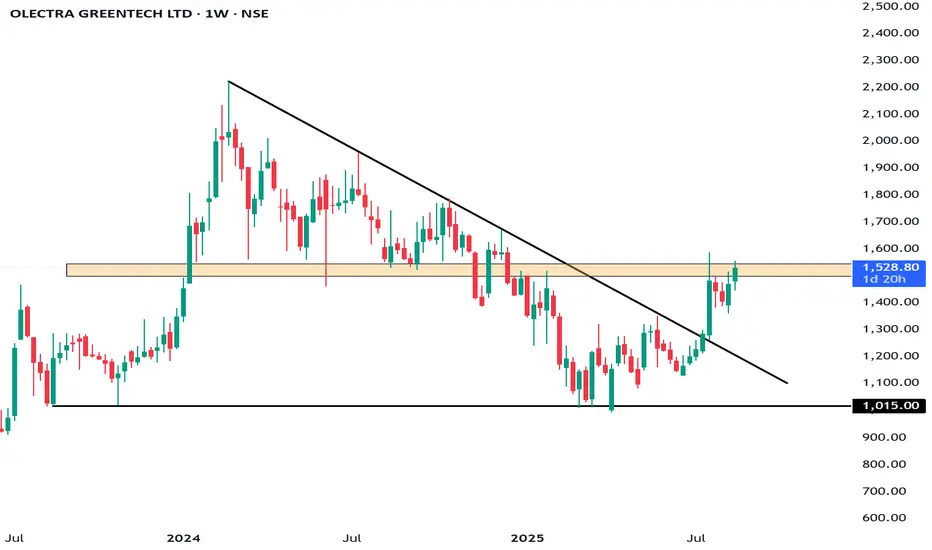
Trend: The stock had a steep fall from ~₹1,800 (2024 highs) to ~₹1,000 (2025 lows). It has since formed a rounded bottom and is showing signs of reversal.
Current Price: ₹1,528.80
Resistance Levels:
₹1,600 (immediate resistance)
₹1,800 (major breakout level)
Support Levels:
₹1,400 (nearby support)
₹1,200 (major support, recent bottom area)
Indicators:
Momentum improving with strong green candles and higher lows.
Weekly structure suggests accumulation and potential trend reversal.
View: If stock sustains above ₹1,600, it can retest ₹1,800–₹2,000 in medium term.
🏭 Fundamental Analysis
Business Model: Olectra Greentech is India’s largest electric bus manufacturer, part of MEIL (Megha Engineering). It also works on tippers, EV trucks, and composite insulators.
Growth Drivers:
Government’s push for EV adoption in public transport (FAME-II scheme).
High demand for electric buses from state transport corporations.
Strong backing from parent MEIL ensures execution capacity.
Financials (Latest FY24/25) (approximate):
Revenue: ~₹1,300–1,400 Cr (growing rapidly with order wins).
Profit: Still moderate due to high R&D and capex.
Order Book: Over ₹12,000+ Cr, ensuring visibility for next 3–4 years.
Strengths:
Market leader in EV bus space.
Rising government contracts.
First-mover advantage.
Risks:
Execution delays (delivery timelines).
Intense competition from Tata Motors, Ashok Leyland.
Margin pressure due to high input and battery costs.
🎯 Conclusion
Technical View: Bullish reversal forming. Sustaining above ₹1,600 can lead to ₹1,800–₹2,000. Strong support at ₹1,200.
Fundamental View: Strong long-term growth story in India’s EV transition, backed by large order book and government support. Near-term volatility possible, but structurally a good EV play.
👉 Investor Stance:
Investors: Accumulate gradually for 3–5 years; could be a multibagger if execution sustains.
⚠️ Disclaimer:
This analysis is for educational and informational purposes only.
We are not SEBI-registered analysts or advisors.
This is our personal view based on available data and market trends.
Please consult your SEBI-registered investment advisor before making any investment or trading decisions.
You are solely responsible for any financial decisions you make based on this content.
========================
Trade Secrets By Pratik
========================
Nifty is preparing for an upcoming event, stance stays bullish So, the market didn’t move as I expected today. My view was sideways to bullish, but the market clearly turned negative.
And that’s the beauty of the market — it has often beaten my 12 years of trading experience and has consistently forced me to learn, adapt, and refine my accuracy.
This is exactly why I love the market — it keeps challenging me, and yet, I’ve managed to stay balanced and continue to grow.
Now, talking about NSE:NIFTY — today’s volatility was completely expected. Remember, I had mentioned that as we move closer to monthly expiry and with earnings season ongoing, volatility will remain high till the end of this month.
For me, Nifty support is at 25000 and resistance at 25150.
The overall chart trend is still bullish, but the market seems to be preparing for some upcoming event — and I’m sure many of you already know what that could be.
Despite the volatility, my portfolio wasn't affected because we I am strictly trading my Earnings Pivot setups.
For example, NSE:SENORES gave a solid 15% move today. But considering market conditions, I booked 80% profit immediately after getting a top-alert.
🎯 In such markets, I will only trade Earnings Pivots.
My recent trades also performed strongly today:
NSE:OLECTRA – 15.45% UP
NSE:FORCEMOT – 11.72% UP
That’s all for today.
Take care.
Have a profitable tomorrow.

"reconnect people by a futuristic way of travel,"🟢 Olectra Greentech Ltd – Positional Breakout Setup in EV Segment ⚡
CMP: ₹1280.90 | NSE: OLECTRA
🔹 Strong trendline support maintained for over 2 years
🔹 Multiple MACD (6/19, 13/55, 20/89) showing early crossover signals
🔹 RSI breakout above 50, now forming higher lows – momentum picking up
🔹 Ichimoku cloud breakout confirmation awaited – early signs of reversal
🔹 Volume holding well, OBV flat – potential accumulation zone
📈 Price breaking out from a long-term triangle pattern; if sustained, targets could open up toward ₹1450–₹1600 in coming months.
📊 Sector tailwind: EV, battery, and green mobility themes remain strong
🌱 Fundamentals supported by order book visibility, policy tailwinds, and infrastructure push
🎯 Ideal for positional traders & long-term investors with a medium-term view.
📝 Note: Please do your own due diligence. This is not a recommendation, just a view based on charts and fundamentals.
🧠 Disclaimer: For educational and research purposes only. No buy/sell advice.
📝 Chart Purpose & Disclaimer:
This chart is shared purely for educational and personal tracking purposes. I use this space to record my views and improve decision-making over time.
Investment Style:
All stocks posted are for long-term investment or minimum positional trades only. No intraday or speculative trades are intended.
⚠️ Disclaimer:
I am not a SEBI registered advisor. These are not buy/sell recommendations. Please consult a qualified financial advisor before taking any investment decision. I do not take responsibility for any profit or loss incurred based on this content.

OLECTRAOLECTRA - If you look at the history of the stock, there was a downfall from 2022 to March 2023, then the stock gave a breakout and a good move came, a similar pattern has formed
Hello traders,
As always, simple and neat charts so everyone can understand and not make it too complicated.
rest details mentioned in the chart.
will be posting more such ideas like this. Until that, like share and follow :)
check my other ideas to get to know about all the successful trades based on price action.
Thanks,
Ajay.
keep learning and keep earning.


Olectra Greentech Limited setting up for big moveOlectra Greentech Limited, a mojor electric bus company, in DTL BO zone.
Also anticipation of BO of AVWAP from 52W High.

Olectra greentech 📈 If 1644 sustains in weekly then 📈 2800 possible within or on 27th May 2024
Disclaimer:
Its a personal view not a financial advise and I assume no responsibility and liability whatever outcome arises.

OLECTRA : Super Bullish move!OLECTRA is in uptrend and currently facing some resistance and some sideways expected. Any dip in the coming days will be an opportunity to fill your average your portfolio. Olectra will make a fresh high soon .
NOTE : I'm not a SEBI REG . Study before investing .

OLECTRAOLECTRA is in a small range and currently moving for a POLE & FLAG pattern. Expect another rally in coming months.
NOTE: I'm not a SEBI REG. Study before you make investment.

Olectra Greentech Ltd - Long Setup, Move is ON...#OLECTRA trading above Resistance of 1501
Next Resistance is at 2108
Support is at 1051
Here are previous charts:
Chart is self explanatory. Levels of breakout, possible up-moves (where stock may find resistances) and support (close below which, setup will be invalidated) are clearly defined.
Disclaimer: This is for demonstration and educational purpose only. This is not buying or selling recommendations. I am not SEBI registered. Please consult your financial advisor before taking any trade.

OLECTRA | Swing Trade📊 DETAILS
Sector: Electronics - Components
Mkt Cap: 10,472 cr
Olectra Greentech Limited was incorporated in 1992. The Company is primarily engaged in the manufacturing of composite polymer insulators and electrical buses. Its registered office is in Hyderabad.
TTM PE : 133.32 (Average PE)
Sector PE : 59.26
Beta : 0.52
📚 INSIGHTS
Strong Performer
Stock with consistent financial performance, quality management, and strong technical momentum indicating good investor enthusiasm. Currently valued at Good to expensive valuation
15.58% away from 52 week high
Underperformer - Olectra Greentech up by 5.42% v/s NIFTY 50 up by 6.91% in last 1 month
📈 FINANCIALS
Piotroski Score of 6/9 indicates Average Financials
Disclaimer: This analysis is for educational purposes only, and I'm not a SEBI registered analyst.
If you found this analysis helpful, I encourage you to like and share it. Your observations and comments are also welcomed below. Your support, likes, follows, and comments motivate me to consistently share valuable insights with you.
🔍 More Analysis & Trade Setups 🔍
For more technical analysis and trade setups, make sure to follow me on TradingView: www.tradingview.com

Olectra prediction on possible movesOlectra formed cup and handle on hourly and retracing near the C&P line ~1800.
Taking support from 1800 it can give target up to 2050
1750 is stop loss for this trade.

Olectra Greentech 1:5 setup for a yearBuy Olectra Greentech between 1215-1250
SL 1094
Target 1: 1457 1:2
Target 2: 1574 1:3
Target 3: 1692 1:4
Target 3: 1812 1:5
Target 4: 2200 Flag pattern target
Duration 6month to 1 year
Buy some quantities 1250-1230 if dips buy more quantity

OLECTRA - Long Setup, Move is ON..NSE:OLECTRA
✅ #OLECTRA trading above Resistance of 1501
✅ Next Resistance is at 2108
Related charts:
Charts are self-explanatory. Levels of breakout, possible up-moves (where stock may find resistances) and support (close below which, setup will be invalidated) are clearly defined.
Disclaimer: This is for demonstration and educational purpose only. This is not buying or selling recommendations. I am not SEBI registered. Please consult your financial advisor before taking any trade.

Olectra Greentech Ltd - Long Setup, Move is ON...#OLECTRA trading above Resistance of 1291
Next Resistance is at 1501
Support is at 817
Here are previous charts:
Chart is self explanatory. Entry, Resistances and Support are mentioned on the chart.
Disclaimer: This is for demonstration and educational purpose only. This is not buying or selling recommendations. I am not SEBI registered. Please consult your financial advisor before taking any trade.

Olectra GreentechOlectra Greentech Looks Good For Swing as well as Investing, Also Goverment announced 8,00,000 Diesel Buses to Be Replace on Indian Roads, so Directllly Benifit to Stock
Also Stock Chart Looking Good, Breaking Major Resistance along with Strong Volume.
KEEP ON RADAR

Olectra Greentech - Manuctures of Ebuses and composite polymer insulators. 50 % promoter holding with zero promoter pledge . Stock has shown continuous upmovement after a news of getting orders from Telengana road transport corporation and Maharashtra Govt. Can expect red due to profit booking. Decreasing trend of promorter holding also gives a negative expectation in short term. Current movement may sustains only if it cross the supply zone. Recent orders from Maharashtra govt, Telengana Govt . hydrogen bus partnership etc gives an immense scope in long term.

OLECTRA - Long Setup, Move is ON..NSE:OLECTRA
✅ #TI trading above Resistance of 1146
✅ Next Resistance is at 1501
Related charts:
Charts are self-explanatory. Levels of breakout, possible up-moves (where stock may find resistances) and support (close below which, setup will be invalidated) are clearly defined.
Disclaimer: This is for demonstration and educational purpose only. This is not buying or selling recommendations. I am not SEBI registered. Please consult your financial advisor before taking any trade.


Olectra Greentech Ltd - Long Setup, Move is ON...#OLECTRA trading above Resistance of 1051
Next Resistance is at 1291
Support is at 765
Here are previous charts:
Chart is self explanatory. Entry, Resistances and Support are mentioned on the chart.
Disclaimer: This is for demonstration and educational purpose only. This is not buying or selling recommendations. I am not SEBI registered. Please consult your financial advisor before taking any trade.

