OLECTRA: Wave C Bottoming? Big Upside Move Brewing!⚡ OLECTRA – Wave C Completion Zone Hit | Is a Strong Reversal & Wave C Rally Coming?
🧠 Overall Chart Context
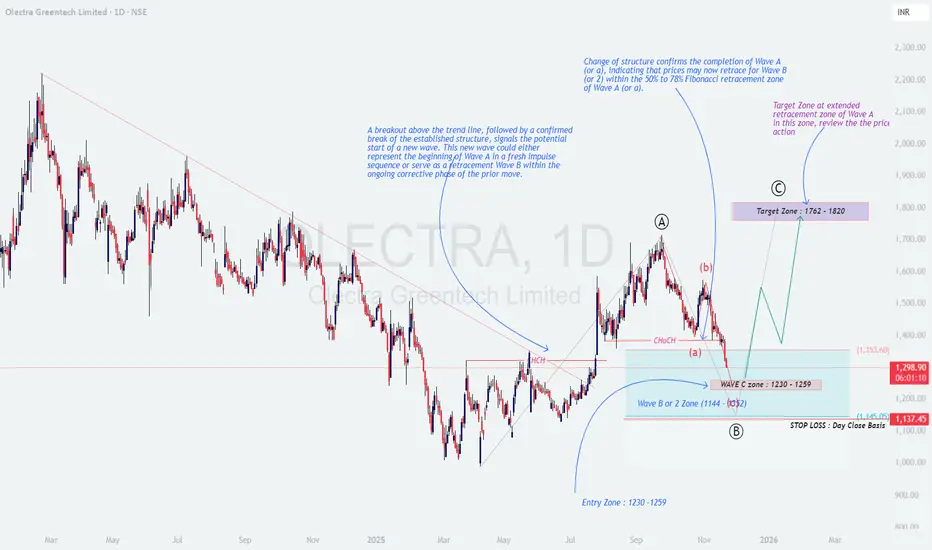
The chart of Olectra Greentech Ltd (1D) shows a well-defined Elliott Wave corrective structure, where price has now entered the expected Wave C completion zone (₹1230–₹1259).
This zone aligns with strong demand + Fibonacci confluence, suggesting a potential end of Wave B/2 and the beginning of a new Wave C impulse.
📌 Price previously made:
A clean Change of Character (ChoCH) → signaling completion of Wave A.
A retracement to the 50–78% retracement zone → forming Wave (b).
A steady fall into Wave C demand zone → now approaching support.
📚 Educational Insights
📘 Change of Structure (ChoCH):
A confirmed break of previous swing highs indicates the first shift from bearish to bullish structure — often the start of new wave formation.
✨ Wave A–B–C Corrections:
Wave B typically retraces 50–78% of Wave A, while Wave C often equals Wave A in size. This structure is playing out perfectly here.
🌀 Extended Retracement Zones:
When prices fall into strong demand (like ₹1230–₹1260), these zones often create big reversal opportunities in impulsive markets.
🎯 Prediction & Targets
If OLECTRA sustains above the ₹1230–₹1259 support zone, a new Wave C rally may unfold.
🎯 First Profit Zone: ₹1,760 – ₹1,820
🎯 Extended Target: ₹1,900+ (if momentum continues)
🛑 Stop Loss: Close below ₹1,137 (invalidates Wave B/2 structure)
💡 Trading Strategy (Educational Purpose Only)
🟢 Entry Zone: ₹1230–₹1259
Wait for reversal candles (hammer, engulfing) or a bullish ChoCH on lower timeframes.
📈 Confirmation:
A break above ₹1,353 strengthens the probability of Wave C starting.
🎯 Targets:
• First Target → ₹1762–₹1820
• Extended Target → ₹1900+
⚖️ Risk Plan:
Risk only 1–2% of capital.
Stick to closing-basis SL at ₹1,137.
🧩 Summary & Outlook
OLECTRA has entered the crucial Wave C completion zone, which is a high-probability reversal area.
If momentum builds from this demand zone, price may begin a fresh Wave C impulse, aiming for ₹1760–₹1820 in the coming weeks.
A breakout above ₹1353 will act as the early confirmation trigger 🔥.
⚠️ Disclaimer
I am not a SEBI-registered analyst.
This analysis is for educational purposes only — not investment advice.
Olectragreentech
Olectra Greentech – The Silent EV Multibagger in MakingNSE:OLECTRA
📊 Technical Analysis (Weekly Chart)
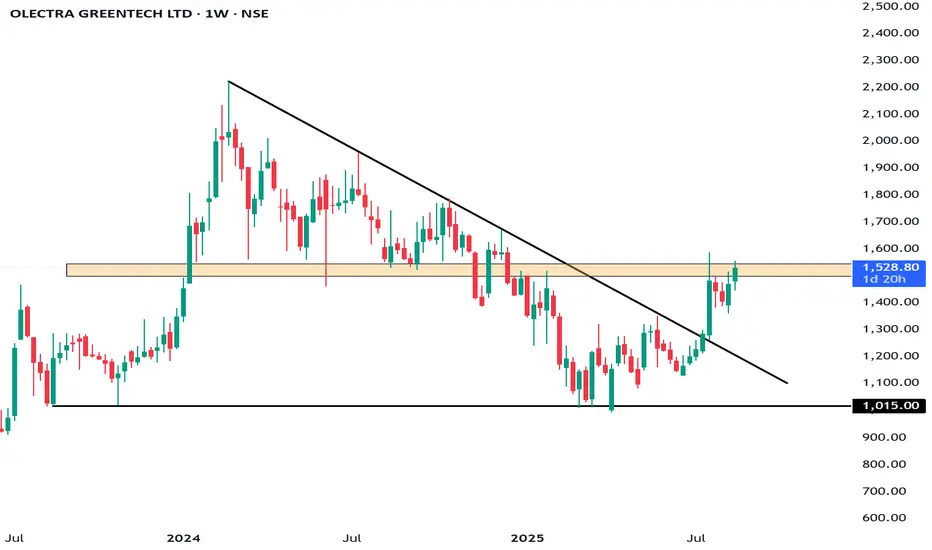
Trend: The stock had a steep fall from ~₹1,800 (2024 highs) to ~₹1,000 (2025 lows). It has since formed a rounded bottom and is showing signs of reversal.
Current Price: ₹1,528.80
Resistance Levels:
₹1,600 (immediate resistance)
₹1,800 (major breakout level)
Support Levels:
₹1,400 (nearby support)
₹1,200 (major support, recent bottom area)
Indicators:
Momentum improving with strong green candles and higher lows.
Weekly structure suggests accumulation and potential trend reversal.
View: If stock sustains above ₹1,600, it can retest ₹1,800–₹2,000 in medium term.
🏭 Fundamental Analysis
Business Model: Olectra Greentech is India’s largest electric bus manufacturer, part of MEIL (Megha Engineering). It also works on tippers, EV trucks, and composite insulators.
Growth Drivers:
Government’s push for EV adoption in public transport (FAME-II scheme).
High demand for electric buses from state transport corporations.
Strong backing from parent MEIL ensures execution capacity.
Financials (Latest FY24/25) (approximate):
Revenue: ~₹1,300–1,400 Cr (growing rapidly with order wins).
Profit: Still moderate due to high R&D and capex.
Order Book: Over ₹12,000+ Cr, ensuring visibility for next 3–4 years.
Strengths:
Market leader in EV bus space.
Rising government contracts.
First-mover advantage.
Risks:
Execution delays (delivery timelines).
Intense competition from Tata Motors, Ashok Leyland.
Margin pressure due to high input and battery costs.
🎯 Conclusion
Technical View: Bullish reversal forming. Sustaining above ₹1,600 can lead to ₹1,800–₹2,000. Strong support at ₹1,200.
Fundamental View: Strong long-term growth story in India’s EV transition, backed by large order book and government support. Near-term volatility possible, but structurally a good EV play.
👉 Investor Stance:
Investors: Accumulate gradually for 3–5 years; could be a multibagger if execution sustains.
⚠️ Disclaimer:
This analysis is for educational and informational purposes only.
We are not SEBI-registered analysts or advisors.
This is our personal view based on available data and market trends.
Please consult your SEBI-registered investment advisor before making any investment or trading decisions.
You are solely responsible for any financial decisions you make based on this content.
========================
Trade Secrets By Pratik
========================
Olectra Greentech – Golden Ratio on MTF + Hidden channel on WTF📝 Description
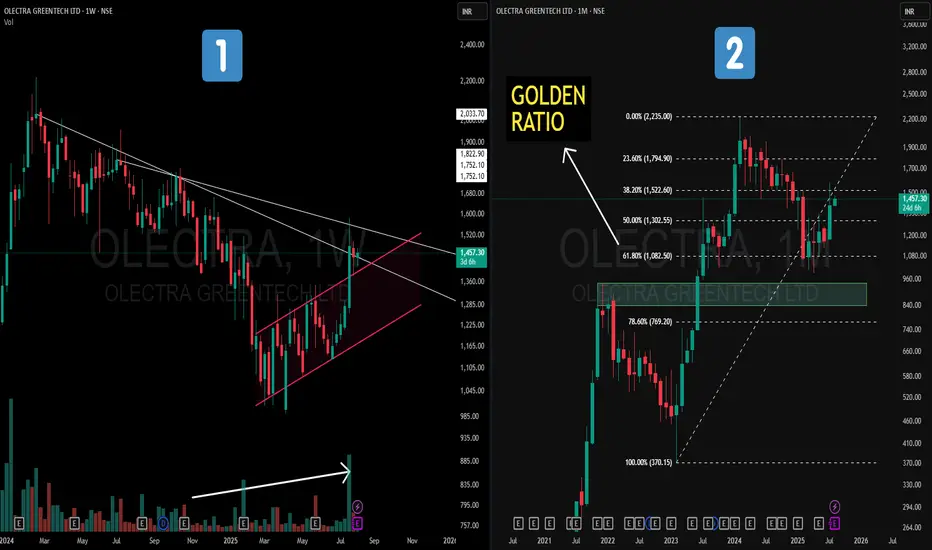
📌On the Weekly Chart (Left) – Price action has formed a strong counter-trend (CT) breakout from a prolonged downtrend. Hidden within the structure is a parallel channel (highlighted in pink), with volume gradually increasing in the recent rally — a positive sign of accumulation.
📌On the Monthly Chart (Right) – A Fibonacci retracement drawn from the Feb 2023 low to the Feb 2024 high (a one-year strong uptrend) shows price taking support exactly at the 61.8% Golden Ratio. This reaction from a key retracement zone is aligned with historical technical behavior.
This is not a forecast, but rather a technical observation of structure, retracement behavior, and volume dynamics.
Olectra BREAKOUTStrong Delivery & Revenue Growth
Q4 FY25 revenue surged 55% YoY to ₹448.9 crore, driven by a 67% increase in deliveries (219 buses vs. 131 last year)
Annual PAT jumped 39% YoY to ₹20.69 crore, showcasing robust operational strength
✅ 2. Massive Order Book & Capacity Expansion
There are 10,022 electric bus orders outstanding, with 2,718 units delivered so far
The company is scaling manufacturing capacity (~5,000 vehicles annually) and expanding into truck tippers and hydrogen bus segments via JV with BYD
mint
.
✅ 3. Technical Breakout Indicates Momentum
The stock has broken out of a triangular consolidation (~₹1,750–1,800) and cleared its 100‑day moving average—signaling strong upside potential
mint
✅ 4. Innovation & Product Edge
Launched Blade Battery technology at Bharat Mobility Global Expo, offering better range, faster charging, and enhanced safety—a potential differentiator
The Times of India
.
✅ 5. Buy, with a target of ₹2,100 levels citing strong order book, government support for EV, and technical breakout
mint
.
Entry good at this level!!

"reconnect people by a futuristic way of travel,"🟢 Olectra Greentech Ltd – Positional Breakout Setup in EV Segment ⚡
CMP: ₹1280.90 | NSE: OLECTRA
🔹 Strong trendline support maintained for over 2 years
🔹 Multiple MACD (6/19, 13/55, 20/89) showing early crossover signals
🔹 RSI breakout above 50, now forming higher lows – momentum picking up
🔹 Ichimoku cloud breakout confirmation awaited – early signs of reversal
🔹 Volume holding well, OBV flat – potential accumulation zone
📈 Price breaking out from a long-term triangle pattern; if sustained, targets could open up toward ₹1450–₹1600 in coming months.
📊 Sector tailwind: EV, battery, and green mobility themes remain strong
🌱 Fundamentals supported by order book visibility, policy tailwinds, and infrastructure push
🎯 Ideal for positional traders & long-term investors with a medium-term view.
📝 Note: Please do your own due diligence. This is not a recommendation, just a view based on charts and fundamentals.
🧠 Disclaimer: For educational and research purposes only. No buy/sell advice.
📝 Chart Purpose & Disclaimer:
This chart is shared purely for educational and personal tracking purposes. I use this space to record my views and improve decision-making over time.
Investment Style:
All stocks posted are for long-term investment or minimum positional trades only. No intraday or speculative trades are intended.
⚠️ Disclaimer:
I am not a SEBI registered advisor. These are not buy/sell recommendations. Please consult a qualified financial advisor before taking any investment decision. I do not take responsibility for any profit or loss incurred based on this content.

Fibonacci Analysis and Key Levels for Olectra Greentech: Tradin
The chart appears to be a technical analysis of Olectra Greentech Ltd, featuring Fibonacci retracement levels, volume data, and RSI. Here's a detailed analysis of the setup:
### 1. **Key Fibonacci Levels**:
- **0.382 Level (Resistance)**: Around ₹1,661.05. The price is currently testing this level. A breakout above it could indicate bullish momentum.
- **0.5 Level (Resistance)**: Near ₹1,585.40, which previously acted as a resistance but now seems broken.
- **0.618 Level (Support)**: Around ₹1,526.70. This level could act as a strong support in case of a retracement.
- **0.786 Level (Support)**: At ₹1,466.00, marking another significant support level.
### 2. **Price Action**:
- The price has shown a recovery from lower levels, breaking above key Fibonacci levels, indicating strong buying pressure.
- The stock is trading at ₹1,651.30, close to resistance zones, suggesting a potential test of higher levels if momentum continues.
### 3. **Volume**:
- Recent green candles are supported by increased volume, signaling strength in the upward move.
- Look for sustained volume to confirm further bullishness.
### 4. **RSI (Relative Strength Index)**:
- The RSI is at **61.72**, which indicates bullish momentum. However, it is nearing overbought levels (above 70), so caution is advised.
### 5. **Potential Scenarios**:
- **Bullish**: A breakout above ₹1,661.05 could lead to testing higher Fibonacci levels like ₹1,750.15 (R3).
- **Bearish**: If the price fails to sustain above ₹1,661.05, it might retrace to support levels at ₹1,585.40 (R1) or ₹1,526.70 (S2).
### 6. **Trading Strategy**:
- **For Long Positions**:
- Enter on a confirmed breakout above ₹1,661.05 with a target around ₹1,750.15.
- Place a stop-loss below ₹1,585.40 for risk management.
- **For Short Positions**:
- Look for rejection signals around ₹1,661.05 to enter shorts.
- Target the support zone at ₹1,526.70, with a stop-loss above ₹1,685.00.
Would you like additional insights or a refined trading plan?

Olectra Greentech Limited setting up for big moveOlectra Greentech Limited, a mojor electric bus company, in DTL BO zone.
Also anticipation of BO of AVWAP from 52W High.

Olectra greentech 📈 If 1644 sustains in weekly then 📈 2800 possible within or on 27th May 2024
Disclaimer:
Its a personal view not a financial advise and I assume no responsibility and liability whatever outcome arises.

OLECTRA : Super Bullish move!OLECTRA is in uptrend and currently facing some resistance and some sideways expected. Any dip in the coming days will be an opportunity to fill your average your portfolio. Olectra will make a fresh high soon .
NOTE : I'm not a SEBI REG . Study before investing .

OLECTRAOLECTRA is in a small range and currently moving for a POLE & FLAG pattern. Expect another rally in coming months.
NOTE: I'm not a SEBI REG. Study before you make investment.

Olectra prediction on possible movesOlectra formed cup and handle on hourly and retracing near the C&P line ~1800.
Taking support from 1800 it can give target up to 2050
1750 is stop loss for this trade.

Olectra Greentech 1:5 setup for a yearBuy Olectra Greentech between 1215-1250
SL 1094
Target 1: 1457 1:2
Target 2: 1574 1:3
Target 3: 1692 1:4
Target 3: 1812 1:5
Target 4: 2200 Flag pattern target
Duration 6month to 1 year
Buy some quantities 1250-1230 if dips buy more quantity

OLECTRA Nice Breakout after consolidating around 6 months."Spotting Opportunity: OLECTRA's Healthy Consolidation Signals a Rounding Bottom Breakout"
For the past six months, our attention has been firmly on OLECTRA, and finally, a promising opportunity is unfolding. Amid a healthy consolidation marked by a rounding bottom, today signifies a pivotal moment. Both the weekly and daily charts for OLECTRA showcase a breakthrough, presenting an opportune time for a strategic, long-term move.
Key Points:
1. Rounding Bottom Consolidation:
- OLECTRA has been undergoing a constructive consolidation, forming a rounding bottom pattern over the past six months. This pattern often indicates a healthy period of stabilization before a potential upward move.
2. Spotting False Breakouts:
- During this consolidation, we've been cautious of false breakouts, but today's development feels different. The rounding bottom pattern enhances the reliability of the breakout signals we're observing.
3. Checking the Charts:
- A meticulous examination of the charts, considering the rounding bottom pattern and utilizing simple indicators, reinforces the authenticity of this breakthrough for OLECTRA on both the weekly and daily charts.
4. It's Official:
- Today is a notable day as both the weekly and daily charts officially confirm that OLECTRA is breaking out of its rounding bottom consolidation. This confirmation provides a green light for a well-timed, longer-term investment.
5. Seizing the Moment:
- With the rounding bottom consolidation adding strength to the breakout, now is an opportune moment to make a thoughtful, long-term investment in OLECTRA. This presents a chance to ride the wave as OLECTRA looks set to ascend.

Olectra GreentechOlectra Greentech Looks Good For Swing as well as Investing, Also Goverment announced 8,00,000 Diesel Buses to Be Replace on Indian Roads, so Directllly Benifit to Stock
Also Stock Chart Looking Good, Breaking Major Resistance along with Strong Volume.
KEEP ON RADAR
